Is headspace making a difference to young people’s lives?
Evaluation-of-headspace-program Evaluation-of-headspace-program
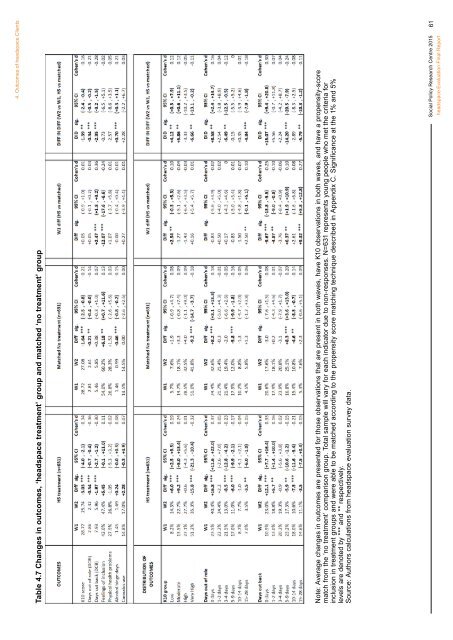
4. Outcomes of headspace Clients Psychological Distress As shown in Table 4.7 below, the mean commencing K10 score was similar for the ‘headspace treatment’ group and the matched ‘no treatment’ group (28.7). A reduction in the average K10 score between Wave 1 and Wave 2 was observed for both groups. The mean K10 score for the ‘headspace treatment’ group decreased by 3 percentage points, while the mean score decreased by 1.6 percentage points for the matched ‘no treatment’ group – both changes are significant at the 1% level. The effect size of the change over time, as measured by Cohen’s d, shows a bigger effect for the ‘headspace treatment’ group (-0.34) than that observed for the matched ‘no treatment’ group (-0.21). The observed difference-in-differences shows that the ‘headspace treatment’ group had a 1.39 percentage points greater reduction in psychological distress when compared to the matched ‘no treatment’ group. This result is significant at the 5% level. The effect size of these differences is relatively weak, with Cohen’s d = -0.16. Turning to the distributional analysis (Table 4.7), a considerable proportion of young people in the ‘headspace treatment’ group transitioned to low or moderate K10 groups over the survey period. Young people in the low K10 classification increased by 6 percentage points and those in the moderate grouping by 9.2 percentage points. Both increases are highly statistically significant. A highly significant decrease in the proportion of young people in the very high K10 grouping was also observed. The matched ‘no treatment’ group recorded a statistically significant reduction in young people within the very high K10 classification between waves 1 and 2; however, this reduction was lower than that experienced by young people treated at headspace. Difference-in-difference results show that three of the four K10 groupings demonstrated more improvement for young people treated at headspace compared with those with similar commencing K10 scores and distributions who had no treatment. These results are statistically significant at the 5% level. Effect sizes of these differences are weak, with Cohen’s d = 0.12. Incapacity The ‘headspace treatment’ group displayed a general reduction in incapacity as measured by the number of days out of role (DOR) and the days cut back (DCB) (Table 4.7). There was an average decrease in days out of role from 2.8 to 2.3 and days cut back from 7.9 to 5.9 for the ‘headspace treatment’ group between Waves 1 and 2. Both differences are significant at the 1% level. The matched ‘no treatment’ group also experienced a decrease in the days out of role between the two waves, from 2.8 to 2.6, which is significant at the 5% level. Days cut back increased slightly for this group; however, the result is not statistically significant. Effect sizes for the ‘headspace treatment’ group are larger than that observed for the ‘no treatment’ group for these indicators of incapacity caused by mental health issues. The difference-in-difference results illustrate that the ‘headspace treatment’ group does slightly better in terms of the reduction of days out of role and days cut back when compared to the matched ‘no treatment’ group between the survey waves. These results are significant at the 1% level. The distributional analysis of days out of role reveals an overall improvement, particularly in the proportion of young people who reported zero days incapacitated by mental health in the last 30 days. This effect is much stronger for the ‘headspace treatment’ group than the matched ‘no treatment’ group (Cohen’s d = 0.37 and 0.18 respectively). Difference-in-difference results show that the ‘headspace treatment’ group increased reports of zero days out of role by 8.6 percentage points more than the group that received ‘no treatment’ over time. This result is statistically significant. A greater reduction in reports of between 15-28 days out of role was observed for the ‘headspace treatment’ group when compared to the ‘no treatment’ group – 4.84 percentage points. This result is also highly statistically reliable and the effect size is estimated at -0.18. Days cut back show similar results, with greater improvements for the ‘headspace treatment’ group in this outcome indicator when compared with the matched ‘no treatment’ group. Of note, however, are the differences in the wave 1 distributions of each treatment group, indicating that the ‘headspace treatment’ group is likely to be experiencing more complex issues, even if the K10 measure is similar. Social Policy Research Centre 2015 headspace Evaluation Final Report 60
4. Outcomes of headspace Clients Table 4.7 Changes in outcomes, ‘headspace treatment’ group and matched ‘no treatment’ group Note: Average changes in outcomes are presented for those observations that are present in both waves, have K10 observations in both waves, and have a propensity-score match from the ‘no treatment’ comparison group. Total sample will vary for each indicator due to non-responses. N=631 represents young people who met the criteria for inclusion in treatment groups and were able to be matched according to the propensity score matching technique described in Appendix C. Significance at the 1% and 5% levels are denoted by *** and ** respectively. Source: Authors calculations from headspace evaluation survey data. Social Policy Research Centre 2015 headspace Evaluation Final Report 61
- Page 19 and 20: 1. Introduction people in Australia
- Page 21 and 22: 2. Evaluation Methodology 2.1 Aims
- Page 23 and 24: 2. Evaluation Methodology Evaluatio
- Page 25 and 26: 2. Evaluation Methodology Table 2.3
- Page 27 and 28: 2. Evaluation Methodology Represent
- Page 29 and 30: 3. Access and Engagement with Centr
- Page 31 and 32: 3. Access and Engagement with Centr
- Page 33 and 34: 3. Access and Engagement with Centr
- Page 35 and 36: 3. Access and Engagement with Centr
- Page 37 and 38: 3. Access and Engagement with Centr
- Page 39 and 40: 3. Access and Engagement with Centr
- Page 41 and 42: 3. Access and Engagement with Centr
- Page 43 and 44: 3. Access and Engagement with Centr
- Page 45 and 46: 3. Access and Engagement with Centr
- Page 47 and 48: 3. Access and Engagement with Centr
- Page 49 and 50: 3. Access and Engagement with Centr
- Page 51 and 52: 4. Outcomes of headspace Clients Th
- Page 53 and 54: 4. Outcomes of headspace Clients 35
- Page 55 and 56: 4. Outcomes of headspace Clients Ch
- Page 57 and 58: 4. Outcomes of headspace Clients No
- Page 59 and 60: 4. Outcomes of headspace Clients Th
- Page 61 and 62: 4. Outcomes of headspace Clients Fi
- Page 63 and 64: 4. Outcomes of headspace Clients A
- Page 65 and 66: 4. Outcomes of headspace Clients Ta
- Page 67 and 68: 4. Outcomes of headspace Clients nu
- Page 69: 4. Outcomes of headspace Clients No
- Page 73 and 74: y three percentage points, and 2.1
- Page 75 and 76: 4. Outcomes of headspace Clients So
- Page 77 and 78: 4. Outcomes of headspace Clients I
- Page 79 and 80: 4. Outcomes of headspace Clients in
- Page 81 and 82: 4. Outcomes of headspace Clients Wh
- Page 83 and 84: 5. Service Delivery Model For the a
- Page 85 and 86: 5. Service Delivery Model the provi
- Page 87 and 88: 5. Service Delivery Model headspace
- Page 89 and 90: 5. Service Delivery Model services,
- Page 91 and 92: 5. Service Delivery Model services
- Page 93 and 94: 5. Service Delivery Model Further,
- Page 95 and 96: 5. Service Delivery Model that we
- Page 97 and 98: 5. Service Delivery Model is a cons
- Page 99 and 100: 5. Service Delivery Model connectio
- Page 101 and 102: 5. Service Delivery Model Table 5.2
- Page 103 and 104: 5. Service Delivery Model Table 5.3
- Page 105 and 106: 5. Service Delivery Model I don’t
- Page 107 and 108: 5. Service Delivery Model group is
- Page 109 and 110: 5. Service Delivery Model Figure 5.
- Page 111 and 112: 6. The Costs of headspace One of th
- Page 113 and 114: 6. The Costs of headspace Table 6.1
- Page 115 and 116: 6. The Costs of headspace In-scope
- Page 117 and 118: 6. The Costs of headspace Revenue/
- Page 119 and 120: 6. The Costs of headspace Other gov
4. Outcomes of <strong>headspace</strong> Clients<br />
Table 4.7 Changes in outcomes, ‘<strong>headspace</strong> treatment’ group and matched ‘no treatment’ group<br />
Note: Average changes in outcomes are presented for those observations that are present in both waves, have K10 observations in both waves, and have a propensity-score<br />
match from the ‘no treatment’ comparison group. Total sample will vary for each indica<strong>to</strong>r due <strong>to</strong> non-responses. N=631 represents <strong>young</strong> people who met the criteria for<br />
inclusion in treatment groups and were able <strong>to</strong> be matched according <strong>to</strong> the propensity score matching technique described in Appendix C. Significance at the 1% and 5%<br />
levels are denoted by *** and ** respectively.<br />
Source: Authors calculations from <strong>headspace</strong> evaluation survey data.<br />
Social Policy Research Centre 2015<br />
<strong>headspace</strong> Evaluation Final Report<br />
61


