Is headspace making a difference to young people’s lives?
Evaluation-of-headspace-program Evaluation-of-headspace-program
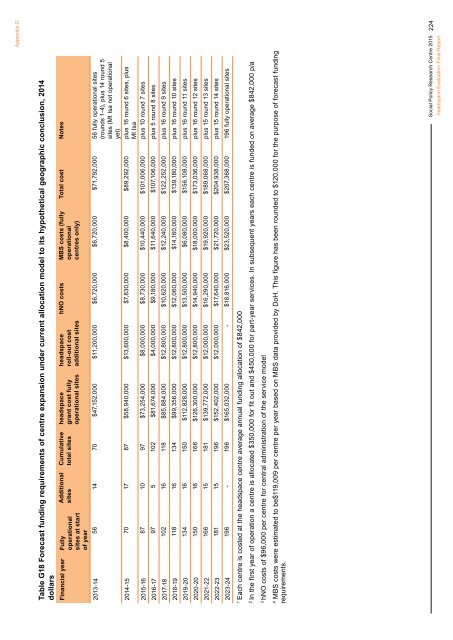
Appendix G Table G18 Forecast funding requirements of centre expansion under current allocation model to its hypothetical geographic conclusion, 2014 dollars Financial year Fully operational sites at start of year Additional sites Cumulative total sites headspace grant cost fully operational sites headspace roll-out cost additional sites hNO costs MBS costs (fully operational centres only) Total cost Notes 2013-14 56 14 70 $47,152,000 $11,200,000 $6,720,000 $6,720,000 $71,792,000 56 fully operational sites (rounds 1-4), plus 14 round 5 sites (Mt Isa not operational yet) 2014-15 70 17 87 $58,940,000 $13,600,000 $7,830,000 $8,400,000 $89,292,000 plus 16 round 6 sites, plus Mt Isa 2015-16 87 10 97 $73,254,000 $8,000,000 $8,730,000 $10,440,000 $101,006,000 plus 10 round 7 sites 2016-17 97 5 102 $81,674,000 $4,000,000 $9,180,000 $11,640,000 $107,106,000 plus 5 round 8 sites 2017-18 102 16 118 $85,884,000 $12,800,000 $10,620,000 $12,240,000 $122,252,000 plus 16 round 9 sites 2018-19 118 16 134 $99,356,000 $12,800,000 $12,060,000 $14,160,000 $139,180,000 plus 16 round 10 sites 2019-20 134 16 150 $112,828,000 $12,800,000 $13,500,000 $6,080,000 $156,108,000 plus 16 round 11 sites 2020-20 150 16 166 $126,300,000 $12,800,000 $14,940,000 $18,000,000 $173,036,000 plus 16 round 12 sites 2021-22 166 15 181 $139,772,000 $12,000,000 $16,290,000 $19,920,000 $189,068,000 plus 15 round 13 sites 2022-23 181 15 196 $152,402,000 $12,000,000 $17,640,000 $21,720,000 $204,938,000 plus 15 round 14 sites 2023-24 196 - 196 $165,032,000 - $18,816,000 $23,520,000 $207,368,000 196 fully operational sites 1 Each centre is costed at the headspace centre average annual funding allocation of $842,000 2 In the first year of operation a centre is allocated $350,000 for fit out and $450,000 for part-year services. In subsequent years each centre is funded on average $842,000 p/a 3 hNO costs of $96,000 per centre for central administration of the service model 4 MBS costs were estimated to be$119,009 per centre per year based on MBS data provided by DoH. This figure has been rounded to $120,000 for the purpose of forecast funding requirements. Social Policy Research Centre 2015 headspace Evaluation Final Report 224
Appendix G Figure G1 Percentage of 12-25 year olds within 10km, 10-30kim and more than 30 km from nearest headspace centre (round 1-8), New South Wales Figure G2 Percentage of 12-25 year olds within 10km, 10 to 30km, and more than 30km from nearest headspace centre (Round 1 to 8), Victoria Social Policy Research Centre 2015 headspace Evaluation Final Report 225
- Page 183 and 184: Appendix C Figure C5 Total number o
- Page 185 and 186: Appendix C Table C1 Information Sum
- Page 187 and 188: Appendix C Data Cleaning and Analys
- Page 189 and 190: Appendix C groups. The age and sex
- Page 191 and 192: Appendix C Figure C8 Demographic ch
- Page 193 and 194: Appendix C The KeySurvey software s
- Page 195 and 196: Appendix C different client groups.
- Page 197 and 198: Appendix D Round State Centre Name
- Page 199 and 200: Appendix E Characteristics HS clien
- Page 201 and 202: Table E4 Cell Sizes for Figure 3.4
- Page 203 and 204: Appendix F Figure F1 Changes in K10
- Page 205 and 206: Appendix F three SEIFA quintiles. A
- Page 207 and 208: Appendix F Occasion of service inte
- Page 209 and 210: Appendix F Table F1 Cell sizes for
- Page 211 and 212: Appendix F Table F4 Cell sizes for
- Page 213 and 214: Appendix F Table F9 Cell sizes for
- Page 215 and 216: Appendix G Supplementary material f
- Page 217 and 218: Appendix G Table G3 Round 3 (10 cen
- Page 219 and 220: Appendix G Table G7 Round 7 (10 cen
- Page 221 and 222: State (youth population) a headspac
- Page 223 and 224: State (youth population) a headspac
- Page 225 and 226: Appendix G Table G12 Round 11(16 ce
- Page 227 and 228: Table G16 Additional youth populati
- Page 229 and 230: Round Region State Additional youth
- Page 231 and 232: State (youth population) a headspac
- Page 233: State (youth population) a headspac
- Page 237 and 238: Appendix G Figure G5 Percentage of
- Page 239 and 240: Appendix G Figure G9 Percentage of
- Page 241 and 242: Appendix G Figure G13 Percentage of
- Page 243 and 244: Appendix G Table G22 Australians 18
- Page 245 and 246: Appendix G Synthetic small area est
- Page 247 and 248: Appendix G Figure G16 Estimated pre
- Page 249 and 250: Appendix G Figure G18 Estimated pre
- Page 251 and 252: Appendix G Figure G20 Estimated pre
- Page 253 and 254: Appendix G Figure G22 SA1s within 1
- Page 255 and 256: Appendix G Figure G24 SA1s within 1
- Page 257 and 258: Appendix G Figure G26 SA1s within 1
- Page 259 and 260: Appendix G Table G25 Centres alloca
- Page 261 and 262: References Atkins, D.C., Bedics, J.
- Page 263: References Smith, E., Jones, T., Wa
Appendix G<br />
Table G18 Forecast funding requirements of centre expansion under current allocation model <strong>to</strong> its hypothetical geographic conclusion, 2014<br />
dollars<br />
Financial year Fully<br />
operational<br />
sites at start<br />
of year<br />
Additional<br />
sites<br />
Cumulative<br />
<strong>to</strong>tal sites<br />
<strong>headspace</strong><br />
grant cost fully<br />
operational sites<br />
<strong>headspace</strong><br />
roll-out cost<br />
additional sites<br />
hNO costs MBS costs (fully<br />
operational<br />
centres only)<br />
Total cost Notes<br />
2013-14 56 14 70 $47,152,000 $11,200,000 $6,720,000 $6,720,000 $71,792,000 56 fully operational sites<br />
(rounds 1-4), plus 14 round 5<br />
sites (Mt <strong>Is</strong>a not operational<br />
yet)<br />
2014-15 70 17 87 $58,940,000 $13,600,000 $7,830,000 $8,400,000 $89,292,000 plus 16 round 6 sites, plus<br />
Mt <strong>Is</strong>a<br />
2015-16 87 10 97 $73,254,000 $8,000,000 $8,730,000 $10,440,000 $101,006,000 plus 10 round 7 sites<br />
2016-17 97 5 102 $81,674,000 $4,000,000 $9,180,000 $11,640,000 $107,106,000 plus 5 round 8 sites<br />
2017-18 102 16 118 $85,884,000 $12,800,000 $10,620,000 $12,240,000 $122,252,000 plus 16 round 9 sites<br />
2018-19 118 16 134 $99,356,000 $12,800,000 $12,060,000 $14,160,000 $139,180,000 plus 16 round 10 sites<br />
2019-20 134 16 150 $112,828,000 $12,800,000 $13,500,000 $6,080,000 $156,108,000 plus 16 round 11 sites<br />
2020-20 150 16 166 $126,300,000 $12,800,000 $14,940,000 $18,000,000 $173,036,000 plus 16 round 12 sites<br />
2021-22 166 15 181 $139,772,000 $12,000,000 $16,290,000 $19,920,000 $189,068,000 plus 15 round 13 sites<br />
2022-23 181 15 196 $152,402,000 $12,000,000 $17,640,000 $21,720,000 $204,938,000 plus 15 round 14 sites<br />
2023-24 196 - 196 $165,032,000 - $18,816,000 $23,520,000 $207,368,000 196 fully operational sites<br />
1<br />
Each centre is costed at the <strong>headspace</strong> centre average annual funding allocation of $842,000<br />
2<br />
In the first year of operation a centre is allocated $350,000 for fit out and $450,000 for part-year services. In subsequent years each centre is funded on average $842,000 p/a<br />
3<br />
hNO costs of $96,000 per centre for central administration of the service model<br />
4<br />
MBS costs were estimated <strong>to</strong> be$119,009 per centre per year based on MBS data provided by DoH. This figure has been rounded <strong>to</strong> $120,000 for the purpose of forecast funding<br />
requirements.<br />
Social Policy Research Centre 2015<br />
<strong>headspace</strong> Evaluation Final Report<br />
224


