Is headspace making a difference to young people’s lives?
Evaluation-of-headspace-program Evaluation-of-headspace-program
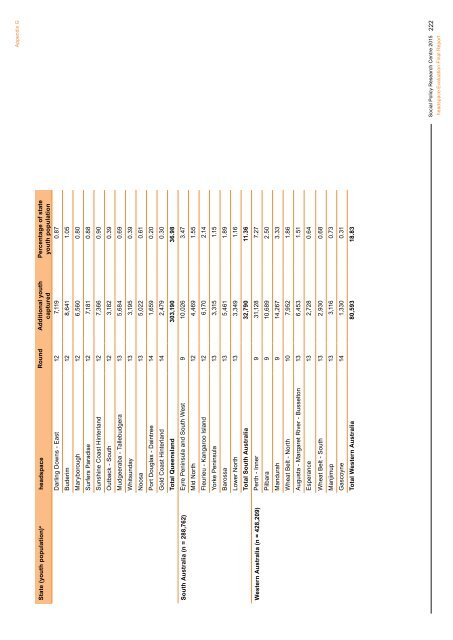
State (youth population) a headspace Round Additional youth captured Percentage of state youth population Darling Downs - East 12 7,119 0.87 Buderim 12 8,641 1.05 Maryborough 12 6,560 0.80 Surfers Paradise 12 7,181 0.88 Sunshine Coast Hinterland 12 7,366 0.90 Outback - South 12 3,182 0.39 Mudgeeraba - Tallebudgera 13 5,684 0.69 Whitsunday 13 3,195 0.39 Noosa 13 5,022 0.61 Port Douglas - Daintree 14 1,659 0.20 Gold Coast Hinterland 14 2,479 0.30 Total Queensland 303,190 36.98 South Australia (n = 288,762) Eyre Peninsula and South West 9 10,026 3.47 Mid North 12 4,469 1.55 Fleurieu - Kangaroo Island 12 6,170 2.14 Yorke Peninsula 13 3,315 1.15 Barossa 13 5,461 1.89 Lower North 13 3,349 1.16 Total South Australia 32,790 11.36 Western Australia (n = 428,209) Perth - Inner 9 31,128 7.27 Pilbara 9 10,689 2.50 Mandurah 9 14,267 3.33 Wheat Belt - North 10 7,952 1.86 Augusta - Margaret River - Busselton 13 6,453 1.51 Esperance 13 2,728 0.64 Wheat Belt - South 13 2,930 0.68 Manjimup 13 3,116 0.73 Gascoyne 14 1,330 0.31 Total Western Australia 80,593 18.83 Appendix G Social Policy Research Centre 2015 headspace Evaluation Final Report 222
State (youth population) a headspace Round Additional youth captured Percentage of state youth population Tasmania (n = 87,341) Burnie - Ulverstone 9 8,359 9.57 North East 11 5,493 6.29 West Coast 13 3,103 3.55 Meander Valley - West Tamar 13 3,324 3.81 Huon - Bruny Island 14 2,531 2.90 Central Highlands 14 1,662 1.90 South East Coast 14 638 0.73 Total Tasmania 25,110 28.75 Northern Territory (n = 44,441) Katherine 11 4,000 9.00 Daly - Tiwi - West Arnhem 11 3,670 8.26 East Arnhem 12 3,133 7.05 Barkly 14 1,347 3.03 Total Northern Territory 12,150 27.34 Australia (n = 3,982,368) 752,054 18.88 a population is as at the 2011 Census of Population and Housing. Appendix G Social Policy Research Centre 2015 headspace Evaluation Final Report 223
- Page 181 and 182: Appendix C Regarding gender, in bot
- Page 183 and 184: Appendix C Figure C5 Total number o
- Page 185 and 186: Appendix C Table C1 Information Sum
- Page 187 and 188: Appendix C Data Cleaning and Analys
- Page 189 and 190: Appendix C groups. The age and sex
- Page 191 and 192: Appendix C Figure C8 Demographic ch
- Page 193 and 194: Appendix C The KeySurvey software s
- Page 195 and 196: Appendix C different client groups.
- Page 197 and 198: Appendix D Round State Centre Name
- Page 199 and 200: Appendix E Characteristics HS clien
- Page 201 and 202: Table E4 Cell Sizes for Figure 3.4
- Page 203 and 204: Appendix F Figure F1 Changes in K10
- Page 205 and 206: Appendix F three SEIFA quintiles. A
- Page 207 and 208: Appendix F Occasion of service inte
- Page 209 and 210: Appendix F Table F1 Cell sizes for
- Page 211 and 212: Appendix F Table F4 Cell sizes for
- Page 213 and 214: Appendix F Table F9 Cell sizes for
- Page 215 and 216: Appendix G Supplementary material f
- Page 217 and 218: Appendix G Table G3 Round 3 (10 cen
- Page 219 and 220: Appendix G Table G7 Round 7 (10 cen
- Page 221 and 222: State (youth population) a headspac
- Page 223 and 224: State (youth population) a headspac
- Page 225 and 226: Appendix G Table G12 Round 11(16 ce
- Page 227 and 228: Table G16 Additional youth populati
- Page 229 and 230: Round Region State Additional youth
- Page 231: State (youth population) a headspac
- Page 235 and 236: Appendix G Figure G1 Percentage of
- Page 237 and 238: Appendix G Figure G5 Percentage of
- Page 239 and 240: Appendix G Figure G9 Percentage of
- Page 241 and 242: Appendix G Figure G13 Percentage of
- Page 243 and 244: Appendix G Table G22 Australians 18
- Page 245 and 246: Appendix G Synthetic small area est
- Page 247 and 248: Appendix G Figure G16 Estimated pre
- Page 249 and 250: Appendix G Figure G18 Estimated pre
- Page 251 and 252: Appendix G Figure G20 Estimated pre
- Page 253 and 254: Appendix G Figure G22 SA1s within 1
- Page 255 and 256: Appendix G Figure G24 SA1s within 1
- Page 257 and 258: Appendix G Figure G26 SA1s within 1
- Page 259 and 260: Appendix G Table G25 Centres alloca
- Page 261 and 262: References Atkins, D.C., Bedics, J.
- Page 263: References Smith, E., Jones, T., Wa
State (youth population) a <strong>headspace</strong> Round Additional youth<br />
captured<br />
Percentage of state<br />
youth population<br />
Darling Downs - East 12 7,119 0.87<br />
Buderim 12 8,641 1.05<br />
Maryborough 12 6,560 0.80<br />
Surfers Paradise 12 7,181 0.88<br />
Sunshine Coast Hinterland 12 7,366 0.90<br />
Outback - South 12 3,182 0.39<br />
Mudgeeraba - Tallebudgera 13 5,684 0.69<br />
Whitsunday 13 3,195 0.39<br />
Noosa 13 5,022 0.61<br />
Port Douglas - Daintree 14 1,659 0.20<br />
Gold Coast Hinterland 14 2,479 0.30<br />
Total Queensland 303,190 36.98<br />
South Australia (n = 288,762) Eyre Peninsula and South West 9 10,026 3.47<br />
Mid North 12 4,469 1.55<br />
Fleurieu - Kangaroo <strong>Is</strong>land 12 6,170 2.14<br />
Yorke Peninsula 13 3,315 1.15<br />
Barossa 13 5,461 1.89<br />
Lower North 13 3,349 1.16<br />
Total South Australia 32,790 11.36<br />
Western Australia (n = 428,209) Perth - Inner 9 31,128 7.27<br />
Pilbara 9 10,689 2.50<br />
Mandurah 9 14,267 3.33<br />
Wheat Belt - North 10 7,952 1.86<br />
Augusta - Margaret River - Bussel<strong>to</strong>n 13 6,453 1.51<br />
Esperance 13 2,728 0.64<br />
Wheat Belt - South 13 2,930 0.68<br />
Manjimup 13 3,116 0.73<br />
Gascoyne 14 1,330 0.31<br />
Total Western Australia 80,593 18.83<br />
Appendix G<br />
Social Policy Research Centre 2015<br />
<strong>headspace</strong> Evaluation Final Report<br />
222


