Is headspace making a difference to young people’s lives?
Evaluation-of-headspace-program Evaluation-of-headspace-program
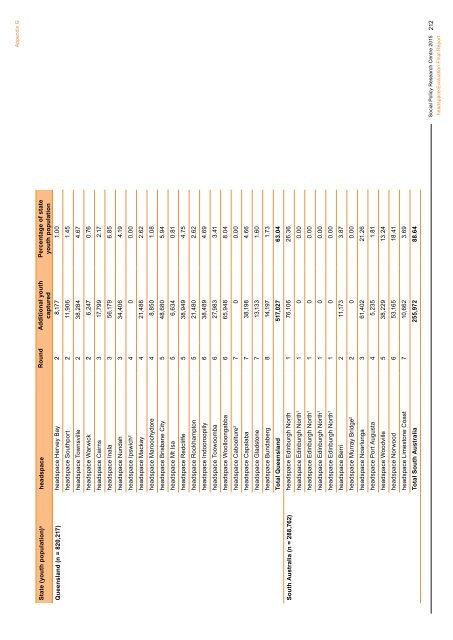
State (youth population) a headspace Round Additional youth captured Percentage of state youth population Queensland (n = 820,217) headspace Hervey Bay 2 8,177 1.00 headspace Southport 2 11,906 1.45 headspace Townsville 2 38,284 4.67 headspace Warwick 2 6,247 0.76 headspace Cairns 3 17,799 2.17 headspace Inala 3 56,179 6.85 headspace Nundah 3 34,406 4.19 headspace Ipswich 2 4 0 0.00 headspace Mackay 4 21,488 2.62 headspace Maroochydore 4 8,850 1.08 headspace Brisbane City 5 48,680 5.94 headspace Mt Isa 5 6,634 0.81 headspace Redcliffe 5 38,949 4.75 headspace Rockhampton 5 21,480 2.62 headspace Indooroopilly 6 38,489 4.69 headspace Toowoomba 6 27,983 3.41 headspace Woolloongabba 6 65,948 8.04 headspace Caboolture 2 7 0 0.00 headspace Capalaba 7 38,198 4.66 headspace Gladstone 7 13,133 1.60 headspace Bundaberg 8 14,197 1.73 Total Queensland 517,027 63.04 South Australia (n = 288,762) headspace Edinburgh North 1 76,106 26.36 headspace Edinburgh North 1 1 0 0.00 headspace Edinburgh North 1 1 0 0.00 headspace Edinburgh North 1 1 0 0.00 headspace Edinburgh North 1 1 0 0.00 headspace Berri 2 11,173 3.87 headspace Murray Bridge 2 2 0 0.00 headspace Noarlunga 3 61,402 21.26 headspace Port Augusta 4 5,235 1.81 headspace Woodville 5 38,229 13.24 headspace Norwood 6 53,165 18.41 headspace Limestone Coast 7 10,662 3.69 Total South Australia 255,972 88.64 Appendix G Social Policy Research Centre 2015 headspace Evaluation Final Report 212
State (youth population) a headspace Round Additional youth captured Percentage of state youth population Western Australia (n = 428,209) headspace Albany 1 9,263 2.16 Fremantle headspace 2 68,604 16.02 headspace Broome 2 6,881 1.61 headspace Osborne Park 3 94,502 22.07 headspace Bunbury 4 17,547 4.10 headspace Midland 4 42,011 9.81 headspace Joondalup 2 5 0 0.00 headspace Rockingham 2 5 0 0.00 headspace Armadale 6 90,391 21.11 headspace Kalgoorlie 6 8,668 2.02 headspace Geraldton 7 9,749 2.28 Total Western Australia 347,616 81.18 Tasmania (n = 87,341) headspace Launceston 2 15,840 18.14 headspace Launceston 1 4 7,200 8.24 headspace Hobart 3 39,191 44.87 Total Tasmania 62,231 71.25 Northern Territory (n = 44,441) headspace Darwin 1 24,652 55.47 Australian Capital Territory (n = 73,462) headspace Alice Springs 2 7,639 17.19 Total Northern Territory 32,291 72.66 headspace Canberra 2 73,462 100.00 Total Australian Capital Territory 73,462 100.00 Australia (n = 3,982,368) 3,204,296 80.46 a population is as at the 2011 Census of Population and Housing. Appendix G Social Policy Research Centre 2015 headspace Evaluation Final Report 213
- Page 171 and 172: Appendix B for greater flexibility
- Page 173 and 174: Appendix B Additional consideration
- Page 175 and 176: Appendix B of achieving more effici
- Page 177 and 178: Appendix B • Used the simulation
- Page 179 and 180: Appendix C information relating to
- Page 181 and 182: Appendix C Regarding gender, in bot
- Page 183 and 184: Appendix C Figure C5 Total number o
- Page 185 and 186: Appendix C Table C1 Information Sum
- Page 187 and 188: Appendix C Data Cleaning and Analys
- Page 189 and 190: Appendix C groups. The age and sex
- Page 191 and 192: Appendix C Figure C8 Demographic ch
- Page 193 and 194: Appendix C The KeySurvey software s
- Page 195 and 196: Appendix C different client groups.
- Page 197 and 198: Appendix D Round State Centre Name
- Page 199 and 200: Appendix E Characteristics HS clien
- Page 201 and 202: Table E4 Cell Sizes for Figure 3.4
- Page 203 and 204: Appendix F Figure F1 Changes in K10
- Page 205 and 206: Appendix F three SEIFA quintiles. A
- Page 207 and 208: Appendix F Occasion of service inte
- Page 209 and 210: Appendix F Table F1 Cell sizes for
- Page 211 and 212: Appendix F Table F4 Cell sizes for
- Page 213 and 214: Appendix F Table F9 Cell sizes for
- Page 215 and 216: Appendix G Supplementary material f
- Page 217 and 218: Appendix G Table G3 Round 3 (10 cen
- Page 219 and 220: Appendix G Table G7 Round 7 (10 cen
- Page 221: State (youth population) a headspac
- Page 225 and 226: Appendix G Table G12 Round 11(16 ce
- Page 227 and 228: Table G16 Additional youth populati
- Page 229 and 230: Round Region State Additional youth
- Page 231 and 232: State (youth population) a headspac
- Page 233 and 234: State (youth population) a headspac
- Page 235 and 236: Appendix G Figure G1 Percentage of
- Page 237 and 238: Appendix G Figure G5 Percentage of
- Page 239 and 240: Appendix G Figure G9 Percentage of
- Page 241 and 242: Appendix G Figure G13 Percentage of
- Page 243 and 244: Appendix G Table G22 Australians 18
- Page 245 and 246: Appendix G Synthetic small area est
- Page 247 and 248: Appendix G Figure G16 Estimated pre
- Page 249 and 250: Appendix G Figure G18 Estimated pre
- Page 251 and 252: Appendix G Figure G20 Estimated pre
- Page 253 and 254: Appendix G Figure G22 SA1s within 1
- Page 255 and 256: Appendix G Figure G24 SA1s within 1
- Page 257 and 258: Appendix G Figure G26 SA1s within 1
- Page 259 and 260: Appendix G Table G25 Centres alloca
- Page 261 and 262: References Atkins, D.C., Bedics, J.
- Page 263: References Smith, E., Jones, T., Wa
State (youth population) a <strong>headspace</strong> Round Additional youth<br />
captured<br />
Percentage of state<br />
youth population<br />
Queensland (n = 820,217) <strong>headspace</strong> Hervey Bay 2 8,177 1.00<br />
<strong>headspace</strong> Southport 2 11,906 1.45<br />
<strong>headspace</strong> Townsville 2 38,284 4.67<br />
<strong>headspace</strong> Warwick 2 6,247 0.76<br />
<strong>headspace</strong> Cairns 3 17,799 2.17<br />
<strong>headspace</strong> Inala 3 56,179 6.85<br />
<strong>headspace</strong> Nundah 3 34,406 4.19<br />
<strong>headspace</strong> Ipswich 2 4 0 0.00<br />
<strong>headspace</strong> Mackay 4 21,488 2.62<br />
<strong>headspace</strong> Maroochydore 4 8,850 1.08<br />
<strong>headspace</strong> Brisbane City 5 48,680 5.94<br />
<strong>headspace</strong> Mt <strong>Is</strong>a 5 6,634 0.81<br />
<strong>headspace</strong> Redcliffe 5 38,949 4.75<br />
<strong>headspace</strong> Rockhamp<strong>to</strong>n 5 21,480 2.62<br />
<strong>headspace</strong> Indooroopilly 6 38,489 4.69<br />
<strong>headspace</strong> Toowoomba 6 27,983 3.41<br />
<strong>headspace</strong> Woolloongabba 6 65,948 8.04<br />
<strong>headspace</strong> Caboolture 2 7 0 0.00<br />
<strong>headspace</strong> Capalaba 7 38,198 4.66<br />
<strong>headspace</strong> Glads<strong>to</strong>ne 7 13,133 1.60<br />
<strong>headspace</strong> Bundaberg 8 14,197 1.73<br />
Total Queensland 517,027 63.04<br />
South Australia (n = 288,762) <strong>headspace</strong> Edinburgh North 1 76,106 26.36<br />
<strong>headspace</strong> Edinburgh North 1 1 0 0.00<br />
<strong>headspace</strong> Edinburgh North 1 1 0 0.00<br />
<strong>headspace</strong> Edinburgh North 1 1 0 0.00<br />
<strong>headspace</strong> Edinburgh North 1 1 0 0.00<br />
<strong>headspace</strong> Berri 2 11,173 3.87<br />
<strong>headspace</strong> Murray Bridge 2 2 0 0.00<br />
<strong>headspace</strong> Noarlunga 3 61,402 21.26<br />
<strong>headspace</strong> Port Augusta 4 5,235 1.81<br />
<strong>headspace</strong> Woodville 5 38,229 13.24<br />
<strong>headspace</strong> Norwood 6 53,165 18.41<br />
<strong>headspace</strong> Limes<strong>to</strong>ne Coast 7 10,662 3.69<br />
Total South Australia 255,972 88.64<br />
Appendix G<br />
Social Policy Research Centre 2015<br />
<strong>headspace</strong> Evaluation Final Report<br />
212


