Is headspace making a difference to young people’s lives?
Evaluation-of-headspace-program Evaluation-of-headspace-program
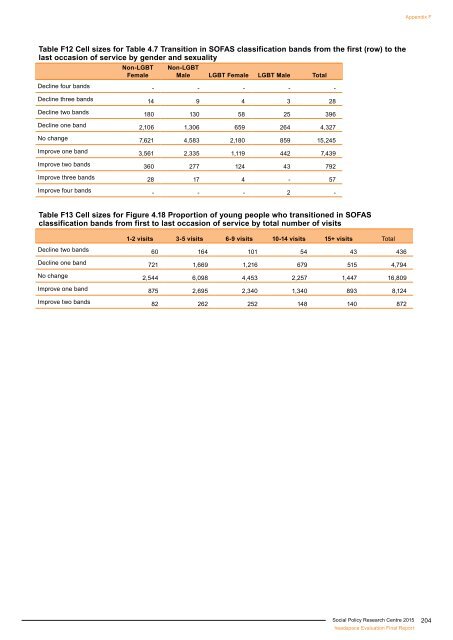
Appendix F Table F12 Cell sizes for Table 4.7 Transition in SOFAS classification bands from the first (row) to the last occasion of service by gender and sexuality Non-LGBT Female Non-LGBT Male LGBT Female LGBT Male Total Decline four bands - - - - - Decline three bands 14 9 4 3 28 Decline two bands 180 130 58 25 396 Decline one band 2,106 1,306 659 264 4,327 No change 7,621 4,583 2,180 859 15,245 Improve one band 3,561 2,335 1,119 442 7,439 Improve two bands 360 277 124 43 792 Improve three bands 28 17 4 - 57 Improve four bands - - - 2 - Table F13 Cell sizes for Figure 4.18 Proportion of young people who transitioned in SOFAS classification bands from first to last occasion of service by total number of visits 1-2 visits 3-5 visits 6-9 visits 10-14 visits 15+ visits Total Decline two bands 60 164 101 54 43 436 Decline one band 721 1,669 1,216 679 515 4,794 No change 2,544 6,098 4,453 2,257 1,447 16,809 Improve one band 875 2,695 2,340 1,340 893 8,124 Improve two bands 82 262 252 148 140 872 Social Policy Research Centre 2015 headspace Evaluation Final Report 204
Appendix G Supplementary material for national expansion analysis Social Policy Research Centre 2015 headspace Evaluation Final Report 205
- Page 163 and 164: Appendix B Evaluation of the curren
- Page 165 and 166: Appendix B Level of funding availab
- Page 167 and 168: Appendix B provide a method for ide
- Page 169 and 170: Appendix B centres and Localities i
- Page 171 and 172: Appendix B for greater flexibility
- Page 173 and 174: Appendix B Additional consideration
- Page 175 and 176: Appendix B of achieving more effici
- Page 177 and 178: Appendix B • Used the simulation
- Page 179 and 180: Appendix C information relating to
- Page 181 and 182: Appendix C Regarding gender, in bot
- Page 183 and 184: Appendix C Figure C5 Total number o
- Page 185 and 186: Appendix C Table C1 Information Sum
- Page 187 and 188: Appendix C Data Cleaning and Analys
- Page 189 and 190: Appendix C groups. The age and sex
- Page 191 and 192: Appendix C Figure C8 Demographic ch
- Page 193 and 194: Appendix C The KeySurvey software s
- Page 195 and 196: Appendix C different client groups.
- Page 197 and 198: Appendix D Round State Centre Name
- Page 199 and 200: Appendix E Characteristics HS clien
- Page 201 and 202: Table E4 Cell Sizes for Figure 3.4
- Page 203 and 204: Appendix F Figure F1 Changes in K10
- Page 205 and 206: Appendix F three SEIFA quintiles. A
- Page 207 and 208: Appendix F Occasion of service inte
- Page 209 and 210: Appendix F Table F1 Cell sizes for
- Page 211 and 212: Appendix F Table F4 Cell sizes for
- Page 213: Appendix F Table F9 Cell sizes for
- Page 217 and 218: Appendix G Table G3 Round 3 (10 cen
- Page 219 and 220: Appendix G Table G7 Round 7 (10 cen
- Page 221 and 222: State (youth population) a headspac
- Page 223 and 224: State (youth population) a headspac
- Page 225 and 226: Appendix G Table G12 Round 11(16 ce
- Page 227 and 228: Table G16 Additional youth populati
- Page 229 and 230: Round Region State Additional youth
- Page 231 and 232: State (youth population) a headspac
- Page 233 and 234: State (youth population) a headspac
- Page 235 and 236: Appendix G Figure G1 Percentage of
- Page 237 and 238: Appendix G Figure G5 Percentage of
- Page 239 and 240: Appendix G Figure G9 Percentage of
- Page 241 and 242: Appendix G Figure G13 Percentage of
- Page 243 and 244: Appendix G Table G22 Australians 18
- Page 245 and 246: Appendix G Synthetic small area est
- Page 247 and 248: Appendix G Figure G16 Estimated pre
- Page 249 and 250: Appendix G Figure G18 Estimated pre
- Page 251 and 252: Appendix G Figure G20 Estimated pre
- Page 253 and 254: Appendix G Figure G22 SA1s within 1
- Page 255 and 256: Appendix G Figure G24 SA1s within 1
- Page 257 and 258: Appendix G Figure G26 SA1s within 1
- Page 259 and 260: Appendix G Table G25 Centres alloca
- Page 261 and 262: References Atkins, D.C., Bedics, J.
- Page 263: References Smith, E., Jones, T., Wa
Appendix F<br />
Table F12 Cell sizes for Table 4.7 Transition in SOFAS classification bands from the first (row) <strong>to</strong> the<br />
last occasion of service by gender and sexuality<br />
Non-LGBT<br />
Female<br />
Non-LGBT<br />
Male LGBT Female LGBT Male Total<br />
Decline four bands - - - - -<br />
Decline three bands 14 9 4 3 28<br />
Decline two bands 180 130 58 25 396<br />
Decline one band 2,106 1,306 659 264 4,327<br />
No change 7,621 4,583 2,180 859 15,245<br />
Improve one band 3,561 2,335 1,119 442 7,439<br />
Improve two bands 360 277 124 43 792<br />
Improve three bands 28 17 4 - 57<br />
Improve four bands - - - 2 -<br />
Table F13 Cell sizes for Figure 4.18 Proportion of <strong>young</strong> people who transitioned in SOFAS<br />
classification bands from first <strong>to</strong> last occasion of service by <strong>to</strong>tal number of visits<br />
1-2 visits 3-5 visits 6-9 visits 10-14 visits 15+ visits Total<br />
Decline two bands 60 164 101 54 43 436<br />
Decline one band 721 1,669 1,216 679 515 4,794<br />
No change 2,544 6,098 4,453 2,257 1,447 16,809<br />
Improve one band 875 2,695 2,340 1,340 893 8,124<br />
Improve two bands 82 262 252 148 140 872<br />
Social Policy Research Centre 2015<br />
<strong>headspace</strong> Evaluation Final Report<br />
204


