Is headspace making a difference to young people’s lives?
Evaluation-of-headspace-program Evaluation-of-headspace-program
Appendix C same time at baseline, and that the follow up would be approximately 9 months later for all three surveys. However, this was not possible to achieve. The difference in timing of the surveys has been taken into account in the outcomes and cost-effectiveness analysis as outlined below. Survey of headspace clients The aim of the longitudinal survey of headspace clients (the intervention group) is to collect information about young people who have accessed headspace services and how these services may have impacted upon their mental health and other relevant outcomes. An initial sample of 1,500 headspace clients was targeted. The survey collection has achieved a first wave sample of 1,582 young people. Two separate data collection processes were initiated for the Wave 1 data collection. The first data collection conducted by Colmar-Brunton resulted in insufficient response rates for the sample. Following joint efforts by headspace and SPRC to promote survey participation, SPRC launched another data collection round, which resulted in a sufficient Wave 1 sample being collected. The evaluators conducted analysis on the headspace clients who participated in the survey to determine their representativeness in comparison to the broader headspace client population. This analysis is presented below. Representativeness of headspace intervention group The objective of this analysis is to assess the representativeness of the headspace survey intervention group over the population of all headspace clients observed within the 2013/14 hCSA dataset. The representativeness of the survey group is important so that the results can be generalised to the overall population. headspace survey participants were matched to the hCSA data and a number of characteristics were assessed and compared. These included demographic and geographical variables, service use and mental health issues and treatment. As the headspace survey intervention group was separated into two data collection cohorts, both groups have been assessed separately and are labelled - intervention group 1 and 2 respectively. Demographic variables We find that individuals are relatively uniformly represented across different ages in the intervention group and the entire population, however the intervention group is more likely to be older than young people in the hCSA data Figure C1). Figure C1 Age distribution – hCSA and intervention survey group Source: Authors calculations from headspace intervention survey data and hCSA data. Social Policy Research Centre 2015 headspace Evaluation Final Report 170
Appendix C Regarding gender, in both groups males are relatively under-represented (with a magnitude of around 10 percentage points) relative to females in the intervention group compared to the entire population. Figure C2 Sex distribution – hCSA and intervention survey group Source: Authors calculations from headspace intervention survey data and hCSA data. Conversely, native-born Australians, those from native-English speaking as well as from non- Indigenous background are relatively over-represented in the headspace survey intervention group compared to the entire population (results not shown). The distribution of individuals across states is relatively uniform in the intervention group and the entire population as is, to an extent, the degree of disadvantage of the localities where the individuals come from, as captured by SEIFA scores. However, those in the intervention group have a higher representation in major city residential origin group, and a lower representation in outer regional group, compared to the entire population. Mental health measures Mental health and behaviour are recorded as the primary presenting issue at first visit for the majority of clients in headspace intervention groups and in the population as a whole (Figure C3). Just over 80% of those in both intervention groups and around 72% in the entire population present with mental health and behaviour issues at their first visit. Figure C3 Primary issues at first visit Source: Authors calculations from headspace intervention survey data and hCSA data. Social Policy Research Centre 2015 headspace Evaluation Final Report 171
- Page 129 and 130: Appendix B The current model of hea
- Page 131 and 132: Appendix B and each SA3 in non-capi
- Page 133 and 134: Appendix B chapter 39 . To determin
- Page 135 and 136: Appendix B While there is an overal
- Page 137 and 138: Appendix B Figure B3 describes the
- Page 139 and 140: Appendix B Figure B5 Cost per young
- Page 141 and 142: Appendix B The concept of access as
- Page 143 and 144: Appendix B Figure B7 Heard of heads
- Page 145 and 146: Figure B10 Proportion of headspace
- Page 147 and 148: Appendix B Table B5 Females 18-25 y
- Page 149 and 150: Appendix B following section. Figur
- Page 151 and 152: Appendix B and less access to mains
- Page 153 and 154: Appendix B Figure B17 Estimated pre
- Page 155 and 156: Appendix B Figure B18 SA1s within 1
- Page 157 and 158: Figure B20 Hypothetical allocation
- Page 159 and 160: Appendix B The current model of cen
- Page 161 and 162: Appendix B Current centre funding m
- Page 163 and 164: Appendix B Evaluation of the curren
- Page 165 and 166: Appendix B Level of funding availab
- Page 167 and 168: Appendix B provide a method for ide
- Page 169 and 170: Appendix B centres and Localities i
- Page 171 and 172: Appendix B for greater flexibility
- Page 173 and 174: Appendix B Additional consideration
- Page 175 and 176: Appendix B of achieving more effici
- Page 177 and 178: Appendix B • Used the simulation
- Page 179: Appendix C information relating to
- Page 183 and 184: Appendix C Figure C5 Total number o
- Page 185 and 186: Appendix C Table C1 Information Sum
- Page 187 and 188: Appendix C Data Cleaning and Analys
- Page 189 and 190: Appendix C groups. The age and sex
- Page 191 and 192: Appendix C Figure C8 Demographic ch
- Page 193 and 194: Appendix C The KeySurvey software s
- Page 195 and 196: Appendix C different client groups.
- Page 197 and 198: Appendix D Round State Centre Name
- Page 199 and 200: Appendix E Characteristics HS clien
- Page 201 and 202: Table E4 Cell Sizes for Figure 3.4
- Page 203 and 204: Appendix F Figure F1 Changes in K10
- Page 205 and 206: Appendix F three SEIFA quintiles. A
- Page 207 and 208: Appendix F Occasion of service inte
- Page 209 and 210: Appendix F Table F1 Cell sizes for
- Page 211 and 212: Appendix F Table F4 Cell sizes for
- Page 213 and 214: Appendix F Table F9 Cell sizes for
- Page 215 and 216: Appendix G Supplementary material f
- Page 217 and 218: Appendix G Table G3 Round 3 (10 cen
- Page 219 and 220: Appendix G Table G7 Round 7 (10 cen
- Page 221 and 222: State (youth population) a headspac
- Page 223 and 224: State (youth population) a headspac
- Page 225 and 226: Appendix G Table G12 Round 11(16 ce
- Page 227 and 228: Table G16 Additional youth populati
- Page 229 and 230: Round Region State Additional youth
Appendix C<br />
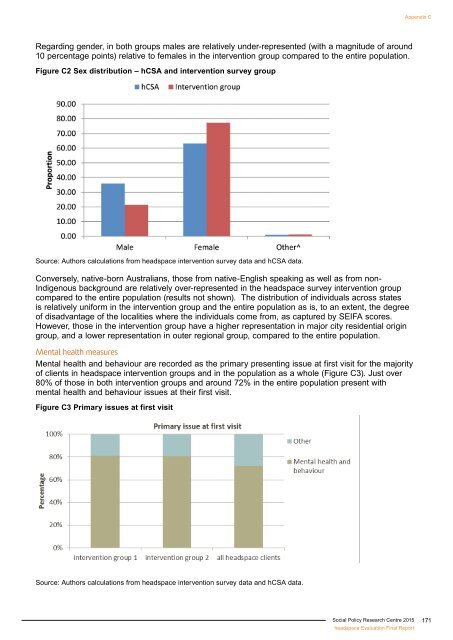
Regarding gender, in both groups males are relatively under-represented (with a magnitude of around<br />
10 percentage points) relative <strong>to</strong> females in the intervention group compared <strong>to</strong> the entire population.<br />
Figure C2 Sex distribution – hCSA and intervention survey group<br />
Source: Authors calculations from <strong>headspace</strong> intervention survey data and hCSA data.<br />
Conversely, native-born Australians, those from native-English speaking as well as from non-<br />
Indigenous background are relatively over-represented in the <strong>headspace</strong> survey intervention group<br />
compared <strong>to</strong> the entire population (results not shown). The distribution of individuals across states<br />
is relatively uniform in the intervention group and the entire population as is, <strong>to</strong> an extent, the degree<br />
of disadvantage of the localities where the individuals come from, as captured by SEIFA scores.<br />
However, those in the intervention group have a higher representation in major city residential origin<br />
group, and a lower representation in outer regional group, compared <strong>to</strong> the entire population.<br />
Mental health measures<br />
Mental health and behaviour are recorded as the primary presenting issue at first visit for the majority<br />
of clients in <strong>headspace</strong> intervention groups and in the population as a whole (Figure C3). Just over<br />
80% of those in both intervention groups and around 72% in the entire population present with<br />
mental health and behaviour issues at their first visit.<br />
Figure C3 Primary issues at first visit<br />
Source: Authors calculations from <strong>headspace</strong> intervention survey data and hCSA data.<br />
Social Policy Research Centre 2015<br />
<strong>headspace</strong> Evaluation Final Report<br />
171


