Is headspace making a difference to young people’s lives?
Evaluation-of-headspace-program Evaluation-of-headspace-program
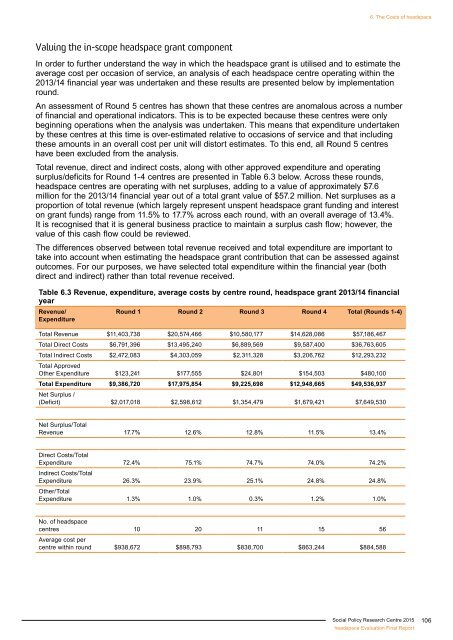
6. The Costs of headspace Valuing the in-scope headspace grant component In order to further understand the way in which the headspace grant is utilised and to estimate the average cost per occasion of service, an analysis of each headspace centre operating within the 2013/14 financial year was undertaken and these results are presented below by implementation round. An assessment of Round 5 centres has shown that these centres are anomalous across a number of financial and operational indicators. This is to be expected because these centres were only beginning operations when the analysis was undertaken. This means that expenditure undertaken by these centres at this time is over-estimated relative to occasions of service and that including these amounts in an overall cost per unit will distort estimates. To this end, all Round 5 centres have been excluded from the analysis. Total revenue, direct and indirect costs, along with other approved expenditure and operating surplus/deficits for Round 1-4 centres are presented in Table 6.3 below. Across these rounds, headspace centres are operating with net surpluses, adding to a value of approximately $7.6 million for the 2013/14 financial year out of a total grant value of $57.2 million. Net surpluses as a proportion of total revenue (which largely represent unspent headspace grant funding and interest on grant funds) range from 11.5% to 17.7% across each round, with an overall average of 13.4%. It is recognised that it is general business practice to maintain a surplus cash flow; however, the value of this cash flow could be reviewed. The differences observed between total revenue received and total expenditure are important to take into account when estimating the headspace grant contribution that can be assessed against outcomes. For our purposes, we have selected total expenditure within the financial year (both direct and indirect) rather than total revenue received. Table 6.3 Revenue, expenditure, average costs by centre round, headspace grant 2013/14 financial year Revenue/ Expenditure Round 1 Round 2 Round 3 Round 4 Total (Rounds 1-4) Total Revenue $11,403,738 $20,574,466 $10,580,177 $14,628,086 $57,186,467 Total Direct Costs $6,791,396 $13,495,240 $6,889,569 $9,587,400 $36,763,605 Total Indirect Costs $2,472,083 $4,303,059 $2,311,328 $3,206,762 $12,293,232 Total Approved Other Expenditure $123,241 $177,555 $24,801 $154,503 $480,100 Total Expenditure $9,386,720 $17,975,854 $9,225,698 $12,948,665 $49,536,937 Net Surplus / (Deficit) $2,017,018 $2,598,612 $1,354,479 $1,679,421 $7,649,530 Net Surplus/Total Revenue 17.7% 12.6% 12.8% 11.5% 13.4% Direct Costs/Total Expenditure 72.4% 75.1% 74.7% 74.0% 74.2% Indirect Costs/Total Expenditure 26.3% 23.9% 25.1% 24.8% 24.8% Other/Total Expenditure 1.3% 1.0% 0.3% 1.2% 1.0% No. of headspace centres 10 20 11 15 56 Average cost per centre within round $938,672 $898,793 $838,700 $863,244 $884,588 Social Policy Research Centre 2015 headspace Evaluation Final Report 106
6. The Costs of headspace Revenue/ Expenditure Round 1 Round 2 Round 3 Round 4 Total (Rounds 1-4) No. of Occasions of service Average cost per OoS 44,669 68,067 36,846 41,189 190,771 $210 $264 $250 $314 $260 Note: Round 5 centres have not been included in this analysis. Data Source: Authors’ calculations from hCSA and hCFA In assessing the allocation of headspace grant funding to individual centres within the 2013/14 financial year and the value of total expenditure as a function of the number of occasion of service, we observed a large degree of heterogeneity at the centre level (results not shown). This variation can be caused by a number of factors including: • operational phase relative to start-up time • an undercount of occasions of services in the headspace centre services allocation data collection 35 • reporting errors in either datasets • variation in centre location and lead agency partnership. Taking only those centres that could be considered fully operational within the 2013/14 financial year (primarily Rounds 1-4 centres), there remain a number of centres that have very high headspace grant investment with relatively low occasions of service. These centres require further investigation as to the underlying causes and operational efficiencies that could be achieved as well as the necessity of the overall grant revenue in receipt. Turning to the variation among centre rounds, we can observe that centres operating in rounds 1-4 record an average cost per occasion of service of $210 - $314. Round 1 centres have the lowest average cost per occasion of service and Round 4 the highest, which is also likely to be a product of the relative newness of these centres in 2013/14. Our estimate for government investment via the headspace grant within the 2013/14 financial year is $260 per occasion of service. This estimate takes into account that the expenditure component only and includes Rounds 1-4 centres. headspace national office headspace centres also receive ongoing support from headspace National Office (hNO). This involves a range of services and support including human resources, compliance training and assistance, information technology, specialised training, clinical support, contract management and community engagement and awareness. The Department of Health has allocated $96,000 per centre annually for hNO to be able to deliver these services. The actual expenditure from this grant component varies, and it is not possible to extract a precise value from the current financial data due to the inter-relationship with other headspace services. The grant allocation of $96,000 per year is taken to be an estimate of the actual expenditure towards support from hNO for each centre. This equates to a value of $6,336,000 for those centres that are in-scope, within the 2013/14 financial year (Rounds 1-4). Medicare Benefits Scheme (MBS) More than 45% of services received at headspace centres attract a Medicare subsidy. This pattern reflects the headspace model and funding arrangements, which were designed to leverage from the MBS. Given the substantial MBS benefit that is realised through headspace centres, we have considered that government investment via the MBS is in-scope for analysis of the overall government investment to provide services to young people at headspace centres across Australia. It is recognised that a number of services that are related to headspace and also attract the MBS 35 This has been an issue in Broome for example, but has recently been addressed. Social Policy Research Centre 2015 headspace Evaluation Final Report 107
- Page 65 and 66: 4. Outcomes of headspace Clients Ta
- Page 67 and 68: 4. Outcomes of headspace Clients nu
- Page 69 and 70: 4. Outcomes of headspace Clients No
- Page 71 and 72: 4. Outcomes of headspace Clients Ta
- Page 73 and 74: y three percentage points, and 2.1
- Page 75 and 76: 4. Outcomes of headspace Clients So
- Page 77 and 78: 4. Outcomes of headspace Clients I
- Page 79 and 80: 4. Outcomes of headspace Clients in
- Page 81 and 82: 4. Outcomes of headspace Clients Wh
- Page 83 and 84: 5. Service Delivery Model For the a
- Page 85 and 86: 5. Service Delivery Model the provi
- Page 87 and 88: 5. Service Delivery Model headspace
- Page 89 and 90: 5. Service Delivery Model services,
- Page 91 and 92: 5. Service Delivery Model services
- Page 93 and 94: 5. Service Delivery Model Further,
- Page 95 and 96: 5. Service Delivery Model that we
- Page 97 and 98: 5. Service Delivery Model is a cons
- Page 99 and 100: 5. Service Delivery Model connectio
- Page 101 and 102: 5. Service Delivery Model Table 5.2
- Page 103 and 104: 5. Service Delivery Model Table 5.3
- Page 105 and 106: 5. Service Delivery Model I don’t
- Page 107 and 108: 5. Service Delivery Model group is
- Page 109 and 110: 5. Service Delivery Model Figure 5.
- Page 111 and 112: 6. The Costs of headspace One of th
- Page 113 and 114: 6. The Costs of headspace Table 6.1
- Page 115: 6. The Costs of headspace In-scope
- Page 119 and 120: 6. The Costs of headspace Other gov
- Page 121 and 122: 7. Conclusion The evaluation of hea
- Page 123 and 124: 7. Conclusion treatment); however,
- Page 125 and 126: 7. Conclusion Overall the evaluatio
- Page 127 and 128: Appendix A Evaluation scope areas h
- Page 129 and 130: Appendix B The current model of hea
- Page 131 and 132: Appendix B and each SA3 in non-capi
- Page 133 and 134: Appendix B chapter 39 . To determin
- Page 135 and 136: Appendix B While there is an overal
- Page 137 and 138: Appendix B Figure B3 describes the
- Page 139 and 140: Appendix B Figure B5 Cost per young
- Page 141 and 142: Appendix B The concept of access as
- Page 143 and 144: Appendix B Figure B7 Heard of heads
- Page 145 and 146: Figure B10 Proportion of headspace
- Page 147 and 148: Appendix B Table B5 Females 18-25 y
- Page 149 and 150: Appendix B following section. Figur
- Page 151 and 152: Appendix B and less access to mains
- Page 153 and 154: Appendix B Figure B17 Estimated pre
- Page 155 and 156: Appendix B Figure B18 SA1s within 1
- Page 157 and 158: Figure B20 Hypothetical allocation
- Page 159 and 160: Appendix B The current model of cen
- Page 161 and 162: Appendix B Current centre funding m
- Page 163 and 164: Appendix B Evaluation of the curren
- Page 165 and 166: Appendix B Level of funding availab
6. The Costs of <strong>headspace</strong><br />
Valuing the in-scope <strong>headspace</strong> grant component<br />
In order <strong>to</strong> further understand the way in which the <strong>headspace</strong> grant is utilised and <strong>to</strong> estimate the<br />
average cost per occasion of service, an analysis of each <strong>headspace</strong> centre operating within the<br />
2013/14 financial year was undertaken and these results are presented below by implementation<br />
round.<br />
An assessment of Round 5 centres has shown that these centres are anomalous across a number<br />
of financial and operational indica<strong>to</strong>rs. This is <strong>to</strong> be expected because these centres were only<br />
beginning operations when the analysis was undertaken. This means that expenditure undertaken<br />
by these centres at this time is over-estimated relative <strong>to</strong> occasions of service and that including<br />
these amounts in an overall cost per unit will dis<strong>to</strong>rt estimates. To this end, all Round 5 centres<br />
have been excluded from the analysis.<br />
Total revenue, direct and indirect costs, along with other approved expenditure and operating<br />
surplus/deficits for Round 1-4 centres are presented in Table 6.3 below. Across these rounds,<br />
<strong>headspace</strong> centres are operating with net surpluses, adding <strong>to</strong> a value of approximately $7.6<br />
million for the 2013/14 financial year out of a <strong>to</strong>tal grant value of $57.2 million. Net surpluses as a<br />
proportion of <strong>to</strong>tal revenue (which largely represent unspent <strong>headspace</strong> grant funding and interest<br />
on grant funds) range from 11.5% <strong>to</strong> 17.7% across each round, with an overall average of 13.4%.<br />
It is recognised that it is general business practice <strong>to</strong> maintain a surplus cash flow; however, the<br />
value of this cash flow could be reviewed.<br />
The <strong>difference</strong>s observed between <strong>to</strong>tal revenue received and <strong>to</strong>tal expenditure are important <strong>to</strong><br />
take in<strong>to</strong> account when estimating the <strong>headspace</strong> grant contribution that can be assessed against<br />
outcomes. For our purposes, we have selected <strong>to</strong>tal expenditure within the financial year (both<br />
direct and indirect) rather than <strong>to</strong>tal revenue received.<br />
Table 6.3 Revenue, expenditure, average costs by centre round, <strong>headspace</strong> grant 2013/14 financial<br />
year<br />
Revenue/<br />
Expenditure<br />
Round 1 Round 2 Round 3 Round 4 Total (Rounds 1-4)<br />
Total Revenue $11,403,738 $20,574,466 $10,580,177 $14,628,086 $57,186,467<br />
Total Direct Costs $6,791,396 $13,495,240 $6,889,569 $9,587,400 $36,763,605<br />
Total Indirect Costs $2,472,083 $4,303,059 $2,311,328 $3,206,762 $12,293,232<br />
Total Approved<br />
Other Expenditure $123,241 $177,555 $24,801 $154,503 $480,100<br />
Total Expenditure $9,386,720 $17,975,854 $9,225,698 $12,948,665 $49,536,937<br />
Net Surplus /<br />
(Deficit) $2,017,018 $2,598,612 $1,354,479 $1,679,421 $7,649,530<br />
Net Surplus/Total<br />
Revenue 17.7% 12.6% 12.8% 11.5% 13.4%<br />
Direct Costs/Total<br />
Expenditure 72.4% 75.1% 74.7% 74.0% 74.2%<br />
Indirect Costs/Total<br />
Expenditure 26.3% 23.9% 25.1% 24.8% 24.8%<br />
Other/Total<br />
Expenditure 1.3% 1.0% 0.3% 1.2% 1.0%<br />
No. of <strong>headspace</strong><br />
centres 10 20 11 15 56<br />
Average cost per<br />
centre within round $938,672 $898,793 $838,700 $863,244 $884,588<br />
Social Policy Research Centre 2015<br />
<strong>headspace</strong> Evaluation Final Report<br />
106


