
You also want an ePaper? Increase the reach of your titles
YUMPU automatically turns print PDFs into web optimized ePapers that Google loves.
Section 7.1 Integral as Net Change 385<br />
Hooke’s Law for springs says that the force it takes to stretch or compress a spring x<br />
units from its natural (unstressed) length is a constant times x. In symbols,<br />
F kx,<br />
where k, measured in force units per unit length, is a characteristic of the spring called the<br />
force constant.<br />
EXAMPLE 7 A Bit of Work<br />
It takes a force of 10 N to stretch a spring 2 m beyond its natural length. How much work<br />
is done in stretching the spring 4 m from its natural length?<br />
SOLUTION<br />
We let Fx represent the force in newtons required to stretch the spring x meters from<br />
its natural length. By Hooke’s Law, Fx kx for some constant k. We are told that<br />
The force required to stretch the<br />
F2 10 k • 2,<br />
spring 2 m is 10 newtons.<br />
so k 5 Nm and Fx 5x for this particular spring.<br />
We construct an integral for the work done in applying F over the interval from x 0<br />
to x 4.<br />
Step 1: Riemann sum. We partition the interval into subintervals on each of which F is<br />
so nearly constant that we can apply the constant-force formula for work. If x k<br />
is any point in the kth subinterval, the value of F throughout the interval is<br />
approximately Fx k 5x k . The work done by F across the interval is<br />
approximately 5x k Δx, where Δx is the length of the interval. The sum<br />
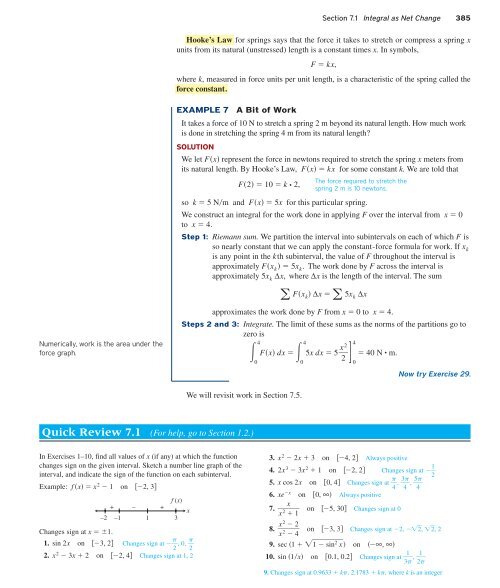
Numerically, work is the area under the<br />
force graph.<br />
Fx k Δx 5x k Δx<br />
approximates the work done by F from x 0 to x 4.<br />
Steps 2 and 3: Integrate. The limit of these sums as the norms of the partitions go to<br />
zero is<br />
4<br />
Fx dx 4<br />
5xdx 5 x 4<br />
2<br />
40 N • m.<br />
2<br />
0<br />
0<br />
]<br />
0<br />
Now try Exercise 29.<br />
We will revisit work in Section 7.5.<br />
Quick Review 7.1 (For help, go to Section 1.2.)<br />
In Exercises 1–10, find all values of x (if any) at which the function<br />
changes sign on the given interval. Sketch a number line graph of the<br />
interval, and indicate the sign of the function on each subinterval.<br />
Example: f x x 2 1 on 2, 3<br />
f (x)<br />
+ – +<br />
–2 –1 1 3<br />
Changes sign at x 1.<br />
1. sin 2x on 3, 2 Changes sign at p 2 ,0, p 2 <br />
2. x 2 3x 2 on 2, 4 Changes sign at 1, 2<br />
x<br />
3. x 2 2x 3 on 4, 2 Always positive<br />
4. 2x 3 3x 2 1 on 2, 2 Changes sign at 1 2 <br />
5. x cos 2x on 0, 4 Changes sign at p 4 , 3 p 5p , <br />
4 4<br />
6. xe x on 0, ∞ Always positive<br />
x<br />
7. x 2 on<br />
1<br />
5, 30 Changes sign at 0<br />
8. x 2<br />
2<br />
x2<br />
on<br />
4<br />
3, 3 Changes sign at 2, 2, 2, 2<br />
9. sec 1 1 sin x 2 on ∞, ∞<br />
1<br />
10. sin 1x on 0.1, 0.2 Changes sign at 3 p , 1<br />
2p <br />
9. Changes sign at 0.9633 kp, 2.1783 kp, where k is an integer