Epi Data Brief
databrief78
databrief78

Create successful ePaper yourself
Turn your PDF publications into a flip-book with our unique Google optimized e-Paper software.
<strong>Epi</strong> <strong>Data</strong> <strong>Brief</strong><br />
New York City Department of Health and Mental Hygiene October 2016, No. 78<br />
Cycling in New York City, 2007 to 2014<br />
People who are physically active are more likely to live longer, healthier<br />
lives. 1 New Yorkers get more of their physical activity through active<br />
transportation, such as walking or cycling, than from recreational<br />
activities, such as exercise or sports participation. 2 New Yorkers are more<br />
likely to walk to work compared with the national average, 3 and a recent<br />
New York City (NYC) Department of Transportation report shows that<br />
cycling is becoming more popular; the most recent annual 12-hour count<br />
of cyclists crossing the East River bridges increased from 2,041 cyclists in<br />
2000 to 15,394 in 2015. 4<br />
The amount of cycling in a city may be influenced by many factors such as<br />
cost, secure bicycle storage, and neighborhood conditions, including access<br />
to bike lanes, parks, and safe streets. 5,6 This report provides information<br />
about the characteristics of cyclists in NYC and how cycling has changed<br />
from 2007 to 2014, overall and by neighborhood.<br />
More New York City residents report cycling once a<br />
month or more<br />
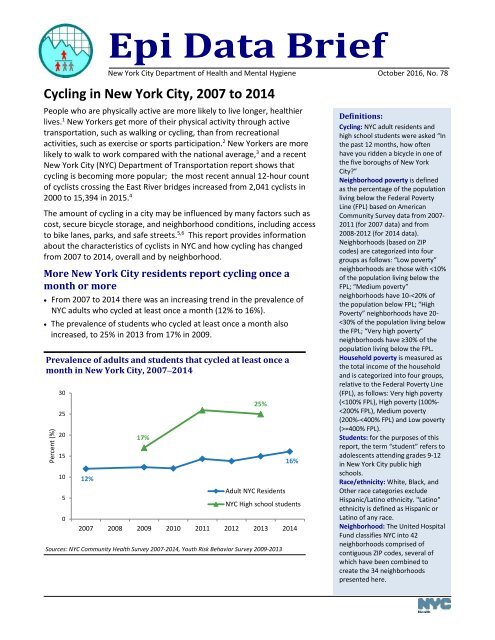
• From 2007 to 2014 there was an increasing trend in the prevalence of<br />
NYC adults who cycled at least once a month (12% to 16%).<br />
• The prevalence of students who cycled at least once a month also<br />
increased, to 25% in 2013 from 17% in 2009.<br />
Prevalence of adults and students that cycled at least once a<br />
month in New York City, 2007‒2014<br />
Percent (%)<br />
30<br />
25<br />
20<br />
15<br />
10<br />
5<br />
0<br />
12%<br />
17%<br />
25%<br />
Adult NYC Residents<br />
16%<br />
NYC High school students<br />
2007 2008 2009 2010 2011 2012 2013 2014<br />
Sources: NYC Community Health Survey 2007-2014, Youth Risk Behavior Survey 2009-2013<br />
Definitions:<br />
Cycling: NYC adult residents and<br />
high school students were asked “In<br />
the past 12 months, how often<br />
have you ridden a bicycle in one of<br />
the five boroughs of New York<br />
City?”<br />
Neighborhood poverty is defined<br />
as the percentage of the population<br />
living below the Federal Poverty<br />
Line (FPL) based on American<br />
Community Survey data from 2007-<br />
2011 (for 2007 data) and from<br />
2008-2012 (for 2014 data).<br />
Neighborhoods (based on ZIP<br />
codes) are categorized into four<br />
groups as follows: “Low poverty”<br />
neighborhoods are those with
<strong>Epi</strong> <strong>Data</strong> <strong>Brief</strong>, No. 78 Page 2<br />
Prevalence of cycling once a month or more increased in most boroughs<br />
• From 2007 to 2014, there was an increase in the prevalence of adults who cycled once a month or more<br />
among residents of Manhattan (12% to 22%), Brooklyn (12% to 16%), Queens (12% to 15%), and Staten Island<br />
(10% to 13%). There was no change in the prevalence of adult residents who cycled once a month or more in<br />
the Bronx.<br />
• The prevalence of adult residents who cycled once a month or more increased in eight NYC neighborhoods<br />
between 2007 and 2014: four neighborhoods in Manhattan (Washington Heights 8% to 19%; East Harlem 6%<br />
to 21%; Upper East Side-Gramercy 9% to 23%; Union Square-Lower Manhattan 15% to 26%), two in Brooklyn<br />
(Bedford Stuyvesant-Crown Heights 8% to 17%; Flatbush 8% to 15%) and one each in the Bronx (Fordham 8%*<br />
to 14%) and Staten Island (Northern Staten Island 9% to 14%). The prevalence in all other neighborhoods did<br />
not change during this period.<br />
• The prevalence of cycling at least once a month or more increased among students living in each of the five<br />
boroughs from 2009 to 2013 (Brooklyn, 17% to 25%; the Bronx, 14% to 21%; Manhattan, 14% to 29%; Queens,<br />
19% to 26%; Staten Island, 19% to 25%).<br />
Prevalence of adult cycling once a month or more by neighborhood, New York City, 2007 and 2014<br />
2007<br />
2014<br />
Bronx<br />
Bronx<br />
Manhattan<br />
Manhattan<br />
Queens<br />
Queens<br />
Brooklyn<br />
Brooklyn<br />
Staten<br />
Island<br />
Staten<br />
Island<br />
Prevalence:<br />
<strong>Epi</strong> <strong>Data</strong> <strong>Brief</strong>, No. 78 Page 3<br />
Cycling has increased in wealthier households<br />
• Cycling once a month or more increased from 2007 through 2014 among adult residents with low (13% to<br />
21%) and medium household poverty (9% to 15%), but not among those with high or very high household<br />
poverty.<br />
• The difference, or gap, between prevalence of cycling once a month or more among adult residents of low<br />
poverty households compared with very high poverty households increased from 2007 to 2014.<br />
Cycling has increased across all neighborhood poverty levels<br />
• The prevalence of adult<br />
residents cycling once a month<br />
or more increased across all<br />
levels of neighborhood<br />
poverty (low poverty, 14% to<br />
20%; medium, 12% to 16%;<br />
high 12% to 15%; and very<br />
high poverty 10% to 13%) from<br />
2007 to 2014. The difference<br />
between these groups (on<br />
average 4.2% lower prevalence<br />
in low compared with very<br />
high poverty neighborhoods) is<br />
similar across the years.<br />
• Cycling once a month or more<br />
increased among adults in two<br />
of three areas where the Health<br />
Department’s Center for Health<br />
Equity is establishing<br />
Neighborhood Health Action<br />
Centers (see note). The<br />
prevalence of cycling once a<br />
month or more increased<br />
between 2007 and 2014 among<br />
residents of East and Central<br />
Harlem (8% to 20%) and North<br />
and Central Brooklyn (12% to<br />
16%); there was no change<br />
among residents of the South<br />
Bronx.<br />
Increase in the prevalence of adults cycling once a month or<br />
more from 2007 to 2014, by household and neighborhood<br />
poverty, New York City<br />
Household<br />
poverty<br />
Neighborhood<br />
poverty<br />
Low (wealthy)<br />
Medium<br />
High<br />
Very high<br />
Low (wealthy)<br />
Medium<br />
High<br />
Very high<br />
The arrows represent the change from 2007 (base of the arrow) to 2014 (end of the arrow) in<br />
the prevalence of adults cycling once a month or more. Arrows marked with a flattened point<br />
indicate a change that is not statistically different from 0.<br />
Household poverty is measured as the total income of the household and is categorized into<br />
four groups, relative FPL: very high poverty (
<strong>Epi</strong> <strong>Data</strong> <strong>Brief</strong>, No. 78 Page 4<br />
Cycling once a month or more increased among several groups of adult New Yorkers<br />
• From 2007 to 2014, the prevalence of cycling once a month or more increased among White (13% to 19%),<br />
Black (10% to 13%) and Latino (13% to 17%) adults. The average difference between these groups (5.1% lower<br />
in Blacks compared with Whites and 2.2% lower in Latinos compared with Whites) was similar across the<br />
years.<br />
• Although cycling once a month or more increased from 2007 to 2014 among adult men (18% to 23%) and<br />
women (7% to 10%), the prevalence was consistently 12% higher in adult men compared with females.<br />
• The prevalence of adults who cycled once a month or more increased during the 2007 to 2014 period among<br />
25 to 44 year olds (14% to 21%) and among 45 to 64 year olds (10% to 13%) but not among 18 to 24 year olds<br />
or those 65 years and older.<br />
Students of both sexes, across racial/ethnic groups and age groups are cycling more<br />
frequently<br />
• Cycling once a month or more increased from 24% in 2009 to 36% in 2013 among male students of public high<br />
schools and from 11% to 14% among female students.<br />
• The difference between males and females in the prevalence of cycling once a month or more increased from<br />
13% in 2009 to 22% in 2013.<br />
• Cycling once a month or more increased among public high school students 14 years old and younger (21%<br />
to 29%), 15 to 17 year olds (15% to 24%), and those 18 years and older (15% to 25%).<br />
• The prevalence of cycling once a month or more increased among White (20% to 30%), Black (16% to 24%),<br />
and Latino (18% to 26%) students. The average difference between these groups (6.9% lower among Blacks<br />
compared with Whites and 4.9% lower among Latinos compared with Whites) did not change from 2009 to<br />
2013.<br />
References:<br />
1. Physical Activity and Health: The Benefits of Physical Activity. Centers for Disease Control Web site. www.cdc.<br />
gov/physicalactivity/basics/pa-health/ index.htm.Accessed August 2, 2016.<br />
2. Dowell D, Olson C, Corey C, Holder-Hayes E, Kheirbek I, Caffarelli A. Health Benefitcs of Active Transposrtation in New York City.<br />
NYC Vital Signs Special Report. 2011; 10(3):1-4.<br />
3. McKenzie B. Modes less traveled: Bicycling and walking to work in the United States: 2008–2012. American Community Survey<br />
Reports. ACS-26. Washington, DC: U.S. Census Bureau, 2014<br />
4. New York City Department of Transportation. Cycling in the city: Cycling trends in NYC. May, 2016.<br />
5. Pucher J, Buehler R. Analysis of bicycling trends and policies in large North American cities: Lessons from New York. University<br />
Transportation Research Center Research <strong>Brief</strong>. Rutgers University, 2011<br />
6. Taylor WC, D. L. Do all children have places to be active? Disparities in access to physical activity environments in racial and ethnic<br />
minority and lower-income communities. Robert Wood Johnson Foundation, 2011.<br />
Authors: Aldo Crossa, Philip Noyes, Hilary Parton, Sungwoo Lim<br />
Suggested citation: Crossa A, Noyes P, Parton H, Lim S. Cycling in New York City, 2007 to 2014. New York City Department of Health<br />
and Mental Hygiene: <strong>Epi</strong> <strong>Data</strong> <strong>Brief</strong> (78); October 2016.<br />
MORE New York City Health <strong>Data</strong> and Publications at nyc.gov/health/data<br />
Visit <strong>Epi</strong>Query – the Health Department’s online, interactive health data system at nyc.gov/health/<strong>Epi</strong>Query<br />
New York City Department of Health and Mental Hygiene October 2016
<strong>Epi</strong> <strong>Data</strong> Tables<br />
New York City Department of Health and Mental Hygiene October 2016, No. 78<br />
Cycling in New York City, 2007 to 2014<br />
<strong>Data</strong> Tables<br />
Table 1.<br />
Table 2.<br />
Table 3.<br />
Table 4.<br />
Prevalence of self-reported cycling activity in New Yorkers 18 years and older, New York City,<br />
2007-2014<br />
Prevalence of self-reported cycling activity in New Yorkers 18 years and older, by neighborhood,<br />
New York City, 2007-2014<br />
Prevalence of self-reported cycling activity among New York City public high school students,<br />
2009-2013<br />
Difference or gap in prevalence of cycling once a month or more in selected subgroups of New<br />
Yorkers. New York City, 2007-2014<br />
<strong>Data</strong> Sources<br />
Community Health Survey (CHS) is conducted annually by the Health Department with approximately 9,000 noninstitutionalized<br />
adults ages 18 and older. <strong>Data</strong> are age-adjusted to the US 2000 standard population. The CHS has<br />
included adults with landline phones since 2002 and, starting in 2009, has included adults who can be reached by<br />
cell-phone. <strong>Data</strong> in the brief are from 2007, 2009, 2010,2011, 2012, 2013 and 2014. For more survey details, visit<br />
nyc.gov/health/survey.<br />
Youth Risk Behavior Survey (YRBS) is a biennial health survey of students in public high schools in New York<br />
City conducted by the Health Department, the NYC Department of Education, and the CDC. <strong>Data</strong> in the brief are<br />
from 2009, 2011, and 2013. For more survey details, visit www1.nyc.gov/site/doh/data/data-sets/nyc-youth-riskbehavior-survey.page.
<strong>Epi</strong> <strong>Data</strong> Tables, No. 78 New York City Department of Health and Mental Hygiene Pages 2-4<br />
Table 1. Prevalence of self-reported cycling activity in New Yorkers 18 years and older, New York City, 2007-2014<br />
Source: NYC Community Health Survey, 2007, 2009, 2011, 2013 and 2014.<br />
CHS data are weighted to the adult residential population per the American Community Survey.<br />
<strong>Data</strong> are age-adjusted to the U.S. 2000 Standard Population<br />
2007 2009 2010 2011 2012<br />
Prevalence<br />
95%<br />
Confidence<br />
Intervals Prevalence<br />
95%<br />
Confidence<br />
Intervals Prevalence<br />
95%<br />
Confidence<br />
Intervals Prevalence<br />
95%<br />
Confidence<br />
Intervals Prevalence<br />
95%<br />
Confidence<br />
Intervals<br />
2013 2014<br />
Prevalence<br />
95%<br />
Confidence<br />
Intervals Prevalence<br />
95%<br />
Confidence<br />
Intervals<br />
p-value‡<br />
Overall<br />
Once a month or more 12.0 11.1-12.9 12.4 11.3-13.5 12.1 11.0-13.3 14.3 13.0-15.8 13.8 12.6-15.1 15.0 14.0-16.0 16.1 15.0-17.3 0.000<br />
Less than once a month 10.0 9.2-10.9 8.0 7.2-9.0 7.4 6.5-8.4 9.3 8.2-10.6 8.2 7.3-9.1 7.8 7.1-8.6 8.4 7.6-9.3 0.021<br />
None/Unable 78.0 76.8-79.1 79.6 78.3-80.9 80.5 U 79.1-81.8 76.4 74.6-78.0 78.0 76.6-79.4 77.2 76.0-78.4 75.5 D 74.2-76.8 0.000<br />
Sex<br />
Male<br />
Once a month or more 17.9 16.3-19.5 18.8 17.0-20.7 18.1 16.3-20.1 21.0 18.7-23.5 20.1 18.2-22.2 22.5 20.8-24.3 23.1 21.3-25.0 0.000<br />
Less than once a month 12.8 11.4-14.3 9.9 8.5-11.4 8.9 7.5-10.5 11.4 9.6-13.4 9.6 8.3-11.1 8.9 7.7-10.2 10.8 9.5-12.3 0.027<br />
None/Unable 69.3 67.5-71.2 71.3 69.2-73.3 73.0 70.7-75.1 67.6 64.9-70.2 70.3 68.1-72.5 68.6 66.6-70.5 66.1 64.1-68.1 0.002<br />
Female<br />
Once a month or more 6.7 5.8-7.7 6.7 5.7-7.9 6.7 5.6-8.0 8.5 D 7.1-10.1 8.3 7.0-9.7 8.2 7.1-9.3 9.8 8.5-11.3 0.000<br />
Less than once a month 7.5 U 6.6-8.6 6.4 5.4-7.6 6.1 5.0-7.4 7.5 U 6.2-9.2 7.0 5.9-8.2 6.9 5.9-8.0 6.3 5.3-7.3 0.345<br />
None/Unable 85.8 84.4-87.0 86.9 85.4-88.3 87.2 85.6-88.7 84.0 81.9-85.9 84.8 83.0-86.4 85.0 83.5-86.3 83.9 82.3-85.5 0.005<br />
Age group (years)<br />
18-24<br />
Once a month or more 21.7 17.8-26.1 21.6 17.0-27.0 20.4 15.7-26.0 24.9 19.6-31.1 21.8 17.3-27.1 23.9 20.3-28.0 25.5 D 21.5-29.9 0.142<br />
Less than once a month 18.1 14.4-22.3 9.8 6.7-13.9 12.9 9.3-17.6 13.3 9.6-18.1 11.9 8.9-15.8 14.3 11.4-17.9 16.2 12.9-20.2 0.917<br />
None/Unable 60.3 55.2-65.1 68.7 62.8-74.0 66.7 60.6-72.3 61.8 55.3-67.9 66.3 60.7-71.4 61.7 57.2-66.0 58.3 53.5-62.9 0.232<br />
25-44<br />
Once a month or more 13.9 12.5-15.6 14.4 12.7-16.3 14.8 12.9-16.9 17.5 D 15.1-20.2 17.2 15.1-19.4 19.3 17.4-21.3 20.5 U 18.4-22.8 0.000<br />
Less than once a month 11.8 10.4-13.3 10.2 8.8-11.8 9.4 7.8-11.3 12.5 U 10.4-15.0 11.4 9.7-13.2 9.1 7.9-10.6 10.8 9.4-12.5 0.356<br />
None/Unable 74.3 72.3-76.2 75.4 73.1-77.5 75.8 73.2-78.1 70.0 66.8-73.0 71.5 D 68.9-73.9 71.6 69.3-73.7 68.7 66.2-71.0 0.000<br />
45-64<br />
Once a month or more 9.7 8.6-10.9 10.4 9.0-11.9 9.8 8.5-11.3 11.3 9.5-13.4 10.8 9.3-12.5 11.2 9.8-12.7 13.1 11.6-14.9 0.001<br />
Less than once a month 8.6 7.4-9.9 7.9 6.5-9.4 5.7 4.7-6.9 7.6 6.1-9.4 5.8 4.8-7.0 6.6 5.6-7.8 5.4 4.4-6.6 0.000<br />
None/Unable 81.8 80.1-83.3 81.8 79.8-83.6 84.4 82.6-86.0 81.1 78.5-83.4 83.4 81.4-85.1 82.2 80.4-83.9 81.5 D 79.5-83.3 0.881<br />
65+<br />
Once a month or more 4.2 3.2-5.4 4.0 3.2-5.0 3.3 2.5-4.4 4.2 3.0-5.9 5.1 3.8-7.0 4.7 3.6-6.0 3.8 2.9-5.0 0.517<br />
Less than once a month 2.4 1.6-3.6 1.9 1.3-2.7 1.4 0.9-2.2 1.7 1.1-2.6 2.0 1.3-3.0 1.9 1.1-3.3 2.1 1.4-3.1 0.775<br />
None/Unable 93.4 91.8-94.7 94.1 92.9-95.2 95.3 94.0-96.3 94.1 92.3-95.5 92.9 90.9-94.4 93.4 91.7-94.8 94.1 92.6-95.3 0.743<br />
Confidence Intervals (CIs) are a measure of estimate precision: the wider the CI, the more imprecise the estimate.<br />
D When rounding to the nearest whole number, round down.<br />
U When rounding to the nearest whole number, round up.<br />
‡ p-value was calculated by contructing logistic regression model with the outcome of biking frequecy (dichotomized to yes for for each category), including year as a depedent variable and testing that thre regression coefficient be greater than 0<br />
* Estimates should be interpreted with caution, potentially unreliable<br />
^ <strong>Data</strong> are supressed due to imprecise unreliable estimates<br />
**Race/ethnicity: White, Black, Asian/Pacific Island, and Other race categories exclude Hispanic/Latino ethnicity. "Latino" ethnicity is defined as Hispanic or Latino of any race.<br />
¤Household poverty is measured as the total income of the household and is categorized into four groups, relative to the Federal Poverty Line (FPL), as follows: Very high poverty (
<strong>Epi</strong> <strong>Data</strong> Tables, No. 78 New York City Department of Health and Mental Hygiene Pages 2-4<br />
Table 1. Prevalence of self-reported cycling activity in New Yorkers 18 years and older, New York City, 2007-2014<br />
Source: NYC Community Health Survey, 2007, 2009, 2011, 2013 and 2014.<br />
CHS data are weighted to the adult residential population per the American Community Survey.<br />
<strong>Data</strong> are age-adjusted to the U.S. 2000 Standard Population<br />
2007 2009 2010 2011 2012<br />
Prevalence<br />
95%<br />
Confidence<br />
Intervals Prevalence<br />
95%<br />
Confidence<br />
Intervals Prevalence<br />
95%<br />
Confidence<br />
Intervals Prevalence<br />
95%<br />
Confidence<br />
Intervals Prevalence<br />
95%<br />
Confidence<br />
Intervals<br />
2013 2014<br />
Prevalence<br />
95%<br />
Confidence<br />
Intervals Prevalence<br />
95%<br />
Confidence<br />
Intervals<br />
Race/Ethnicity**<br />
White<br />
Once a month or more 13.4 11.8-15.3 14.6 12.8-16.7 15.1 13.2-17.2 17.2 14.6-20.1 17.0 14.6-19.6 17.7 15.7-19.8 18.7 16.4-21.2 0.000<br />
Less than once a month 10.3 8.9-11.9 9.7 8.3-11.4 9.0 7.3-11.1 10.8 8.7-13.2 9.5 D 7.8-11.4 10.8 9.2-12.7 10.7 8.9-12.8 0.714<br />
None/Unable 76.3 74.1-78.3 75.7 73.3-77.9 75.9 73.3-78.3 72.1 68.8-75.1 73.6 70.7-76.2 71.5 U 69.0-73.9 70.6 67.9-73.2 0.000<br />
Black<br />
Once a month or more 9.7 8.3-11.5 10.0 8.0-12.3 7.0 5.6-8.8 13.1 10.5-16.4 12.4 10.2-15.1 12.9 10.9-15.2 12.8 10.8-15.0 0.000<br />
Less than once a month 9.9 8.5-11.5 8.1 6.3-10.3 6.9 5.3-8.9 8.3 6.2-11.0 7.5 D 5.9-9.4 7.2 5.6-9.0 8.0 6.5-9.8 0.061<br />
None/Unable 80.3 78.2-82.3 82.0 79.1-84.5 86.1 83.6-88.3 78.6 74.9-81.8 80.1 77.2-82.7 80.0 77.3-82.4 79.3 76.7-81.6 0.060<br />
Latino<br />
Once a month or more 13.4 11.6-15.3 12.0 10.1-14.2 12.5 D 10.4-14.9 13.3 11.1-15.9 14.2 12.1-16.5 15.7 13.9-17.6 17.4 15.4-19.7 0.000<br />
Less than once a month 10.5 U 8.9-12.4 6.1 4.8-7.8 5.6 4.4-7.2 9.1 7.2-11.4 7.4 5.9-9.1 5.9 4.9-7.1 6.7 5.5-8.0 0.003<br />
None/Unable 76.1 73.8-78.3 81.9 79.4-84.1 81.9 79.3-84.3 77.6 74.5-80.4 78.5 D 75.9-80.8 78.4 76.4-80.4 75.9 73.6-78.1 0.102<br />
Asian/Pacific Islander<br />
Once a month or more 8.4 6.1-11.5 10.2 7.5-13.7 9.7 6.8-13.6 10.2 7.1-14.5 8.1 5.5-11.6 9.3 7.3-11.7 11.2 8.9-14.0 0.400<br />
Less than once a month 5.9 3.9-8.7 6.3 4.4-8.9 6.9 4.2-11.0 7.8 5.2-11.5 7.2 5.1-9.9 5.5 U 4.0-7.5 6.9 5.0-9.5 0.653<br />
None/Unable 85.8 82.0-88.8 83.5 U 79.6-86.8 83.5 D 78.6-87.4 82.0 77.0-86.0 84.8 80.8-88.1 85.2 82.3-87.7 81.9 78.6-84.8 0.317<br />
Other<br />
Once a month or more 12.4 7.7-19.4 9.9 5.5-17.2 15.7 9.4-25.1 19.1 * 10.5-32.1 15.3 8.4-26.2 15.9 9.5-25.5 18.4 11.7-27.7 0.243<br />
Less than once a month 8.7 5.3-13.9 8.2 * 3.8-16.9 10.3 * 4.6-21.7 5.7 ^ 2.0-14.9 8.0 * 3.8-16.0 8.3 * 4.2-15.7 6.8 3.8-11.8 0.709<br />
None/Unable 78.9 71.5-84.8 81.9 72.2-88.8 74.0 63.6-82.2 75.2 * 62.4-84.8 76.7 65.9-84.8 75.8 65.9-83.5 74.9 65.3-82.4 0.416<br />
Borough<br />
The Bronx<br />
Once a month or more 12.3 10.1-14.8 9.3 7.3-11.7 10.1 8.1-12.5 13.0 9.9-16.8 10.0 7.6-12.9 11.5 U 9.6-13.8 11.7 9.6-14.1 0.788<br />
Less than once a month 8.5 D 6.6-10.9 6.8 5.1-8.9 6.3 4.5-8.6 7.4 5.4-10.1 7.5 D 5.7-9.7 5.8 4.5-7.4 5.5 U 4.2-7.3 0.056<br />
None/Unable 79.3 76.2-82.0 84.0 81.1-86.5 83.7 80.7-86.3 79.6 75.6-83.2 82.6 79.3-85.4 82.7 80.2-85.0 82.8 80.1-85.2 0.295<br />
Brooklyn<br />
Once a month or more 12.3 10.9-13.9 12.8 11.0-14.9 11.7 10.0-13.7 16.2 13.7-19.1 15.7 13.5-18.1 15.2 13.3-17.2 15.9 14.0-18.0 0.000<br />
Less than once a month 9.9 8.6-11.4 7.8 6.4-9.5 7.8 6.2-9.7 10.6 8.5-13.1 7.9 6.4-9.7 7.3 6.0-8.9 8.7 7.2-10.5 0.208<br />
None/Unable 77.8 75.9-79.6 79.4 77.0-81.6 80.5 U 78.0-82.7 73.2 70.0-76.2 76.4 73.7-78.8 77.5 U 75.2-79.7 75.4 73.0-77.6 0.015<br />
Manhattan<br />
Once a month or more 12.5 D 10.4-14.9 14.7 12.2-17.6 13.5 U 11.0-16.5 15.5 D 12.3-19.4 14.1 11.7-16.8 17.6 15.4-20.0 22.4 19.7-25.3 0.000<br />
Less than once a month 10.7 8.7-13.1 8.1 6.2-10.4 8.1 6.2-10.6 10.9 8.0-14.5 9.5 D 7.5-12.0 9.4 7.7-11.5 11.1 9.1-13.4 0.378<br />
None/Unable 76.9 74.0-79.6 77.3 73.9-80.3 78.4 75.0-81.5 73.7 69.2-77.7 76.4 73.2-79.4 73.0 70.2-75.7 66.6 63.5-69.5 0.000<br />
Queens<br />
Once a month or more 11.7 10.0-13.6 12.3 10.3-14.5 12.6 10.3-15.2 13.9 11.6-16.4 13.5 D 11.3-16.0 14.4 12.4-16.7 14.7 12.5-17.2 0.008<br />
Less than once a month 9.8 8.3-11.7 9.1 7.4-11.0 7.0 5.4-9.2 8.1 6.4-10.3 7.4 6.0-9.1 8.2 6.7-9.8 7.9 6.4-9.6 0.077<br />
None/Unable 78.5 U 76.2-80.7 78.7 76.1-81.1 80.4 77.5-83.0 78.0 75.0-80.7 79.2 76.4-81.7 77.4 74.9-79.8 77.4 74.7-79.9 0.280<br />
Staten Island<br />
Once a month or more 9.5 U 6.7-13.3 10.5 U 7.6-14.3 11.3 7.6-16.5 7.0 4.8-10.1 14.7 10.6-19.9 16.3 12.4-21.3 12.6 9.4-16.8 0.013<br />
Less than once a month 14.5 U 11.1-18.8 7.6 5.3-10.9 7.6 5.1-11.0 8.0 4.6-13.7 10.2 6.8-14.9 8.6 6.1-11.9 7.4 5.0-10.7 0.021<br />
None/Unable 76.0 71.3-80.1 81.9 77.4-85.6 81.1 75.6-85.7 85.0 79.2-89.4 75.2 69.4-80.2 75.1 70.0-79.6 80.0 75.3-84.0 0.746<br />
Confidence Intervals (CIs) are a measure of estimate precision: the wider the CI, the more imprecise the estimate.<br />
D When rounding to the nearest whole number, round down.<br />
U When rounding to the nearest whole number, round up.<br />
‡ p-value was calculated by contructing logistic regression model with the outcome of biking frequecy (dichotomized to yes for for each category), including year as a depedent variable and testing that thre regression coefficient be greater than 0<br />
* Estimates should be interpreted with caution, potentially unreliable<br />
^ <strong>Data</strong> are supressed due to imprecise unreliable estimates<br />
**Race/ethnicity: White, Black, Asian/Pacific Island, and Other race categories exclude Hispanic/Latino ethnicity. "Latino" ethnicity is defined as Hispanic or Latino of any race.<br />
¤Household poverty is measured as the total income of the household and is categorized into four groups, relative to the Federal Poverty Line (FPL), as follows: Very high poverty (
<strong>Epi</strong> <strong>Data</strong> Tables, No. 78 New York City Department of Health and Mental Hygiene Pages 2-4<br />
Table 1. Prevalence of self-reported cycling activity in New Yorkers 18 years and older, New York City, 2007-2014<br />
Source: NYC Community Health Survey, 2007, 2009, 2011, 2013 and 2014.<br />
CHS data are weighted to the adult residential population per the American Community Survey.<br />
<strong>Data</strong> are age-adjusted to the U.S. 2000 Standard Population<br />
2007 2009 2010 2011 2012 2013<br />
Prevalence<br />
95%<br />
Confidence<br />
Intervals Prevalence<br />
95%<br />
Confidence<br />
Intervals Prevalence<br />
95%<br />
Confidence<br />
Intervals Prevalence<br />
95%<br />
Confidence<br />
Intervals Prevalence<br />
95%<br />
Confidence<br />
Intervals Prevalence<br />
95%<br />
Confidence<br />
Intervals<br />
2014<br />
95%<br />
Confidence<br />
Prevalence Intervals<br />
p-value‡<br />
Household Poverty¤<br />
Low poverty<br />
Once a month or more 13.1 11.4-15.1 13.8 12.0-15.8 16.6 14.4-19.1 16.3 13.8-19.3 16.6 14.4-19.1 17.7 15.8-19.7 20.5 U 18.4-22.9 0.000<br />
Less than once a month 11.5 D 9.8-13.3 10.1 8.4-12.1 9.3 7.7-11.3 11.4 9.1-14.3 10.4 8.6-12.5 12.1 10.5-13.9 11.0 9.3-13.0 0.601<br />
None/Unable 75.4 73.1-77.7 76.1 73.6-78.4 74.1 71.3-76.7 72.2 68.8-75.5 73.0 70.1-75.7 70.3 67.9-72.6 68.5 D 65.9-70.9 0.000<br />
Medium poverty<br />
Once a month or more 9.1 7.3-11.2 11.0 8.6-13.9 8.7 6.7-11.2 14.7 11.1-19.2 15.3 12.2-19.0 15.0 12.8-17.5 14.8 12.1-17.8 0.000<br />
Less than once a month 10.8 8.7-13.2 9.3 7.3-11.8 5.4 4.0-7.4 9.5 D 6.6-13.4 8.8 6.7-11.4 7.7 6.1-9.8 8.9 7.2-11.0 0.308<br />
None/Unable 80.2 77.3-82.8 79.8 76.4-82.8 85.9 82.9-88.4 75.8 70.9-80.1 75.9 72.0-79.4 77.3 74.4-79.9 76.3 73.1-79.3 0.003<br />
High poverty<br />
Once a month or more 10.8 8.7-13.4 10.5 U 8.2-13.4 8.9 6.9-11.3 14.3 11.1-18.3 9.5 U 7.4-12.2 13.2 11.3-15.5 12.8 10.8-15.1 0.058<br />
Less than once a month 8.3 6.6-10.4 7.4 5.4-10.1 7.6 5.5-10.3 9.6 7.0-13.1 6.4 4.7-8.5 4.9 3.7-6.3 8.1 6.4-10.1 0.266<br />
None/Unable 80.9 77.9-83.6 82.0 78.7-85.0 83.5 U 80.3-86.3 76.1 71.5-80.1 84.1 81.0-86.8 81.9 79.4-84.2 79.2 76.5-81.6 0.397<br />
Very high poverty<br />
Once a month or more 12.9 10.9-15.3 11.3 8.9-14.2 12.1 9.5-15.4 11.1 8.8-14.0 13.5 D 11.1-16.2 12.8 11.0-14.8 14.2 12.3-16.3 0.192<br />
Less than once a month 8.4 6.6-10.7 4.4 3.0-6.3 5.4 3.8-7.5 7.6 5.7-10.0 6.7 5.1-8.6 5.2 4.1-6.6 4.9 3.8-6.3 0.038<br />
None/Unable 78.7 75.9-81.3 84.4 81.2-87.1 82.5 79.0-85.5 81.3 78.0-84.3 79.9 77.0-82.5 82.1 79.8-84.1 80.9 78.6-83.0 0.893<br />
Neighborhood Poverty§<br />
Low Poverty<br />
Once a month or more 13.6 11.4-16.0 12.9 10.8-15.3 13.1 10.9-15.6 16.3 13.2-19.9 14.0 11.5-17.0 14.9 12.7-17.3 20.3 17.2-23.7 0.000<br />
Less than once a month 10.8 8.9-13.0 10.6 8.6-13.1 8.2 6.4-10.4 8.5 U 6.4-11.2 10.2 8.2-12.7 11.4 9.3-13.9 10.8 8.6-13.5 0.688<br />
None/Unable 75.7 72.8-78.3 76.5 D 73.5-79.2 78.7 75.7-81.5 75.2 71.2-78.8 75.8 72.4-78.9 73.7 70.7-76.6 68.9 65.3-72.3 0.001<br />
Medium poverty<br />
Once a month or more 11.8 10.3-13.4 13.7 11.9-15.8 12.2 10.3-14.3 14.7 12.6-17.2 13.6 11.7-15.8 15.6 13.8-17.6 15.9 13.9-18.2 0.000<br />
Less than once a month 11.1 9.6-12.8 7.4 6.2-8.8 7.4 5.9-9.2 9.9 8.1-12.2 7.4 6.0-9.0 9.0 7.5-10.6 8.6 7.0-10.4 0.123<br />
None/Unable 77.1 75.1-79.1 78.9 76.6-81.0 80.4 78.0-82.7 75.3 72.5-78.0 79.0 76.5-81.2 75.4 73.1-77.6 75.5 U 73.0-77.8 0.049<br />
High poverty<br />
Once a month or more 11.7 9.9-13.6 11.5 D 9.4-13.9 11.9 9.6-14.6 13.8 11.1-17.1 15.8 13.2-18.8 15.8 13.8-18.0 15.1 13.3-17.1 0.000<br />
Less than once a month 8.4 7.0-10.0 8.1 6.5-10.1 5.8 4.4-7.6 9.6 7.3-12.4 8.0 6.3-10.1 5.4 4.2-6.7 8.5 D 7.0-10.2 0.518<br />
None/Unable 80.0 77.7-82.1 80.4 77.6-83.0 82.3 79.4-84.9 76.6 72.8-80.0 76.2 73.0-79.1 78.9 76.5-81.0 76.4 74.1-78.6 0.002<br />
Very high poverty<br />
Once a month or more 10.3 8.5-12.2 9.4 7.5-11.7 10.0 8.0-12.5 10.6 8.1-13.8 10.0 8.1-12.3 12.0 10.1-14.2 13.5 D 11.4-15.8 0.009<br />
Less than once a month 9.4 7.7-11.4 6.0 4.4-8.2 7.4 5.5-9.9 9.2 6.7-12.4 8.0 6.3-10.1 6.1 4.9-7.6 6.6 5.2-8.3 0.071<br />
None/Unable 80.4 77.9-82.6 84.6 81.8-87.1 82.6 79.5-85.3 80.3 76.4-83.6 82.0 79.3-84.4 81.9 79.4-84.1 80.0 77.4-82.4 0.344<br />
Neighborhood Health Action Center areas◊<br />
South Bronx<br />
Once a month or more 13.8 10.9-17.4 7.8 5.2-11.6 8.4 5.8-12.0 8.3 5.2-12.8 7.3 4.9-10.6 10.5 D 7.8-14.0 12.0 8.8-16.1 0.661<br />
Less than once a month 8.2 5.8-11.4 5.1 3.3-7.8 5.7 3.3-9.6 6.1 3.8-9.6 8.4 5.8-12.0 5.9 4.1-8.6 5.3 3.2-8.6 0.770<br />
None/Unable 78.0 73.9-81.6 87.1 82.9-90.4 85.9 81.3-89.6 85.7 80.7-89.6 84.3 80.2-87.7 83.6 79.7-86.8 82.7 78.2-86.5 0.565<br />
East and Central Harlem<br />
Once a month or more 8.2 5.5-12.1 11.9 6.8-20.2 6.2 * 2.9-12.8 15.6 8.7-26.4 10.6 5.8-18.6 16.0 11.9-21.2 19.9 14.4-26.9 0.002<br />
Less than once a month 9.1 6.0-13.5 7.4 * 3.5-15.0 6.7 * 3.3-13.3 10.4 * 4.9-20.5 4.9 2.8-8.5 8.0 5.3-11.9 9.1 * 5.0-16.0 0.841<br />
None/Unable 82.8 77.7-86.9 80.7 71.8-87.2 87.1 79.5-92.1 74.0 * 62.7-82.9 84.5 U 76.7-90.0 76.0 70.4-80.8 71.0 63.8-77.3 0.009<br />
North and Central Brooklyn<br />
Once a month or more 12.1 9.6-15.1 10.6 7.7-14.4 10.1 7.4-13.7 11.1 7.6-15.9 16.0 12.4-20.4 16.6 13.2-20.7 15.5 U 12.4-19.2 0.002<br />
Less than once a month 11.8 9.6-14.5 9.0 6.1-13.1 8.5 D 5.7-12.4 11.2 7.2-16.8 7.9 5.4-11.4 6.4 4.5-8.9 10.6 8.1-13.8 0.128<br />
None/Unable 76.1 72.6-79.2 80.4 75.6-84.4 81.4 76.9-85.2 77.8 71.8-82.8 76.1 71.4-80.2 77.0 72.7-80.8 73.9 69.8-77.7 0.128<br />
All Other Neighborhoods<br />
Once a month or more 11.9 10.9-13.0 13.0 11.8-14.2 12.8 11.5-14.2 15.0 13.4-16.6 13.9 12.6-15.4 15.0 13.9-16.3 16.4 15.1-17.8 0.000<br />
Less than once a month 10.0 9.1-11.1 8.2 7.3-9.3 7.3 6.3-8.4 9.5 U 8.3-11.0 8.4 7.4-9.5 8.3 7.4-9.3 8.5 D 7.6-9.5 0.110<br />
None/Unable 78.1 76.7-79.3 78.8 77.3-80.2 79.9 78.3-81.4 75.5 U 73.6-77.4 77.6 76.0-79.2 76.7 75.2-78.0 75.1 73.6-76.5 0.000<br />
Confidence Intervals (CIs) are a measure of estimate precision: the wider the CI, the more imprecise the estimate.<br />
D When rounding to the nearest whole number, round down.<br />
U When rounding to the nearest whole number, round up.<br />
‡ p-value was calculated by contructing logistic regression model with the outcome of biking frequecy (dichotomized to yes for for each category), including year as a depedent variable and testing that thre regression coefficient be greater than 0<br />
* Estimates should be interpreted with caution, potentially unreliable<br />
^ <strong>Data</strong> are supressed due to imprecise unreliable estimates<br />
**Race/ethnicity: White, Black, Asian/Pacific Island, and Other race categories exclude Hispanic/Latino ethnicity. "Latino" ethnicity is defined as Hispanic or Latino of any race.<br />
¤Household poverty is measured as the total income of the household and is categorized into four groups, relative to the Federal Poverty Line (FPL), as follows: Very high poverty (
<strong>Epi</strong> <strong>Data</strong> Tables, No. 78 New York City Department of Health and Mental Hygiene Pages 5-6<br />
Table 2. Prevalence of self-reported cycling activity in New Yorkers 18 years and older, by neighborhood, New York City, 2007-2014<br />
Source: NYC Community Health Survey, 2007, 2009, 2011, 2013 and 2014.<br />
CHS data are weighted to the adult residential population per the American Community Survey.<br />
<strong>Data</strong> are age-adjusted to the U.S. 2000 Standard Population<br />
2007 2009 2010 2011 2012 2013<br />
2014<br />
Prevalence<br />
95%<br />
Confidence<br />
Intervals Prevalence<br />
95%<br />
Confidence<br />
Intervals Prevalence<br />
95%<br />
Confidence<br />
Intervals Prevalence<br />
95%<br />
Confidence<br />
Intervals Prevalence<br />
95%<br />
Confidence<br />
Intervals Prevalence<br />
95%<br />
Confidence<br />
Intervals Prevalence<br />
95%<br />
Confidence<br />
Intervals p-value‡<br />
The Bronx<br />
101 Kingsbridge<br />
Once a month or more 15.5 U 8.4-26.9 10.7 * 4.8-21.9 6.8 * 3.4-13.2 11.2 * 5.0-23.3 5.0 ^ 1.8-13.4 19.2 * 10.4-32.6 10.9 * 4.7-23.2 0.895<br />
Less than once a month 9.8 * 4.9-18.5 6.0 * 3.0-11.6 7.8 * 3.3-17.5 8.4 * 4.0-17.0 5.6 ^ 2.0-14.4 7.3 * 3.4-14.9 5.1 ^ 1.8-14.0 0.366<br />
None/Unable 74.7 64.3-82.9 83.4 72.3-90.6 85.4 75.9-91.6 80.4 * 68.2-88.7 89.5 D 79.7-94.8 73.5 *,U 60.1-83.6 83.9 * 70.9-91.8 0.677<br />
102 NE Bronx<br />
Once a month or more 13.8 8.9-20.8 9.8 5.5-17.0 10.9 6.4-17.8 12.1 * 6.1-22.4 7.2 * 3.3-14.9 8.7 * 4.7-15.4 7.8 * 3.6-16.1 0.193<br />
Less than once a month 6.6 3.8-11.3 8.6 4.9-14.8 3.4 * 1.4-8.3 7.2 * 3.5-14.2 5.0 * 2.2-10.8 6.0 * 3.2-11.1 5.7 * 2.5-12.5 0.434<br />
None/Unable 79.6 72.3-85.4 81.5 U 73.7-87.5 85.7 78.3-90.9 80.7 69.7-88.4 87.8 79.6-93.0 85.2 77.8-90.5 86.5 U 77.4-92.3 0.112<br />
103 Fordham-Bronx Pk<br />
Once a month or more 7.7 * 3.9-14.3 7.2 * 3.9-12.8 9.5 *,U 5.2-16.9 14.9 * 8.0-25.9 11.7 * 6.0-21.8 11.3 7.2-17.5 13.6 9.1-19.9 0.047<br />
Less than once a month 6.7 * 3.1-13.8 4.1 * 1.7-9.5 6.2 3.6-10.6 9.2 * 4.3-18.3 10.0 * 5.4-17.6 5.9 * 3.0-11.2 4.9 * 2.6-8.8 0.900<br />
None/Unable 85.6 77.4-91.2 88.7 82.4-93.0 84.2 77.2-89.4 76.0 64.8-84.5 78.3 68.2-85.9 82.8 76.3-87.7 81.5 U 74.9-86.7 0.084<br />
104 Pelham-Throgs Neck<br />
Once a month or more 11.4 6.9-18.1 14.7 9.5-21.9 13.7 8.9-20.5 20.8 * 12.5-32.5 14.4 8.6-23.0 11.5 D 7.7-16.8 12.2 8.4-17.5 0.920<br />
Less than once a month 11.8 6.8-19.7 10.8 6.5-17.6 8.7 * 4.2-17.3 8.9 * 4.2-18.1 6.0 * 2.9-11.8 4.8 * 2.6-8.7 6.6 4.1-10.5 0.018<br />
None/Unable 76.9 68.3-83.6 74.5 D 66.2-81.3 77.6 69.1-84.3 70.3 60.1-78.8 79.7 70.8-86.4 83.7 78.0-88.2 81.1 75.2-85.9 0.089<br />
105/106/107 South Bronx<br />
Once a month or more 13.8 10.9-17.4 7.8 5.2-11.6 8.4 5.8-12.0 8.3 5.2-12.8 7.3 4.9-10.6 10.5 D 7.8-14.0 12.0 8.8-16.1 0.661<br />
Less than once a month 8.2 5.8-11.4 5.0 3.3-7.8 5.7 3.3-9.6 6.1 3.8-9.6 8.4 5.8-12.0 5.9 4.1-8.6 5.3 3.2-8.6 0.770<br />
None/Unable 78.0 73.9-81.6 87.1 82.9-90.4 85.9 81.3-89.6 85.7 80.7-89.6 84.3 80.2-87.7 83.6 79.7-86.8 82.7 78.2-86.5 0.565<br />
Brooklyn<br />
201 Greenpoint<br />
Once a month or more 8.9 * 4.6-16.4 16.8 10.5-25.9 16.0 8.8-27.4 13.2 * 6.4-25.3 9.6 5.5-16.1 15.8 9.9-24.2 16.9 10.0-27.1 0.170<br />
Less than once a month 9.9 * 4.5-20.4 3.8 * 1.5-9.1 4.6 * 1.8-11.3 15.7 * 8.1-28.3 8.4 * 4.0-16.8 6.8 * 2.8-15.3 14.9 8.4-25.2 0.302<br />
None/Unable 81.2 71.0-88.4 79.4 69.9-86.4 79.4 68.5-87.2 71.1 * 59.4-80.5 82.0 73.0-88.5 77.5 D 69.3-84.0 68.2 57.9-76.9 0.049<br />
202 Downtown-Heights-Slope<br />
Once a month or more 19.5 U 14.9-25.3 20.0 14.3-27.2 18.5 U 12.3-27.0 32.0 23.6-41.7 20.0 14.5-26.9 21.2 15.1-29.0 23.4 17.2-31.0 0.378<br />
Less than once a month 10.2 6.8-15.1 10.0 6.5-15.0 5.0 * 2.1-11.6 8.0 * 4.0-15.4 9.9 6.0-15.8 10.9 6.6-17.5 17.7 11.9-25.4 0.293<br />
None/Unable 70.2 63.9-75.9 70.1 62.7-76.6 76.4 67.6-83.4 60.0 50.0-69.3 70.1 62.5-76.8 67.9 59.6-75.2 58.9 50.2-67.1 0.128<br />
203 Bed Stuy-Crown Heights<br />
Once a month or more 8.0 5.7-11.1 12.1 7.6-18.9 7.6 4.4-12.7 11.8 6.5-20.5 19.9 13.7-28.0 17.0 12.1-23.3 17.1 12.5-23.0 0.000<br />
Less than once a month 15.2 12.0-19.2 11.0 6.3-18.4 8.9 4.9-15.6 11.5 *,D 6.2-20.2 9.5 U 5.4-16.2 6.4 3.7-10.7 14.0 10.0-19.4 0.173<br />
None/Unable 76.8 72.7-80.4 76.9 68.6-83.5 83.6 76.3-88.9 76.7 67.4-84.0 70.6 63.0-77.1 76.7 69.9-82.3 68.9 62.4-74.7 0.041<br />
204 East New York<br />
Once a month or more 13.6 8.6-21.0 7.1 * 3.8-12.9 14.5 D 8.5-23.5 11.7 6.7-19.6 12.7 7.9-19.9 14.4 8.4-23.6 13.3 8.7-20.0 0.437<br />
Less than once a month 5.7 * 3.0-10.7 5.4 * 2.0-13.7 8.4 * 4.1-16.4 12.3 7.4-19.8 8.9 * 4.6-16.6 7.6 4.3-13.1 8.2 * 4.3-15.0 0.452<br />
None/Unable 80.7 73.0-86.5 87.5 D 79.3-92.7 77.1 67.8-84.3 76.0 66.8-83.3 78.4 70.3-84.7 78.0 68.9-85.0 78.5 U 70.8-84.6 0.248<br />
205 Sunset Park<br />
Once a month or more 8.1 * 4.2-15.1 10.9 * 4.7-23.1 11.4 * 5.4-22.4 21.3 * 10.3-38.8 15.2 9.1-24.3 16.3 10.2-24.9 10.6 6.1-17.7 0.129<br />
Less than once a month 10.2 * 5.4-18.4 6.7 * 3.0-14.4 9.3 * 4.5-18.3 7.5 *,U 2.8-18.6 6.1 * 2.7-13.3 5.2 * 2.2-11.8 5.1 * 2.3-10.8 0.074<br />
None/Unable 81.7 72.9-88.1 82.4 70.6-90.2 79.3 67.5-87.5 71.2 * 54.0-83.8 78.7 69.4-85.8 78.6 69.9-85.3 84.3 76.6-89.8 0.946<br />
206 Borough Park<br />
Once a month or more 13.5 U 9.6-18.8 14.3 9.1-21.7 16.0 10.1-24.5 10.9 * 5.3-21.2 11.4 7.0-18.0 11.1 7.6-16.0 13.3 8.8-19.8 0.458<br />
Less than once a month 9.3 5.9-14.2 5.2 * 2.7-9.8 8.2 * 4.2-15.5 14.6 8.5-23.8 7.5 D 4.5-12.2 5.0 2.9-8.4 6.9 * 3.4-13.6 0.423<br />
None/Unable 77.2 71.1-82.3 80.5 U 72.8-86.4 75.8 67.0-82.8 74.5 U 63.9-82.8 81.2 73.9-86.8 83.9 78.7-88.1 79.8 72.1-85.7 0.248<br />
207 Flatbush<br />
Once a month or more 8.2 5.5-12.0 8.4 4.8-14.4 6.3 * 3.4-11.6 20.9 13.7-30.7 16.6 10.3-25.6 12.9 8.0-20.1 15.4 10.9-21.2 0.000<br />
Less than once a month 8.2 5.5-12.1 7.4 * 3.9-13.5 7.5 *,D 3.6-14.7 5.9 * 2.8-12.1 7.7 * 4.0-14.4 10.7 6.3-17.5 6.5 U 3.7-11.1 0.860<br />
None/Unable 83.6 78.9-87.5 84.2 77.0-89.5 86.2 78.7-91.4 73.1 63.6-80.9 75.7 66.9-82.7 76.4 68.8-82.7 78.1 71.9-83.2 0.003<br />
208 Canarsie<br />
Once a month or more 11.5 D 6.7-19.1 8.7 5.5-13.4 10.4 6.2-16.9 16.8 9.9-26.8 15.4 8.9-25.2 9.7 5.6-16.1 11.9 7.0-19.6 0.514<br />
Less than once a month 7.6 4.3-13.0 8.8 * 4.8-15.6 5.1 * 1.9-12.8 9.5 *,U 3.9-21.4 5.5 *,D 2.4-12.2 10.3 * 4.9-20.2 2.8 * 1.3-6.0 0.508<br />
None/Unable 81.0 73.3-86.8 82.5 U 75.5-87.9 84.6 76.4-90.3 73.7 * 62.4-82.5 79.1 68.8-86.7 80.1 70.8-86.9 85.3 77.5-90.7 0.882<br />
209 Bensonhurst<br />
Once a month or more 12.7 8.0-19.5 11.9 7.4-18.4 12.5 U 8.0-19.1 17.7 10.1-29.3 14.4 8.7-22.7 14.1 8.3-22.9 24.1 16.5-33.9 0.090<br />
Less than once a month 5.0 * 2.4-10.1 7.4 4.4-12.2 9.0 * 4.6-16.9 6.6 * 2.7-15.0 6.4 * 2.7-14.6 6.6 * 2.8-14.8 3.5 *,U 1.3-8.9 0.334<br />
None/Unable 82.3 74.9-87.8 80.8 74.0-86.1 78.5 U 70.1-85.0 75.7 * 63.9-84.6 79.2 71.7-85.2 79.3 69.6-86.5 72.3 62.9-80.1 0.280<br />
210 Coney Island<br />
Once a month or more 14.1 9.5-20.6 16.0 9.9-24.9 7.7 4.3-13.5 12.0 6.9-19.9 15.1 8.7-25.0 15.4 10.4-22.1 8.3 5.4-12.7 0.444<br />
Less than once a month 11.9 7.7-17.9 7.8 4.4-13.5 11.1 * 6.1-19.6 16.4 9.5-26.9 11.5 *,D 5.9-21.1 5.8 * 3.1-10.6 11.4 6.2-20.0 0.640<br />
None/Unable 74.0 66.9-80.0 76.2 67.3-83.3 81.1 72.4-87.6 71.6 61.1-80.2 73.5 D 63.2-81.7 78.8 71.5-84.7 80.3 72.4-86.3 0.331<br />
211 Williamsburg-Bushwk<br />
Once a month or more 17.8 12.4-24.9 11.1 6.4-18.5 10.7 6.4-17.2 8.8 * 4.5-16.3 16.1 10.8-23.4 17.8 12.1-25.2 15.0 9.9-22.2 0.713<br />
Less than once a month 12.0 7.7-18.3 9.2 5.3-15.6 8.1 * 3.9-16.3 7.1 ^ 1.9-23.1 5.3 * 2.3-12.0 5.0 * 2.5-9.5 7.4 * 3.9-13.5 0.121<br />
None/Unable 70.2 62.6-76.8 79.7 71.6-86.0 81.2 72.8-87.5 84.2 72.4-91.5 78.6 70.9-84.6 77.3 69.8-83.3 77.6 70.1-83.6 0.478<br />
◊The United Hospital Fund (UHF) classifies NYC into 42 neighborhoods comprised of contiguous ZIP codes, several of which have been combined to create the 34 neighborhoods presented here.<br />
Confidence Intervals (CIs) are a measure of estimate precision: the wider the CI, the more imprecise the estimate.<br />
D When rounding to the nearest whole number, round down.<br />
U When rounding to the nearest whole number, round up.<br />
‡p-value refers to the significance of the test for trend<br />
* Estimates should be interpreted with caution, potentially unreliable
<strong>Epi</strong> <strong>Data</strong> Tables, No. 78 New York City Department of Health and Mental Hygiene Pages 5-6<br />
Table 2. Prevalence of self-reported cycling activity in New Yorkers 18 years and older, by neighborhood, New York City, 2007-2014<br />
Source: NYC Community Health Survey, 2007, 2009, 2011, 2013 and 2014.<br />
CHS data are weighted to the adult residential population per the American Community Survey.<br />
<strong>Data</strong> are age-adjusted to the U.S. 2000 Standard Population<br />
2007 2009 2010 2011 2012 2013<br />
Prevalence<br />
95%<br />
Confidence<br />
Intervals Prevalence<br />
95%<br />
Confidence<br />
Intervals Prevalence<br />
95%<br />
Confidence<br />
Intervals Prevalence<br />
95%<br />
Confidence<br />
Intervals Prevalence<br />
95%<br />
Confidence<br />
Intervals Prevalence<br />
95%<br />
Confidence<br />
Intervals<br />
2014<br />
95%<br />
Confidence<br />
Prevalence Intervals<br />
p-value‡<br />
Manhattan<br />
301 Washington Heights<br />
Once a month or more 8.3 4.6-14.4 9.9 * 5.2-17.9 8.7 4.9-14.9 13.0 * 6.6-24.1 13.9 8.3-22.3 11.6 7.4-17.8 18.8 13.4-25.7 0.019<br />
Less than once a month 8.6 5.3-13.6 5.5 *,D 2.5-11.7 4.1 * 2.1-7.9 10.6 * 4.4-23.2 11.1 * 5.9-20.0 2.6 * 1.3-5.3 7.8 4.7-12.5 0.779<br />
None/Unable 83.1 76.4-88.2 84.7 76.1-90.5 87.3 80.8-91.8 76.4 * 64.7-85.1 74.9 65.9-82.2 85.8 79.5-90.4 73.5 D 66.3-79.5 0.054<br />
302 Central Harlem<br />
Once a month or more 9.5 U 5.8-15.3 13.1 * 6.5-24.7 8.8 * 3.7-19.5 14.9 * 7.3-27.9 15.0 * 7.7-27.1 14.3 9.5-21.0 19.4 12.4-29.2 0.055<br />
Less than once a month 9.5 U 5.9-15.1 5.0 * 2.4-10.3 9.9 * 4.6-20.2 16.7 * 7.9-31.9 5.4 * 2.9-9.9 9.6 5.8-15.3 11.4 * 5.4-22.4 0.665<br />
None/Unable 81.0 74.4-86.1 81.8 71.1-89.2 81.3 70.1-88.9 68.4 * 55.5-78.9 79.5 U 68.2-87.5 76.1 68.6-82.2 69.2 58.8-78.0 0.047<br />
303 East Harlem<br />
Once a month or more 6.2 * 3.2-11.8 10.3 ^ 3.7-25.5 2.4 * 1.0-5.7 16.9 * 6.8-36.2 3.6 * 1.8-7.0 18.6 12.0-27.6 20.8 14.1-29.7 0.007<br />
Less than once a month 8.3 * 3.9-17.0 11.7 * 4.2-28.6 2.0 * 0.8-4.9 1.2 * 0.6-2.7 4.7 ^ 1.5-14.2 5.8 * 2.8-11.7 5.5 *,U 2.4-12.1 0.269<br />
None/Unable 85.4 76.6-91.3 78.0 * 63.1-88.0 95.6 91.5-97.8 81.9 * 63.1-92.3 91.7 83.6-96.0 75.6 66.6-82.9 73.6 65.3-80.5 0.108<br />
304 Upper West Side<br />
Once a month or more 19.8 13.3-28.4 22.5 *,D 13.9-34.4 15.2 9.8-22.8 25.2 * 15.6-38.2 17.7 11.5-26.3 21.8 16.1-28.8 24.1 17.1-33.0 0.168<br />
Less than once a month 15.9 10.2-24.0 9.1 5.1-15.6 6.2 3.4-10.9 10.7 * 4.9-21.8 7.7 * 4.1-13.8 14.2 9.7-20.5 10.7 6.6-16.8 0.521<br />
None/Unable 64.4 55.3-72.5 68.4 * 57.0-78.0 78.7 70.6-85.0 64.1 * 52.3-74.4 74.6 65.8-81.8 64.0 56.4-70.9 65.2 56.3-73.1 0.416<br />
305/307 Upper East Side-Gramercy<br />
Once a month or more 8.6 4.9-14.6 10.8 7.2-15.9 16.0 10.5-23.5 10.5 U 6.1-17.7 9.6 6.2-14.6 16.1 11.8-21.6 22.9 16.5-30.9 0.000<br />
Less than once a month 7.7 4.9-11.9 10.8 6.7-17.1 8.1 5.0-12.9 14.2 8.1-23.7 11.5 U 6.9-18.6 12.0 7.9-17.8 9.9 5.8-16.2 0.367<br />
None/Unable 83.7 77.2-88.7 78.4 71.5-83.9 75.9 68.4-82.0 75.3 66.1-82.6 78.9 71.4-84.8 71.9 65.3-77.7 67.2 59.3-74.3 0.000<br />
306/308 Chelsea-Village<br />
Once a month or more 15.4 10.9-21.2 19.5 U 13.5-27.4 19.7 13.1-28.6 16.8 10.3-26.2 14.5 D 10.5-19.6 17.6 12.9-23.4 24.9 18.3-33.0 0.312<br />
Less than once a month 12.0 * 6.1-22.4 4.7 2.7-8.2 12.9 7.1-22.4 13.9 7.7-24.0 11.4 6.4-19.4 13.2 8.4-20.1 15.0 10.0-21.8 0.090<br />
None/Unable 72.6 62.6-80.8 75.7 67.8-82.2 67.4 57.6-75.8 69.2 58.5-78.2 74.2 65.9-81.0 69.3 62.1-75.6 60.1 51.9-67.8 0.036<br />
309/310 Union Square-Lower Manhattan<br />
Once a month or more 14.6 10.0-20.8 16.8 11.8-23.3 16.7 10.6-25.3 11.5 U 6.3-20.2 20.5 D 13.5-29.9 21.8 15.8-29.3 25.5 U 19.4-32.8 0.029<br />
Less than once a month 13.0 7.5-21.6 8.1 * 4.3-14.8 9.4 * 4.5-18.5 5.5 ^,D 1.9-14.7 11.8 7.0-19.2 6.2 * 3.3-11.5 14.5 D 9.6-21.3 0.499<br />
None/Unable 72.4 63.2-80.0 75.1 67.4-81.5 73.9 64.1-81.8 83.0 72.7-89.9 67.7 58.1-76.0 71.9 64.1-78.7 60.0 52.8-66.8 0.017<br />
Queens<br />
401 LIC, Astoria<br />
Once a month or more 12.0 7.7-18.3 13.7 8.5-21.4 15.6 9.7-24.0 13.0 7.6-21.5 7.1 * 3.9-12.7 22.5 D 14.9-32.4 18.5 U 12.0-27.4 0.135<br />
Less than once a month 3.5 *,U 1.9-6.6 10.1 5.8-17.0 5.8 * 2.8-11.8 6.7 * 3.3-13.2 2.3 * 0.9-5.7 8.1 * 4.2-15.2 7.4 * 3.7-14.4 0.559<br />
None/Unable 84.4 78.1-89.2 76.2 67.6-83.0 78.6 69.7-85.4 80.3 71.3-86.9 90.6 84.6-94.4 69.4 59.1-78.1 74.0 65.0-81.4 0.090<br />
402 West Queens<br />
Once a month or more 11.3 7.7-16.2 18.0 12.9-24.5 13.2 8.7-19.5 9.5 D 5.5-15.7 17.0 12.0-23.4 18.8 14.0-24.8 17.2 12.2-23.7 0.053<br />
Less than once a month 9.7 6.2-14.9 7.6 4.3-13.1 2.0 * 0.8-4.9 9.9 5.9-16.1 5.2 * 2.7-9.7 5.4 3.2-8.9 7.2 4.6-11.2 0.333<br />
None/Unable 79.0 73.0-84.0 74.4 68.3-79.6 84.9 78.5-89.6 80.7 73.5-86.2 77.9 71.1-83.5 75.8 69.5-81.2 75.5 U 69.1-81.0 0.266<br />
403 Flushing<br />
Once a month or more 13.6 8.5-21.3 10.9 6.6-17.5 8.6 4.9-14.5 12.4 7.2-20.5 7.0 4.1-11.9 11.6 7.5-17.5 6.8 3.9-11.5 0.122<br />
Less than once a month 13.3 7.9-21.6 6.5 *,U 3.5-11.9 8.8 * 3.7-19.5 10.3 * 4.4-22.4 8.2 4.7-13.9 12.3 7.9-18.7 6.7 3.9-11.2 0.528<br />
None/Unable 73.0 64.7-80.0 82.6 75.1-88.2 82.6 72.8-89.3 77.3 66.3-85.4 84.7 78.0-89.6 76.1 68.8-82.1 86.5 U 80.8-90.7 0.097<br />
404/406 Bayside Little Neck-Fresh Meadows<br />
Once a month or more 9.6 5.5-16.2 14.8 9.9-21.7 9.0 5.0-15.7 13.5 U 7.6-22.9 11.2 6.6-18.3 9.1 5.6-14.4 12.2 6.7-21.2 0.940<br />
Less than once a month 7.9 * 4.3-14.2 8.9 * 4.5-16.6 11.2 6.3-19.2 5.6 * 2.9-10.6 12.6 * 6.5-23.0 6.1 * 2.8-12.6 4.9 * 2.7-8.8 0.318<br />
None/Unable 82.5 D 74.8-88.2 76.3 68.4-82.7 79.8 70.8-86.5 80.8 71.5-87.6 76.2 66.2-83.9 84.8 77.5-90.1 82.9 73.9-89.2 0.488<br />
405 Ridgewood<br />
Once a month or more 12.9 8.0-19.9 8.1 4.8-13.3 9.9 6.0-15.9 13.9 8.0-23.0 6.6 * 3.5-12.2 13.3 8.4-20.4 16.9 10.5-26.1 0.383<br />
Less than once a month 12.3 7.6-19.2 14.8 8.7-24.1 13.1 7.5-21.8 11.5 D 6.8-18.8 9.4 5.5-15.8 10.2 6.0-16.9 6.5 *,D 3.5-11.7 0.069<br />
None/Unable 74.9 67.5-81.0 77.1 67.7-84.4 77.1 68.6-83.7 74.6 65.3-82.2 84.0 76.6-89.3 76.5 D 68.5-82.9 76.6 67.7-83.6 0.614<br />
407 SouthWest Queens<br />
Once a month or more 9.7 6.0-15.1 9.2 5.7-14.6 11.4 7.1-17.8 14.9 9.6-22.5 12.4 * 6.4-22.6 8.5 U 4.9-14.3 18.5 U 12.1-27.3 0.092<br />
Less than once a month 9.8 6.4-14.8 8.8 4.9-15.3 7.3 * 4.0-12.9 4.8 * 2.2-10.1 9.7 5.7-16.2 11.6 7.0-18.5 8.9 * 4.6-16.5 0.860<br />
None/Unable 80.5 D 74.2-85.5 81.9 74.9-87.3 81.3 73.8-87.0 80.2 72.1-86.4 77.8 68.2-85.2 79.9 72.0-85.9 72.6 63.2-80.3 0.128<br />
408 Jamaica<br />
Once a month or more 11.2 7.5-16.4 8.9 5.0-15.1 13.7 * 7.2-24.3 14.3 8.4-23.3 17.9 11.3-27.1 12.5 U 7.9-19.4 11.6 7.5-17.5 0.362<br />
Less than once a month 9.2 6.1-13.6 5.7 * 2.7-11.6 3.5 *,U 1.6-7.7 8.4 * 4.3-15.5 6.8 * 3.7-12.3 7.4 4.1-12.7 6.7 3.8-11.3 0.784<br />
None/Unable 79.6 73.6-84.5 85.5 D 77.9-90.7 82.8 72.3-89.9 77.3 67.9-84.6 75.3 66.3-82.5 80.1 73.3-85.5 81.8 75.1-87.0 0.541<br />
409 SouthEast Queens<br />
Once a month or more 11.4 7.4-17.1 8.4 4.9-13.9 12.4 7.4-20.2 17.3 9.7-28.8 12.8 * 6.7-23.1 9.2 * 3.8-20.5 12.3 6.8-21.2 0.901<br />
Less than once a month 11.5 D 7.5-17.1 12.5 D 7.2-20.7 5.2 * 2.6-10.2 8.6 * 3.8-18.3 8.8 * 4.3-17.1 11.4 * 6.1-20.3 12.4 * 6.5-22.4 0.973<br />
None/Unable 77.1 70.5-82.7 79.1 70.5-85.7 82.3 74.1-88.4 74.1 * 62.5-83.1 78.4 68.5-85.8 79.5 D 68.7-87.2 75.3 65.3-83.1 0.947<br />
410 Rockaway<br />
Once a month or more 17.4 10.3-28.0 8.6 5.2-13.8 19.9 12.8-29.5 25.6 17.1-36.5 24.2 * 14.4-37.7 22.0 * 13.6-33.6 16.0 * 7.9-29.7 0.334<br />
Less than once a month 12.9 7.1-22.3 13.1 7.2-22.8 14.9 * 7.9-26.3 6.1 * 2.9-12.4 7.1 * 3.3-14.8 7.4 * 3.2-15.9 18.1 * 9.0-33.2 0.737<br />
None/Unable 69.7 * 58.0-79.2 78.3 68.8-85.6 65.2 * 54.4-74.7 68.3 * 57.3-77.5 68.7 * 55.3-79.5 70.6 * 58.4-80.5 65.9 * 51.6-77.8 0.608<br />
Staten Island<br />
501/502 Northern SI<br />
Once a month or more 9.1 5.6-14.6 10.6 6.6-16.6 11.5 *,U 6.2-20.3 9.2 5.1-16.1 15.1 9.5-23.3 22.4 15.5-31.3 13.9 9.1-20.7 0.008<br />
Less than once a month 16.3 11.4-22.8 8.6 5.4-13.4 8.4 * 4.4-15.6 7.8 * 4.0-14.6 7.5 *,U 4.0-13.8 8.0 4.7-13.1 6.5 *,U 3.6-11.6 0.007<br />
None/Unable 74.6 67.7-80.4 80.8 74.1-86.1 80.0 70.5-87.1 83.0 74.7-88.9 77.4 68.7-84.2 69.6 61.1-76.9 79.6 72.3-85.4 0.730<br />
503/504 Southern SI<br />
Once a month or more 10.2 6.2-16.4 10.6 6.7-16.2 10.9 6.9-16.6 6.1 3.5-10.3 14.5 U 9.6-21.5 11.9 7.8-17.7 11.8 8.0-17.3 0.365<br />
Less than once a month 13.0 8.5-19.2 8.2 * 4.4-14.9 6.9 4.4-10.8 4.8 * 2.6-8.5 12.1 7.3-19.4 8.7 5.5-13.5 8.1 5.0-13.0 0.321<br />
None/Unable 76.8 70.1-82.3 81.2 74.1-86.7 82.2 76.1-87.0 89.1 84.0-92.8 73.4 65.6-80.0 79.5 D 73.0-84.7 80.0 73.8-85.1 0.961<br />
◊The United Hospital Fund (UHF) classifies NYC into 42 neighborhoods comprised of contiguous ZIP codes, several of which have been combined to create the 34 neighborhoods presented here.<br />
Confidence Intervals (CIs) are a measure of estimate precision: the wider the CI, the more imprecise the estimate.<br />
D When rounding to the nearest whole number, round down.<br />
U When rounding to the nearest whole number, round up.<br />
‡p-value refers to the significance of the test for trend<br />
* Estimates should be interpreted with caution, potentially unreliable
<strong>Epi</strong> <strong>Data</strong> Tables, No. 78 New York City Department of Health and Mental Hygiene Page 7<br />
Table 3. Prevalence of self-reported cycling activity among New York City public high school students, 2009-2013<br />
Source: NYC Youth Risk Behavior Survey, 2009, 2011, 2013<br />
<strong>Data</strong> are weighted to the NYC public high school population<br />
2009 2011 2013<br />
Biking Intensity<br />
Prevalence<br />
95%<br />
Confidence<br />
Intervals Prevalence<br />
95%<br />
Confidence<br />
Intervals Prevalence<br />
95%<br />
Confidence<br />
Intervals p-value‡<br />
Overall<br />
Once a month or more 17.0 15.8-18.2 25.9 23.8-28.2 25.0 23.2-26.9 0.000<br />
Less than once a month 27.5 U 26.0-29.1 23.8 22.5-25.1 23.2 21.4-25.0 0.000<br />
None/Unable 55.5 U 53.6-57.4 50.3 48.3-52.2 51.8 50.0-53.7 0.009<br />
Sex<br />
Male<br />
Once a month or more 24.4 22.6-26.3 38.0 35.3-40.8 35.9 33.4-38.5 0.000<br />
Less than once a month 30.9 28.6-33.2 23.2 21.6-24.9 23.8 21.6-26.1 0.000<br />
None/Unable 44.7 42.3-47.2 38.8 36.7-40.9 40.3 38.5-42.2 0.005<br />
Female<br />
Once a month or more 10.9 9.7-12.3 15.0 13.4-16.8 14.3 12.7-16.1 0.002<br />
Less than once a month 24.7 22.6-27.0 24.3 22.3-26.4 22.5 D 20.6-24.5 0.118<br />
None/Unable 64.4 61.9-66.7 60.7 58.3-63.1 63.2 60.7-65.6 0.483<br />
Age group (years)<br />
<strong>Epi</strong> <strong>Data</strong> Tables, No. 78 New York City Department of Health and Mental Hygiene Page 8<br />
Table 4. Difference or gap in prevalence of cycling once a month or more in selected subgroups of New Yorkers. New York City, 2007-2014<br />
Source: NYC Community Health Survey, 2007, 2009, 2011, 2013 and 2014. ; NYC Youth Risk Behavior Survey, 2009, 2011, 2013<br />
CHS data are weighted to the adult residential population per the American Community Survey.YRBS data are weighted to the NYC public high school population<br />
2007 2009 2010 2011 2012<br />
2013 2014<br />
Adults<br />
Sex<br />
Diff*<br />
95%<br />
Confidence<br />
Intervals<br />
Diff*<br />
95%<br />
Confidence<br />
Intervals<br />
Male - Female 11.2 9.3-13.0 12.1 10.0-14.3 11.5<br />
Diff*<br />
D<br />
95%<br />
Confidence<br />
Intervals<br />
Diff*<br />
95%<br />
Confidence<br />
Intervals<br />
Diff*<br />
95%<br />
Confidence<br />
Intervals<br />
Diff*<br />
95%<br />
Confidence<br />
Intervals<br />
Diff*<br />
95%<br />
Confidence<br />
Intervals<br />
9.2-13.7 12.6 9.7-15.4 11.8 9.4-14.3 14.4 12.3-16.4 13.3 11.0-15.6 0.677<br />
p-valueǂ<br />
Race/Ethnicity**<br />
White - Black 3.7 1.3-6.0 4.7 1.8-7.6 8.1 5.5-10.7 4.0 0.0-8.0 4.6 1.1-8.1 4.8 1.8-7.7 5.9 2.7-9.1 0.409<br />
White - Latino 0.1 -2.4-2.6 2.7 -0.1-5.5 2.6 -0.4-5.7 3.8 0.2-7.5 2.8 -0.5-6.1 2.0 -0.8-4.7 1.3 -1.9-4.5 0.759<br />
Household Poverty¤<br />
Low - Very high 0.2 -2.7-3.1 2.5<br />
U<br />
-0.8-5.8 4.5<br />
D<br />
0.7-8.3 5.2 1.4-8.9 3.2 -0.3-6.6 4.9 2.2-7.6 6.4 3.3-9.4 0.022<br />
Neighborhood Poverty§<br />
Low - Very high 3.3 0.3-6.3 3.6 0.5-6.6 3.1 -0.2-6.3 5.7 1.4-10.1 4.0 0.6-7.5 2.9 -0.2-6.0 6.8 2.9-10.8 0.648<br />
Youth<br />
Sex<br />
Male - Female 13.5<br />
D<br />
11.4-15.6 23.0 20.3-25.8 21.6 18.8-24.3