Lab #02a 4 Diagram Exercise
Lab #02a 4 Diagram Exercise
Lab #02a 4 Diagram Exercise

Create successful ePaper yourself
Turn your PDF publications into a flip-book with our unique Google optimized e-Paper software.
ES --- MED 42<br />
University Bremerhaven --- IAE<br />
<strong>Lab</strong> <strong>#02a</strong><br />
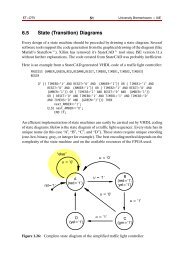
4 <strong>Diagram</strong> <strong>Exercise</strong> (Pre FFT <strong>Lab</strong>)<br />
Before coding the FFT algorithm the following lab exercise demonstrates to use diagrams<br />
for the graphical output of the results.<br />
" Create a new Netbeans project (Java Application) with the name:<br />
JChartTst<br />
" Copy the provided source code to you application and run the program.<br />
package jchart2dtst;<br />
import info.monitorenter.gui.chart.Chart2D;<br />
import info.monitorenter.gui.chart.ITrace2D;<br />
import info.monitorenter.gui.chart.traces.Trace2DSimple;<br />
import java.awt.Color;<br />
import java.awt.event.WindowAdapter;<br />
import java.awt.event.WindowEvent;<br />
import javax.swing.JFrame;<br />
public class JchartTst {<br />
/**<br />
* @param args the command line arguments<br />
*/<br />
public static void main(String[] args) {<br />
int k;<br />
double fx;<br />
// Create a chart:<br />
Chart2D chart = new Chart2D();<br />
// Create an ITrace:<br />
ITrace2D trace = new Trace2DSimple();<br />
// Add the trace to the chart.<br />
chart.addTrace(trace);<br />
trace.setColor(Color.blue);<br />
trace.setName("x[k]");<br />
// always start in origin<br />
trace.addPoint(0.0, 0.0);<br />
// Add all points, as it is static:<br />
for (k = 0; k < N_POINTS; k++) {<br />
trace.addPoint(k, k);
ES --- MED 43<br />
University Bremerhaven --- IAE<br />
}<br />
}<br />
// Make it visible:<br />
// Create a frame.<br />
JFrame frame = new JFrame("Cosine Samples");<br />
// add the chart to the frame:<br />
frame.getContentPane().add(chart);<br />
frame.setSize(400,300);<br />
// Enable the termination button [cross on the upper right edge]:<br />
frame.addWindowListener(<br />
new WindowAdapter() {<br />
@Override<br />
public void windowClosing(WindowEvent e){<br />
System.exit(0);<br />
}<br />
}<br />
);<br />
frame.setVisible(true);<br />
}<br />
static final int N_POINTS = 16;<br />
" This result should look as follows:<br />
Figure 1.45: JChartTst output
ES --- MED 44<br />
University Bremerhaven --- IAE<br />
" Modify the source code to display cosine samples of one period. This result should<br />
be as follows:<br />
Figure 1.46: Modified JChartTst output with cosine samples


![Lab #10b: [NEW!] 6.10 Complete SPI Transmitter/Receiver](https://img.yumpu.com/8484102/1/184x260/lab-10b-new-610-complete-spi-transmitter-receiver.jpg?quality=85)