- Page 1:
Controlled Modification of Metal-Or
- Page 5:
This thesis is based on the work pe
- Page 8 and 9:
Bochum) for the study of XPS and UH
- Page 10 and 11:
Zhang, for their continuous support
- Page 12 and 13:
II 3.2.1 Synthesis and characteriza
- Page 14 and 15:
IV 7.3.4 Synthesis of Cu-DEMOF samp
- Page 16 and 17:
VI DMSO dobdc e.g. EA EDX EtOH EXAF
- Page 18 and 19:
VIII TOF UHV UiO UMCM vs WCA XANES
- Page 20 and 21:
2 Chapter 1 limitations of the (non
- Page 22 and 23:
4 Chapter 2 For the synthesis of CP
- Page 24 and 25:
6 Chapter 2 cavities is able to rev
- Page 26 and 27:
8 Chapter 2 2.2.2 MOF features Adva
- Page 28 and 29:
10 Chapter 2 Figure 2.5. A series o
- Page 30 and 31:
12 Chapter 2 the material is retain
- Page 32 and 33:
14 Chapter 2 2.3 Synthetic approach
- Page 34 and 35:
16 Chapter 2 Expansion of this stru
- Page 36 and 37:
18 Chapter 2 (H2BPDC) [75] or other
- Page 38 and 39:
20 Chapter 2 Cr III CUSs of MIL-101
- Page 40 and 41:
22 Chapter 2 Figure 2.14. Schematic
- Page 42 and 43:
24 Chapter 2 adsorbate-surface inte
- Page 44 and 45:
3 Controlled secondary building uni
- Page 46 and 47:
28 Chapter 3 3.1 Preparation and in
- Page 48 and 49:
30 Chapter 3 formula of [Ru3 II,III
- Page 50 and 51:
Intensity, a. u. 32 Chapter 3 quali
- Page 52 and 53: 34 Chapter 3 After activating the R
- Page 54 and 55: 36 Chapter 3 presence of the residu
- Page 56 and 57: Intensity, a. u. 38 Chapter 3 the a
- Page 58 and 59: 40 Chapter 3 extent than acetic aci
- Page 60 and 61: 42 Chapter 3 Ru-nodes. Therefore, r
- Page 62 and 63: 44 Chapter 3 decomposition of [BF4]
- Page 64 and 65: deriv. normalized E) 46 Chapter 3 F
- Page 66 and 67: 48 Chapter 3 3.1.6 Summary Applying
- Page 68 and 69: 50 Chapter 3 3.2 Elaboration of Ru
- Page 70 and 71: 52 Chapter 3 with that of the Ru II
- Page 72 and 73: 54 Chapter 3 Figure 3.20. (a) XANES
- Page 74 and 75: 4 Linker-based MOF solid solutions:
- Page 76 and 77: 58 Chapter 4 4.1 Introduction 4.1.1
- Page 78 and 79: 60 Chapter 4 framework [Cu2(ndc)2(d
- Page 80 and 81: 62 Chapter 4 partial replacing of B
- Page 82 and 83: 64 Chapter 4 in the case of ip intr
- Page 84 and 85: 66 Chapter 4 4.2.1.1 Crystallinity
- Page 86 and 87: 68 Chapter 4 suggesting the absence
- Page 88 and 89: 70 Chapter 4 Table 4.1. The molar f
- Page 90 and 91: 72 Chapter 4 Figure 4.11. IR spectr
- Page 92 and 93: 74 Chapter 4 taking into account th
- Page 94 and 95: 76 Chapter 4 As quantitative digest
- Page 96 and 97: 78 Chapter 4 (Figure 4.16). Notably
- Page 98 and 99: 80 Chapter 4 framework Ru-species (
- Page 100 and 101: 82 Chapter 4 Figure 4.20. XANES spe
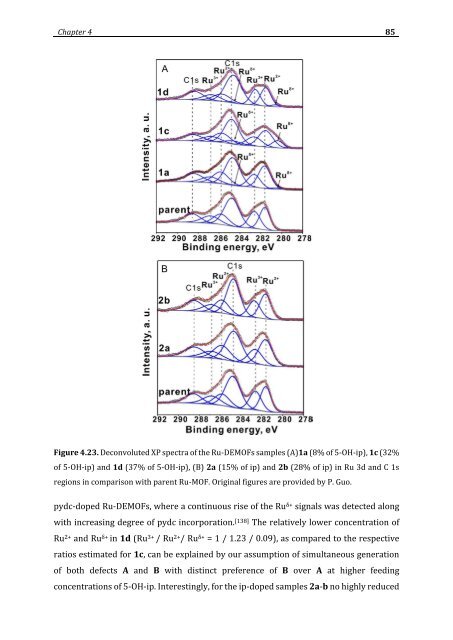
- Page 104 and 105: 86 Chapter 4 Ru δ+ have been obser
- Page 106 and 107: 88 Chapter 4 Figure 4.25. UHV-IR sp
- Page 108 and 109: 90 Chapter 4 Table 4.5. Possible de
- Page 110 and 111: CO 2 adsorbed, mmol/g 92 Chapter 4
- Page 112 and 113: H 2 adsorbed, mmol/g 94 Chapter 4 F
- Page 114 and 115: CO 2 adsorbed, mmol/g 96 Chapter 4
- Page 116 and 117: H 2 adsorbed, mmol/g 98 Chapter 4 8
- Page 118 and 119: H 2 adsorbed, mmol/g 100 Chapter 4
- Page 120 and 121: 102 Chapter 4 presence of H2. [236]
- Page 122 and 123: 104 Chapter 4 reactive metal center
- Page 124 and 125: 106 Chapter 4 4.2.6 Conclusions App
- Page 126 and 127: 108 Chapter 4 4.3 Defects Engineeri
- Page 128 and 129: Intensity, a. u. 110 Chapter 4 as-s
- Page 130 and 131: weight loss, % 112 Chapter 4 100 Cu
- Page 132 and 133: weight loss, % 114 Chapter 4 record
- Page 134 and 135: 116 Chapter 4 4.3.2 Composition and
- Page 136 and 137: V, cm 3 /g 118 Chapter 4 500 400 30
- Page 138 and 139: 120 Chapter 4 Figure 4.50. From lef
- Page 140 and 141: 5 Simultaneous introduction of vari
- Page 142 and 143: 124 Chapter 5 preferred like Cu 2+
- Page 144 and 145: 126 Chapter 5 5.2 Preparation and S
- Page 146 and 147: 128 Chapter 5 Figure 5.5. Pawley Fi
- Page 148 and 149: 130 Chapter 5 5.3 Compositional cha
- Page 150 and 151: 132 Chapter 5 Table 5.3. The assign
- Page 152 and 153:
134 Chapter 5 framework are dominan
- Page 154 and 155:
136 Chapter 5 5.4 Synthesis, compos
- Page 156 and 157:
138 Chapter 5 obtained Pd-doped sol
- Page 158 and 159:
140 Chapter 5 Figure 5.18. Deconvol
- Page 160 and 161:
V, cm 3 /g 142 Chapter 5 sorption i
- Page 162 and 163:
144 Chapter 5 time as well as the i
- Page 164 and 165:
146 Chapter 5 5.6 Conclusions In su
- Page 166 and 167:
148 Chapter 6 coordinating anion),
- Page 168 and 169:
7 Experimental Section In this Chap
- Page 170 and 171:
152 Chapter 7 as water and hydroxyl
- Page 172 and 173:
154 Chapter 7 internal standards an
- Page 174 and 175:
156 Chapter 7 Uppermost layer is in
- Page 176 and 177:
158 Chapter 7 to the more tightly b
- Page 178 and 179:
160 Chapter 7 7.2 Experimental data
- Page 180 and 181:
162 Chapter 7 [Ru2(OOCC(CH3)3)4(H2O
- Page 182 and 183:
164 Chapter 7 Figure 7.7. The PXRD
- Page 184 and 185:
166 Chapter 7 [Ru2(OOCCH3)4(H2O)2]B
- Page 186 and 187:
168 Chapter 7 [Ru2(OOCCH3)4](THF)2
- Page 188 and 189:
170 Chapter 7 [Ru3(BTC)2(OH)1.5]n·
- Page 190 and 191:
172 Chapter 7 [Ru3(BTC)2]n∙(AcOH)
- Page 192 and 193:
174 Chapter 7 Table 7.3. Feeding mo
- Page 194 and 195:
176 Chapter 7 For comparison of the
- Page 196 and 197:
178 Chapter 7 7.3.4 Synthesis of Cu
- Page 198 and 199:
180 Chapter 7 D3 The mixture of H3B
- Page 200 and 201:
182 Chapter 7 D5 This sample was re
- Page 202 and 203:
184 Chapter 7 The synthesis of D7 a
- Page 204 and 205:
186 Chapter 7 7.4 Experimental data
- Page 206 and 207:
188 Chapter 7 Figure 7.26. PXRD pat
- Page 208 and 209:
190 Chapter 7 7.4.2 Hydrogenation o
- Page 210 and 211:
192 Chapter 7 7.5 Supplementary det
- Page 212 and 213:
8 Bibliography [1] A. J. Ihde, The
- Page 214 and 215:
196 Bibliography [61] S. Ma, D. Sun
- Page 216 and 217:
198 Bibliography [121] T. K. Prasad
- Page 218 and 219:
200 Bibliography [180] Y. Kobayashi
- Page 220 and 221:
202 Bibliography [239] A. L. Harreu
- Page 222 and 223:
204 Bibliography [297] A. P. Hammer
- Page 224 and 225:
206 Appendix List of Presentations
- Page 226:
208 Appendix 05. 2015 Grant from th