Textbook Chapter 1
Create successful ePaper yourself
Turn your PDF publications into a flip-book with our unique Google optimized e-Paper software.
<strong>Chapter</strong> 1 Review Exercises 57<br />
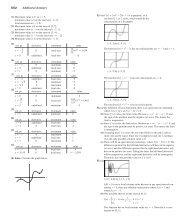
60. The graph of ƒ is shown. Draw<br />
the graph of each function.<br />
(a) y f (x)<br />
(b) y f (x)<br />
(c) y 2f (x 1) 1<br />
(d) y 3f (x 2) 2<br />
61. A portion of the graph of a function<br />
defined on [3, 3] is shown.<br />
Complete the graph assuming that<br />
the function is<br />
(a) even.<br />
(b) odd.<br />
62. Depreciation Smith Hauling purchased an 18-wheel truck for<br />
$100,000. The truck depreciates at the constant rate of $10,000<br />
per year for 10 years.<br />
V 100,000 10,000x, 0 x 10<br />
(a) Write an expression that gives the value y after x years.<br />
(b) When is the value of the truck $55,000? After 4.5 years<br />
63. Drug Absorption A drug is administered intravenously for<br />
pain. The function<br />
f (t) 90 52 ln (1 t), 0 t 4<br />
gives the number of units of the drug in the body after t hours.<br />
(a) What was the initial number of units of the drug administered?<br />
90 units<br />
(b) How much is present after 2 hours? (c) Draw the graph of f.<br />
90 52 ln 3 32.8722 units<br />
64. Finding Time If Joenita invests $1500 in a retirement account<br />
that earns 8% compounded annually, how long will it take this<br />
single payment to grow to $5000?<br />
65. Guppy Population The number of guppies in Susan’s<br />
aquarium doubles every day. There are four guppies initially.<br />
(a) Write the number of guppies as a function of time t. N 4 2 t<br />
(b) How many guppies were present after 4 days? after 1 week?<br />
4 days: 64; one week: 512<br />
(c) When will there be 2000 guppies? After ln 500<br />
8.9658 days,<br />
or after nearly 9 days.<br />
ln 2<br />
(d) Writing to Learn Give reasons why this might not be a<br />
good model for the growth of Susan’s guppy population.<br />
66. Doctoral Degrees Table 1.23 shows the number of doctoral<br />
degrees earned by Hispanic students for several years. Let x 0<br />
represent 1980, x 1 represent 1981, and so forth.<br />
Table 1.23 Doctorates Earned by Hispanic<br />
Americans<br />
Year<br />
Number of Degrees<br />
1981 456<br />
1985 677<br />
1990 780<br />
1995 984<br />
2000 1305<br />
Source: Statistical Abstract of the United States, 2004–2005.<br />
2<br />
1<br />
–1<br />
–1<br />
y<br />
1<br />
(1, –1)<br />
65. (d) Because it suggests the number of guppies will continue to double indefinitely and become arbitrarily<br />
large, which is impossible due to the finite size of the tank and the oxygen supply in the water.<br />
y<br />
1<br />
2<br />
(3, 2)<br />
3<br />
x<br />
x<br />
(a) Find a linear regression equation for the data and superimpose<br />
its graph on a scatter plot of the data. y 41.770x 414.342<br />
(b) Use the regression equation to predict the number of doctoral<br />
degrees that will be earned by Hispanic Americans in 2002. How<br />
close is the estimate to the actual number in 2002 of 1432?<br />
1333; the prediction is less than the actual number by 99<br />
(c) Writing to Learn Find the slope of the regression line.<br />
What does the slope represent?<br />
67. Population of New York Table 1.24 shows the population of<br />
New York State for several years. Let x 0 represent 1980, x 1<br />
represent 1981, and so forth.<br />
Table 1.24 Population of New York State<br />
Year Population (thousands)<br />
1980 17,558<br />
1990 17,991<br />
1995 18,524<br />
1998 18,756<br />
1999 18,883<br />
2000 18,977<br />
Source: Statistical Abstract of the United States, 2004–2005.<br />
y (17467.361) (1.00398) x<br />
(a) Find the exponential regression equation for the data and<br />
superimpose its graph on a scatter plot of the data.<br />
(b) Use the regression equation to predict the population in 2003.<br />
How close is the estimate to the actual number in 2003 of 19,190<br />
thousand? 19,138,000; the prediction is less than the actual number by<br />
about 52,000<br />
(c) Use the exponential regression equation to estimate the annual<br />
rate of growth of the population of New York State.<br />
0.00398 or 0.4%<br />
AP* Examination Preparation<br />
You may use a graphing calculator to solve the following<br />
problems.<br />
68. Consider the point P(2, 1) and the line L: x y 2.<br />
(a) Find the slope of L. m 1<br />
y x 1<br />
(b) Write an equation for the line through P and parallel to L.<br />
(c) Write an equation for the line through P and perpendicular to L.<br />
y x 3<br />
(d) What is the x-intercept of L? 2<br />
69. Let f (x) 1 ln(x 2).<br />
(2, ) (, )<br />
(a) What is the domain of f? (b) What is the range of f ?<br />
(c) What are the x-intercepts of the graph of ƒ? x 2 e 4.718<br />
(d) Find f 1 . (e) Confirm your answer algebraically in part (d).<br />
70. Let f (x) 1 3 cos(2x).<br />
(, )<br />
[2, 4]<br />
(a) What is the domain of f ? (b) What is the range of f ?<br />
(c) What is the period of f ? p<br />
(d) Is f an even function, odd function, or neither? even<br />
(e) Find all the zeros of f in p 2 x p. x 2.526<br />
69. (d) f 1 (x) 2 e 1x


