SIP 2016-2018 final

Create successful ePaper yourself
Turn your PDF publications into a flip-book with our unique Google optimized e-Paper software.
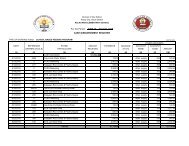
II-SITUATION OF CHILDREN / LEARNERS: ACCESS – IN AND OUT OF SCHOOL<br />
Introduction: Fill in only the age group/grade level that is applicable to your school.<br />
1. CHILDREN NOT IN SCHOOL<br />
1.2<br />
Age Total Population No. of Children NOT in % of Children NOT in School<br />
School<br />
Boys Girls Total Boys Girls Total Boys Girls Total<br />
4 128 121<br />
5 132 142 274 9 3 12 6.82 2.13 4.38<br />
6 115 131 246 5 2 7 4.35 1.53 2.85<br />
7 98 116 214 2 4 6 2.04 3.45 2.80<br />
8 105 124 229 5 3 8 4.76 2.42 3.49<br />
9 133 141 274 6 1 7 4.51 0.71 2.55<br />
10 123 136 259 3 2 5 2.44 1.47 1.93<br />
11 118 154 272 8 5 13 6.78 3.25 4.78<br />
12 124 137 261 12 7 19 9.68 5.11 7.28<br />
13 112 129 241 9 13 22 8.04 10.08 9.13<br />
14 88 77 165 4 5 9 4.55 6.49 5.45<br />
15 94 113 206 7 11 18 7.45 9.73 8.74<br />
16 110 124 234 15 10 25 13.64 8.06 10.68<br />
17 146 81 227 18 6 24 16.44 7.40 10.57<br />
TOTAL 4,495 1,605 3,100 103 72 175 6.89 4.49 5.65<br />
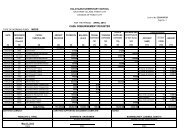
Reason for not attending school in the current SY<br />
Age<br />
No. of school<br />
-aged children<br />
not in<br />
school<br />
Financial<br />
Matters<br />
Health<br />
Nutrition<br />
NO. of children NOT in school according to reasona<br />
Child<br />
Labor<br />
Distance<br />
of School<br />
from<br />
Home<br />
Affected<br />
by<br />
Disaster<br />
Affected<br />
by<br />
conflict<br />
Disability<br />
Other<br />
Reasons<br />
5 12 4 1 0 2 2 0 3 0<br />
6 7 2 1 0 4 0 0 0 0<br />
7 6 2 1 0 3 0 0 0 0<br />
8 8 3 1 0 4 0 0 0 0<br />
9 7 2 0 0 5 0 0 0 0<br />
10 5 0 2 0 3 0 0 0 0<br />
11 13 2 0 3 6 2 0 0 0<br />
12 19 3 0 7 9 0 0 0 0<br />
13 22 5 0 6 11 0 0 0 0<br />
14 9 2 0 5 2 0 0 0 0<br />
15 18 3 0 9 6 0 0 0 0<br />
16 25 4 1 12 8 0 0 0 0<br />
17 24 2 0 7 15 0 0 0 0<br />
TOTAL 175 34 7 49 78 4 0 3 0<br />
Percent of<br />
Total 3.89% 0.76% 0.16% 1.09% 1.74% 0.09% 0% 0.07% 0%