1994;14;1751-1760 Arterioscler Thromb Vasc Biol AH Lichtenstein ...
1994;14;1751-1760 Arterioscler Thromb Vasc Biol AH Lichtenstein ...
1994;14;1751-1760 Arterioscler Thromb Vasc Biol AH Lichtenstein ...
- TAGS
- 1994

Create successful ePaper yourself
Turn your PDF publications into a flip-book with our unique Google optimized e-Paper software.
Short-term consumption of a low-fat diet beneficially affects plasma lipid concentrations<br />
only when accompanied by weight loss. Hypercholesterolemia, low-fat diet, and plasma<br />
lipids.<br />
A H <strong>Lichtenstein</strong>, L M Ausman, W Carrasco, J L Jenner, J M Ordovas and E J Schaefer<br />
<strong>Arterioscler</strong> <strong>Thromb</strong> <strong>Vasc</strong> <strong>Biol</strong>. <strong>1994</strong>;<strong>14</strong>:<strong>1751</strong>-<strong>1760</strong><br />
doi: 10.1161/01.ATV.<strong>14</strong>.11.<strong>1751</strong><br />
<strong>Arterioscler</strong>osis, <strong>Thromb</strong>osis, and <strong>Vasc</strong>ular <strong>Biol</strong>ogy is published by the American Heart Association, 7272<br />
Greenville Avenue, Dallas, TX 75231<br />
Copyright © <strong>1994</strong> American Heart Association, Inc. All rights reserved.<br />
Print ISSN: 1079-5642. Online ISSN: 1524-4636<br />
The online version of this article, along with updated information and services, is located on the<br />
World Wide Web at:<br />
http://atvb.ahajournals.org/content/<strong>14</strong>/11/<strong>1751</strong><br />
Permissions: Requests for permissions to reproduce figures, tables, or portions of articles originally published<br />
in <strong>Arterioscler</strong>osis, <strong>Thromb</strong>osis, and <strong>Vasc</strong>ular <strong>Biol</strong>ogy can be obtained via RightsLink, a service of the<br />
Copyright Clearance Center, not the Editorial Office. Once the online version of the published article for<br />
which permission is being requested is located, click Request Permissions in the middle column of the Web<br />
page under Services. Further information about this process is available in the Permissions and Rights<br />
Question and Answer document.<br />
Reprints: Information about reprints can be found online at:<br />
http://www.lww.com/reprints<br />
Subscriptions: Information about subscribing to <strong>Arterioscler</strong>osis, <strong>Thromb</strong>osis, and <strong>Vasc</strong>ular <strong>Biol</strong>ogy is online<br />
at:<br />
http://atvb.ahajournals.org//subscriptions/<br />
Downloaded from<br />
http://atvb.ahajournals.org/ by guest on December 7, 2012
Short-term Consumption of a Low-Fat Diet<br />
Beneficially Affects Plasma Lipid Concentrations<br />
Only When Accompanied by Weight Loss<br />
Hypercholesterolemia, Low-Fat Diet, and Plasma Lipids<br />
Alice H. <strong>Lichtenstein</strong>, Lynne M. Ausman, Wanda Carrasco, Jennifer L. Jenner,<br />
Jose M. Ordovas, Ernst J. Schaefer<br />
Abstract Study subjects (6 women and 5 men) over the age<br />
of 40 years with fasting low-density lipoprotein cholesterol<br />
concentrations >130 mg/dL were studied during three 5-week<br />
diet phases and one 10-week phase: baseline (36% fat: 13%<br />
saturated fatty acids [SFA], 12% monounsarurated fatty acids<br />
[MUFA], 8% polyunsaturated fatty acids [PUFA], and 128 mg<br />
cholesterol/1000 kcal); reduced fat (29% fat: 7% SFA 9%<br />
MUFA 11% PUFA and 85 mg cholesterol/1000 kcal); and<br />
two low fat (15% fat: 5% SFA 5% MUFA 3% PUFA and 73<br />
mg cholesterol/1000 kcal). Body weight was maintained during<br />
the first three 5-week phases (baseline, reduced fat, and low<br />
fat [—• energy]) and decreased during the last 10-week phase<br />
when the low-fat diet was provided such that the subjects<br />
determined, in part, their caloric intake (low fat [I energy]).<br />
Mean body weight declined by 0.62±0.47 kg/wk during the first<br />
5 weeks and 0.43±0.43 kg/wk during the second 5 weeks of the<br />
10-week low-fat (I energy) period. Relative to the baseline<br />
diet, plasma cholesterol concentrations decreased from<br />
226±33 to 195 + 19 (-13%), 208±22 (-7%), and 190±19<br />
(-15%) mg/dL when the subjects consumed the reduced-fat,<br />
low-fat (-» energy), and low-fat (j energy) diets, respectively.<br />
Low-density lipoprotein cholesterol concentrations decreased<br />
There is general agreement that the fat content of<br />
the average diet should be reduced. 1 Reference<br />
to such recommendations is not without historical<br />
basis. 2 Additionally, the general consensus appears<br />
to be that cutting the saturated fat content of the diet<br />
imparts the most benefit with respect to lowering<br />
plasma cholesterol levels. 35 The optimal level to which<br />
the total and saturated fat content in the diet should be<br />
reduced is far more controversial. 610<br />
Current National Cholesterol Education Program<br />
(NCEP) dietary recommendations concerning fat are<br />
relatively broad: total fat intake s30% and saturated fat<br />
intake £10% of calories (step 1) or
1752 <strong>Arterioscler</strong>osis and <strong>Thromb</strong>osis Vol <strong>14</strong>, No 11 November <strong>1994</strong><br />
would make complying with a low-fat diet more difficult<br />
unless specially modified products were consumed.<br />
Therefore, most recommendations advocate replacing<br />
fat with complex carbohydrate. 1 - 34 Potential benefits to<br />
this approach include increased nutrient density and<br />
fiber content in the diet 35 - 36 and possibly satiety or a<br />
feeling of fullness depending on the source of supplemental<br />
carbohydrate. 37 - 38 Disadvantages include, at<br />
least transiently, an increase in plasma triglyceride<br />
concentrations and a concomitant decrease in HDL-C<br />
concentrations. 3 - 4 - 39 - 43 An increase in plasma triglyceride<br />
concentration can be avoided by small incremental<br />
increases as opposed to one big increase in the carbohydrate<br />
content of the diet. 44<br />
The third alternative when reducing the fat content<br />
of the diet is to not replace it with anything. The<br />
approach of radically reducing the fat content of the<br />
diet without specific efforts to maintain body weight<br />
has been reported to result in a spontaneous decrease<br />
in caloric intake and weight loss 745 - 46 and, when assessed,<br />
a dramatic lowering of plasma lipid concentrations<br />
and reduction in the severity of coronary atherosclerotic<br />
lesions. 6 ' 7 ' 47 ' 48<br />
Taking the above points into consideration, a study<br />
was designed to investigate the effects of consuming a<br />
diet containing 36% of calories as fat with a fatty acid<br />
composition approximating that currently consumed in<br />
the United States, a reduced-fat diet containing 29% of<br />
calories as fat designed to met NCEP step 2 guidelines<br />
(reduced fat), and a low-fat diet containing 15% of<br />
calories as fat (low fat). The latter diet was consumed<br />
either at levels to maintain body weight (as were the<br />
baseline and reduced-fat diets) or at levels determined,<br />
in part, by the individual volunteer. The study volunteers<br />
were middle-aged and older men and women with<br />
moderately elevated plasma lipid levels and mean body<br />
mass indexes. The results of the study suggest that<br />
drastically reducing the fat content of the diet had an<br />
unfavorable effect on plasma lipoprotein concentrations<br />
unless accompanied by weight loss. Additionally, maximal<br />
effects of dietary modification on plasma lipoprotein<br />
concentrations were realized only during the initial<br />
weight-loss period.<br />
Methods<br />
Subjects<br />
Eleven (6 female and 5 male) subjects with a mean age of 60<br />
years (range, 44 to 78 years) with LDL-C concentrations<br />
greater than 130 mg/dL underwent a medical history, physical<br />
examination, and had clinical chemical analyses performed<br />
before enrollment in the study. The subjects had no evidence<br />
of any chronic illness, including hepatic, renal, thyroid, or<br />
cardiac dysfunction. They did not smoke, indicated they were<br />
able to abstain from alcohol for the duration of the study<br />
period, and were not taking medication known to affect plasma<br />
lipid levels (eg, lipid-lowering drugs, /3-adrenergic blocking<br />
agents, diuretics, or hormones). All the women were postmenopausal.<br />
These subjects were recruited as part of a larger<br />
study to investigate the effects of fatty acid and cholesterol<br />
intake on plasma lipid concentrations. <strong>14</strong> - 49 - 51 The initial study<br />
cohort was composed of 15 subjects, 4 of whom chose not to<br />
participate in the later additional phases of the study. Eliminating<br />
their screening data from the remaining subjects' data<br />
did not significantly change the overall characteristics of the<br />
study group. This protocol has been approved by the Human<br />
Investigation Review Committee of the New England Medical<br />
Center and Tufts University.<br />
Experimental Design<br />
All subjects participated in each of three 5-week study<br />
phases. They first consumed a diet similar in fat content to that<br />
currently consumed in the United States (baseline), which<br />
provided 17% of calories as protein, 48% as carbohydrate,<br />
36% as fat (13% saturated fatty acids [SFA], 12% MUFA, 8%<br />
polyunsaturated fatty acids [PUFA]), and 128 mg cholesterol/<br />
1000 kcal. The subjects next consumed a reduced-fat diet<br />
(reduced fat) containing 17% of calories as protein, 53% as<br />
carbohydrate, 29% as fat (7% SFA, 9% MUFA, 11% PUFA),<br />
and 85 mg cholesterol/1000 kcal. During the third 5-week<br />
period, the subjects ate a low-fat (-» energy) diet containing<br />
17% protein, 68% carbohydrate, 15% fat (5% SFA, 5%<br />
MUFA, 3% PUFA), and 73 mg cholesterol/1000 kcal. Each<br />
diet was consumed for 5 weeks at caloric levels that maintained<br />
stable body weights. Plasma lipid levels stabilize after 4<br />
weeks on a diet, 52 and there is no effect of order of diets on<br />
study outcome. 51 Mean caloric intake was 2679±608 kcal<br />
(range, 2000 to 4000 kcal) during the first three phases.<br />
The fourth phase of the study (low fat [| energy]) was<br />
designed to provide the same nutrient composition as the<br />
low-fat (third) phase, but it allowed the subjects to determine,<br />
in part, their caloric intake. This final diet was conceived to<br />
test the hypothesis that drastically reducing the fat content of<br />
the diet will result in spontaneous weight loss and subsequently<br />
beneficially affect plasma lipid profiles. To accomplish<br />
this aim within the context of a metabolic study protocol,<br />
subjects were provided with and required to consume two<br />
thirds of the caloric intake they received during the low-fat (-»<br />
energy) phase. All food components of the diet were reduced<br />
proportionally. Participants were also provided with an additional<br />
two thirds of their caloric intake in the form of 200-kcal<br />
portions of frozen entrees normally present in their diet, the<br />
composition of which was similar to that of the low-fat diet.<br />
The subjects were instructed that they had to consume the first<br />
two thirds of the food provided and could determine how<br />
much additional food they were to consume thereafter. In the<br />
most extreme cases they could have either consumed one third<br />
fewer or one third more calories than on the low-fat (-•<br />
energy) phase. When a subject reported that a food item was<br />
consumed subsequent to the previous visit (s3 days), it was<br />
replaced so that the additional food was always available. The<br />
study period for the fourth (low-fat [| energy]) phase was thus<br />
continued for an additional 5 weeks (10 weeks total) so that<br />
potential effects of changes in body weight on plasma lipid<br />
concentration could be better monitored. Data are reported<br />
for the first 5-week time point for comparisons with the other<br />
dietary phases and for the second 5-week time point for<br />
comparisons within that phase.<br />
Triplicate preparations of each complete meal cycle (3 days)<br />
for each diet phase were analyzed by Hazleton Laboratories<br />
America, Inc. The composition, fatty acid profile, and cholesterol<br />
content of the diets are shown in Table 1. In general,<br />
there was good agreement between the analytical and calculated<br />
data except for cholesterol, which was overestimated in<br />
the food composition tables.<br />
All food and drink were provided by the Metabolic Research<br />
Unit of the US Department of Agriculture (USDA)<br />
Human Nutrition Research Center on Aging at Tufts University<br />
for consumption on site or packaged for takeout. The<br />
subjects were required to report to the research unit a<br />
minimum of three times per week, have blood pressure and<br />
weight measured at each visit, and consume at least one meal<br />
on site each time. They were encouraged to maintain their<br />
habitual level of physical activity throughout the study period.<br />
Four times during the final week of study phases one through<br />
three or during weeks 5 and 10 of the low-fat (| energy) phase<br />
fasting blood samples were obtained for lipid and apolipopro-<br />
Downloaded from<br />
http://atvb.ahajournals.org/ by guest on December 7, 2012
TABLE 1. Composition of the Study Diets As<br />
Determined by Chemical Analysis<br />
Diet<br />
Variable Baseline Reduced Fat Low Fat<br />
Protein, %<br />
Carbohydrate, %<br />
Fat, %<br />
SFA,%<br />
12:0<br />
<strong>14</strong>:0<br />
16:0<br />
18:0<br />
MUFA, %<br />
16:1<br />
18:1<br />
PUFA,%<br />
18:2 n6<br />
18:3 n3<br />
20:4 n6<br />
Cholesterol,<br />
mg/1000 kcaJ<br />
16.5±0.5<br />
48.1 ±2.9<br />
35.6+2.4<br />
12.90±1.97<br />
0.37±0.03<br />
1.45±0.22<br />
6.86±0.96<br />
3.29±0.67<br />
12.17±1.60<br />
0.05±0.10<br />
11.16±1.29<br />
7.94±0.75<br />
6.95±0.66<br />
0.82±0.06<br />
0.06±0.01<br />
128±21<br />
17.4 t0.9<br />
53.3 t2.4<br />
29.4 t1.5<br />
6.90 t0.60<br />
0.09 t0.01<br />
0.04 t0.04<br />
4.33: t0.30<br />
1.60 t0.21<br />
8.98: t0.64<br />
0.30 fcO.08<br />
8.40 t0.55<br />
11.21 t0.52<br />
10.67 t0.53<br />
0.40 t0.06<br />
0.05: t0.01<br />
<strong>Lichtenstein</strong> et al Low-Fat Diet, Weight Loss, and Plasma Lipids 1753<br />
16.9±0.6<br />
68.0:<br />
15.1: :2.6<br />
5.01: :0.93<br />
0.12d :0.02<br />
0.47: :0.09<br />
2.77d:0.46<br />
1.36d:0.31<br />
4.86d:0.657<br />
0.24: :0.02<br />
4.46: :0.64<br />
2.54: :0.50<br />
2.20: :0.42<br />
0.26; :0.06<br />
0.04: :0.01<br />
85±4 73±3<br />
SFA indicates saturated fatty acids; MUFA, monounsaturated<br />
tatty acids; and PUFA, polyunsaturated fatty acids. See "Methods"<br />
for definitions of diets. Values are mean±SD; n=3.<br />
tein determinations. On one day during the final week of the<br />
first three phases or during weeks 5 and 10 of the low-fat (J,<br />
energy) phase subjects consumed their three meals plus one<br />
snack at standardized intervals, and blood was sampled at 0, 5,<br />
8, 10, and 24 hours.<br />
Biochemical Analysis<br />
Fasting (12-hour) blood was collected in tubes containing<br />
0.1% EDTA, and very-low-density lipoprotein (VLDL) was<br />
isolated from plasma by a single ultracentrifugational spin at<br />
density 1.006 g/mL (39 000 rpm for 18 hours at 4°C). Plasma<br />
and the 1.006-g/mL infranate were assayed for total cholesterol<br />
and/or triglyceride with an Abbott Diagnostics ABA-200<br />
bichromatic analyzer using enzymatic reagents. 33 HDL-C was<br />
measured as described, 54 and non-HDL-C (total cholesterol<br />
minus HDL-C) was determined in nonfasting plasma after<br />
HDL-C precipitation. Lipid assays were standardized through<br />
the Lipid Standardization Program of the Centers for Disease<br />
Control and Prevention, Atlanta, Ga. Within-run and between-run<br />
coefficients of variation of these assays were less<br />
than 5%.<br />
Apolipoprotein (apo) B was assayed with a noncompetitive,<br />
enzyme-linked assay by using immunopurified polyclonal antibodies<br />
53 in plasma after VLDL had been removed. Plasma<br />
apoA-I was assayed in the same manner by using apoA-I<br />
polyclonal antibodies. 56 Coefficients of variation for both assays<br />
were less than 5% within runs and less than 10% between<br />
runs. Assays were standardized with LDL containing only<br />
apoB and purified apoA-I with the protein content determined<br />
by amino add analysis. Lipoprotein(a) [Lp(a)] was quantified<br />
by using an enzyme-linked assay with a monoclonal antibody<br />
that did not cross-react with plasminogen as the first antibody<br />
and a polyclonal antibody as the second antibody that was<br />
directed against the apo(a) portion of the Lp(a) particle<br />
(Terumo Medical Corp). Lp(a) concentrations are expressed<br />
as total Lp(a) mass in milligrams per deciliter. 57<br />
TABLE 2. Baseline Characteristics of the<br />
Study Subjects<br />
Variable<br />
Women<br />
(n=6)<br />
Men<br />
(n=5)<br />
Mean<br />
Age, y 66±12 54±12 60±13<br />
Body weight, kg 69+18 82±<strong>14</strong> 75+17<br />
Height, cm 159±3 175±10 166±10<br />
Body mass index, kg/m 2 27.2+6 0 26.8±2.4 27.0±4.5<br />
Total cholesterol, mg/dl 243+32 244±11 243±23<br />
VLDL cholesterol, mg/dL 27+7 29±12 28±9<br />
LDL-C, mg/dL 167±28 173±15 169±22<br />
HDL-C, mg/dL 50+9 42±12 46±10<br />
Triglycerides, mg/dL 135±35 <strong>14</strong>4±61 139±46<br />
TC/HDL-C 5.03±1.13 6.16±1.79 5.55±1.51<br />
VLDL indicates very-low-density lipoprotein; LDL-C, low-density<br />
lipoprotein cholesterol; HDL-C, high-density lipoprotein cholesterol;<br />
and TC, total cholesterol. Values are mean±SD.<br />
Statistical Analysis<br />
The data were analyzed by using SAS (STATISTICAL ANALYSIS<br />
SYSTEM; SAS Institute Inc) both for the IBM-compatible<br />
personal computer using version 6.04 and as run on a VAX<br />
mainframe (Digital Equipment Corp), PROC GLM was used for<br />
ANOVA procedures for repeated measures followed by<br />
Tukey's t test performed at the ^=.05, .01, and .001 levels of<br />
comparison.<br />
Results<br />
The mean age of the study subjects was 60 ±13 years<br />
(Table 2); all subjects had somewhat elevated body mass<br />
indexes. At the time of screening they had a mean<br />
LDL-C concentration of 169±22 mg/dL. The women<br />
tended to have higher HDL-C and lower LDL-C concentrations<br />
than the men.<br />
The consumption of the reduced-fat diet (29% of<br />
calories as fat) resulted in 13%, 18%, and 10% decreases<br />
in total cholesterol, LDL-C, and HDL-C concentrations,<br />
respectively, relative to the baseline diet<br />
(36% of calories as fat) (Table 3 and Fig 1). Changes in<br />
LDL apoB concentrations mirrored those of LDL-C. In<br />
contrast, despite a decrease in HDL-C concentrations,<br />
there was little change in the concentration of apoA-I.<br />
These changes resulted in similar total cholesterol/<br />
HDL-C ratios but significantly lower LDL apoB/apoA-I<br />
ratios. No significant effects of consuming the reducedfat<br />
diet on the concentrations of triglyceride and Lp(a)<br />
relative to the baseline diet were observed.<br />
When the fat content of the diet was decreased to<br />
15% of calories and consumed at isocaloric levels (low<br />
fat [-> energy]), there was a less favorable effect on<br />
plasma lipid levels than when the fat content of the diet<br />
was reduced to only 29% of calories. Relative to the<br />
baseline diet, there were 7%, <strong>14</strong>%, and 25% decreases<br />
in total cholesterol, LDL-C, and HDL-C concentrations<br />
during the low-fat (-» energy) period (Table 3 and Fig<br />
1). These changes were accompanied by dramatic increases<br />
in VLDL cholesterol (95%) and triglyceride<br />
(75%) concentrations.<br />
Relative to the baseline diet the decrease in LDL<br />
apoB concentrations (-17%) was similar to that observed<br />
for LDL-C concentrations (-<strong>14</strong>%); however, as<br />
Downloaded from<br />
http://atvb.ahajournals.org/ by guest on December 7, 2012
1754 <strong>Arterioscler</strong>osis and <strong>Thromb</strong>osis Vol <strong>14</strong>, No 11 November <strong>1994</strong><br />
TABLE 3. Effects of Dietary Fat Reduction and Weight Loss on Plasma Upld and<br />
Upoproteln Concentrations<br />
Upld or<br />
Upoproteln<br />
Total cholesterol<br />
VLDL cholesterol<br />
LDL-C<br />
HDL-C<br />
Triglycerides<br />
TC/HDL<br />
LDLapoB<br />
ApoA-l<br />
Lp(a)§<br />
LDL apoB/apoA-l<br />
Baseline<br />
226±33*<br />
21 ±6*<br />
158±28*<br />
48±11*<br />
110±32t<br />
4.99±1.30t<br />
105±23*<br />
131 ±23*<br />
16±21*<br />
0.82±0.21*<br />
Reduced<br />
Fat<br />
195±19tt<br />
(-13+7)<br />
25±3t*<br />
(33±48)<br />
128 + 16+*<br />
(-18 ±9)<br />
42±9t<br />
(-10±6)<br />
115+311"<br />
(8 ±25)<br />
4.78±0.97t<br />
82±18t<br />
(-20 + 16)<br />
129+20*t<br />
(-1+9)<br />
17±23*<br />
(7±<strong>14</strong>)<br />
0.65+0.19+<br />
Diet<br />
Low Fat<br />
(—Energy)<br />
208±22t<br />
(-7±10)<br />
39±15*<br />
(95±69)<br />
134±17t<br />
(-<strong>14</strong>±12)<br />
35±7t<br />
(-25±10)<br />
188±76*<br />
(75±51)<br />
6.13±1.43*<br />
85±13t<br />
(-17±13)<br />
116±<strong>14</strong>t+<br />
(-10+10)<br />
15±21*<br />
(-2±25)<br />
0.74±0.13*t<br />
Low Fat<br />
(i Energy)<br />
190±19+<br />
(-15±8)<br />
32±9*t<br />
(64 ±62)<br />
119±15+<br />
(-23±9)<br />
38±8t*<br />
(-18±10)<br />
130±32f<br />
(22 ±25)<br />
5.13±1.09t<br />
74±18t<br />
(-23±24)<br />
111 =t 15t*<br />
(-12±10)<br />
13±24t<br />
(-27±33)<br />
0.68±0.19*t<br />
VLDL indicates very-low-density lipoproteln; LDL-C, low-density lipoprotein cholesterol; HDL-C,<br />
high-density lipoprotein cholesterol; TC, total cholesterol; apo, apolipoprotein; and Lp(a), lipoprotein(a).<br />
Values are in milligrams per deciliter (mean percent difference from baseline). See "Methods"<br />
for definitions of diets.<br />
Values without a common symbol were significantly different at P
o<br />
IT<br />
o<br />
o<br />
o<br />
O<br />
o<br />
160<br />
75<br />
BASE-<br />
UNE<br />
RfOUCED<br />
FAT<br />
LOW FAT<br />
- ENERGY<br />
LOW FAT<br />
I ENERGY<br />
o<br />
IT<br />
O 125<br />
X<br />
o<br />
O 100<br />
BASE-<br />
LINE<br />
REDUCED<br />
FAT<br />
<strong>Lichtenstein</strong> et al Low-Fat Diet, Weight Loss, and Plasma Lipids 1755<br />
LOW FAT<br />
- ENERGY<br />
LOW FAT<br />
1 ENERGY<br />
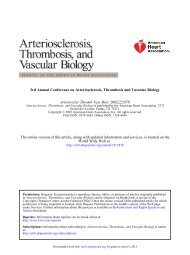
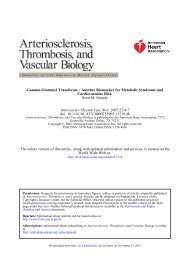
FIQ 1. Une plots of Individual plasma lipid concentrations at<br />
the end of each diet phase. See "Methods" for definitions of<br />
diets. LDL indicates low-density lipoprotein; HDL, high-density<br />
lipoprotein.<br />
and Fig 2). Postprandial plasma cholesterol and non-<br />
HDL-C concentrations were not significantly different<br />
from fasting values. In contrast, HDL-C concentrations<br />
consistently exhibited a postprandial fall of 5% to 7%,<br />
which was significantly different from fasting levels over<br />
all the diet phases.<br />
Mean postprandial plasma triglyceride concentrations<br />
(at 5-, 8-, and 10-hour time points) were approximately<br />
twofold higher than fasting values and were<br />
statistically different from fasting values for all diet<br />
phases. By 24 hours plasma triglyceride concentrations<br />
were statistically indistinguishable from the initial fasting<br />
values regardless of dietary treatment.<br />
The differences observed among diets with respect to<br />
postprandial total cholesterol, non-HDL-C, HDL-C,<br />
and triglyceride concentrations were similar to those<br />
observed in the fasting state. Postprandial total cholesterol<br />
concentrations were from lowest to highest when<br />
the subjects consumed the low-fat (j, energy), reducedfat,<br />
low-fat (-» energy), and baseline diets. In general,<br />
non-HDL-C concentrations were lowest when the subjects<br />
consumed the low-fat (| energy) and reduced-fat<br />
diets and highest when they consumed the low-fat<br />
(-> energy) and baseline diets. HDL-C concentrations<br />
were from lowest to highest when the subjects consumed<br />
the low-fat (—» energy), low-fat (j energy), reduced<br />
fat, and baseline diets. Postprandial triglyceride<br />
concentrations were significantly higher at the end of<br />
the low-fat (-» energy) diet than at the end of any of the<br />
other diet periods.<br />
The study subjects continued to consume the low-fat<br />
(| energy) diet for an additional 5 weeks (Table 5).<br />
Although there was a persistent loss of body weight,<br />
albeit at a somewhat slower rate (0.62±0.47 versus<br />
0.43±0.43 per week, first and second diet periods,<br />
respectively), the greatest effect of weight loss on<br />
plasma lipid and apolipoprotein concentrations occurred<br />
after the first 5 weeks of the fourth study period.<br />
Plasma lipid and apolipoprotein concentrations remained<br />
remarkably stable during the second 5-week<br />
period of the low-fat (J. energy) phase.<br />
Discussion<br />
Impressive observations have been made with respect<br />
to the benefits of extremely low-fat diets on plasma lipid<br />
concentrations and regression of atherosclerotic<br />
plaque. 6 ' 7 ' 58 Populations that normally consume low-fat<br />
diets are generally reported to have lower plasma lipid<br />
concentrations and rates of coronary heart disease than<br />
those consuming higher fat diets. 59 In such populations<br />
caloric intake tends to be lower and fiber intake higher<br />
than in societies consuming higher fat diets, and obesity<br />
is generally not cited as a major public health problem.<br />
5961 In general, the consumption of ad libitum<br />
quantities of low-fat diets relative to higher fat diets<br />
on an experimental basis is accompanied by weight<br />
loss. 45 ' 46 - 6268 Increasing the fat intake of people who<br />
habitually consume a low-fat diet has been reported to<br />
result in weight gain and adverse effects on plasma<br />
lipid concentrations. 69 The results of a recent metaanarysis<br />
of studies assessing the relation between<br />
weight change and plasma lipid levels concluded that<br />
weight loss is associated with an improvement of<br />
plasma lipid profiles. 70<br />
Taking these observations into consideration, we<br />
investigated the effects of reduced-fat and low-fat<br />
diets with and without weight loss on plasma lipid,<br />
lipoprotein, and apolipoprotein concentrations. Middle-aged<br />
and elderly female and male subjects with<br />
plasma LDL-C concentrations that indicated the need<br />
for dietary modification were targeted, since this is the<br />
group for which recommendations to reduce dietary<br />
fat content are frequently made. (Although body mass<br />
index was not a screening criterion, the group of<br />
subjects participating in the study, qualifying on the<br />
basis of having LDL-C levels above 130 mg/dL, had a<br />
somewhat elevated mean body mass index [27.0±4.5]).<br />
We do not have anthropometric measures of the study<br />
subjects, and differences in body fat distribution could<br />
have modified the effect of weight loss on their plasma<br />
lipid levels. Given that limitation, the results of the<br />
investigation suggest, relative to a baseline diet, that<br />
when body weight was maintained, reducing the total<br />
and saturated fat content of the diet in accordance<br />
with the current NCEP step 2 guidelines resulted in a<br />
significant decrease in total cholesterol, LDL-C, and<br />
HDL-C concentrations. Further reducing the total fat<br />
content of the diet under the same conditions also<br />
resulted in decreased concentrations of total cholesterol,<br />
LDL-C, and HDL-C, although the reductions in<br />
total cholesterol and LDL-C were less dramatic and<br />
the decrease in HDL-C greater than when the subjects<br />
consumed the reduced-fat diet. Accompanying these<br />
changes was a striking increase in plasma triglycerides<br />
and VLDL cholesterol concentrations. The end result<br />
was a less favorable plasma lipid profile with respect to<br />
cardiovascular risk. Allowing the subjects to decrease<br />
their caloric intake while maintaining the macronutri-<br />
Downloaded from<br />
http://atvb.ahajournals.org/ by guest on December 7, 2012
1756 <strong>Arterioscler</strong>osis and <strong>Thromb</strong>osis Vol <strong>14</strong>, No 11 November <strong>1994</strong><br />
TABLE 4. Postprandial Plasma Upld Response to Three Meals and On* Snack at the<br />
End of Each Diet Phase<br />
Hours<br />
Postprandial<br />
0<br />
5<br />
8<br />
10<br />
24<br />
0<br />
5<br />
8<br />
10<br />
24<br />
0<br />
5<br />
8<br />
10<br />
24<br />
0<br />
5<br />
8<br />
10<br />
24<br />
Baseline<br />
226±32*<br />
224 ±32*<br />
223±34*<br />
225 ±35*<br />
227±35*<br />
179±32*<br />
179±33*<br />
178±36*<br />
180±37*<br />
179±34*<br />
48±11*<br />
45±10*<br />
45+10*<br />
45+9*<br />
48+11*<br />
1O9±31t<br />
174+92t<br />
187±77*t<br />
201 ±82*t<br />
113±39t<br />
Reduced<br />
Fat<br />
195±19t*<br />
193±17f*<br />
192±17t*<br />
197±22f*<br />
195±21f*<br />
153±16t<br />
153±16t<br />
153±17t<br />
158±21f*<br />
153±18t<br />
43±9t<br />
40±9t<br />
39±8t<br />
39±9t<br />
41±8t<br />
1<strong>14</strong>±30t<br />
180±71t<br />
230±90*<br />
239±<strong>14</strong>2*t<br />
121±38t<br />
Total cholesterol<br />
Non-HDL-C<br />
HDL-C<br />
Triglycerides<br />
Diet<br />
Low Fat<br />
(^ Energy)<br />
2O8±22t<br />
209±23*t<br />
208±22*t<br />
207±26*t<br />
210±24*t<br />
172 ±24*<br />
175 ±24*<br />
175 ±25*<br />
173±28*t<br />
174+24*<br />
35±7*<br />
34 + 7*<br />
33+7*<br />
33+7*<br />
36+7*<br />
185+77*<br />
248+113*<br />
243±125*<br />
259+109*<br />
198+83*<br />
Low Fat<br />
(I Energy)<br />
190±19*<br />
185+20*<br />
182±25*<br />
182±23*<br />
187±23**<br />
152±19t<br />
<strong>14</strong>8±20t<br />
<strong>14</strong>5±23t<br />
<strong>14</strong>4±22t<br />
<strong>14</strong>8±22t<br />
38±8*<br />
37±6t*<br />
37±8t*<br />
37±7f*<br />
39±7t*<br />
129±33t<br />
162±61t<br />
<strong>14</strong>1±51t<br />
152±51t<br />
126±34t<br />
HDL-C indicates htgh-density llpoproteln cholesterol; non-HDL-C, total cholesterol minus HDL-C.<br />
Values are mean±SD and are expressed in milligrams per deciliter; n=11. See "Methods" for<br />
definitions of diets.<br />
ANOVA for each time point using data from all four diet groups showed a significant effect of diet<br />
(P
-1 250<br />
O 225<br />
CE<br />
UJ<br />
d 20 °<br />
X<br />
o<br />
_l<br />
5 17!<br />
— 50<br />
_i<br />
O a:<br />
UJ<br />
co<br />
ai<br />
O<br />
o<br />
30<br />
I 8 12 16 20 24<br />
TIME (hours)<br />
1 3 12 19 20 24<br />
TIME (hours)<br />
300<br />
o> 250<br />
LU<br />
n<br />
— 200<br />
UJ<br />
o<br />
g<br />
a:<br />
150<br />
100<br />
<strong>Lichtenstein</strong> et al Low-Fat Diet, Weight Loss, and Plasma Lipids 1757<br />
8 12 16<br />
TIME (hours)<br />
« a 12 19<br />
TIME (hours)<br />
fat or low-fat (| energy) diets were consumed, the<br />
relative change in LDL and LDL apoB concentrations<br />
exceeded that of HDL-C or apoA-I.<br />
When the subjects consumed the reduced-fat diet,<br />
which was consistent with NCEP step 2 guidelines, total<br />
cholesterol, LDL-C, and HDL-C concentrations decreased<br />
relative to the baseline diet. Further reducing<br />
the fat content of the diet from 29% to 15% of calories<br />
was achieved by eliminating most sources of added fat.<br />
In keeping with the design of the study the actual foods<br />
making up the diet were not altered. This resulted in a<br />
large decrease in poryunsaturated fat, a moderate decrease<br />
in monounsaturated fat, and a smaller decrease<br />
in saturated fat in the diet. These changes themselves<br />
may have accounted for the greater decrease in HDL-C<br />
than LDL-C when subjects consumed the low-fat (—><br />
energy) diet. However, at extremely low levels of total<br />
fat in the diet, observations pertaining to the differential<br />
effects of the different individuals or classes of fatty<br />
acids may not be valid.<br />
Decreasing the fat content of the diet and increasing<br />
the carbohydrate content likely resulted in a concomitant<br />
increase in the level of fiber in the diet, 35 - 36 a<br />
variable that was not specifically addressed in the current<br />
study. Independent effects of total and soluble fiber<br />
on plasma lipid levels have been documented. 7173 However,<br />
the primary aim of the present investigation was to<br />
assess the effects of varying the fat content of the diet<br />
with commonly available foods. An alternate approach,<br />
to isolate the independent effects of fat and fiber, would<br />
have necessitated artificially keeping the fiber constant<br />
while altering the fat content of the diet, which would<br />
have answered a different but interesting experimental<br />
question.<br />
The trigfyceride levels remained relatively stable<br />
when the carbohydrate content of the diet was increased<br />
20 24<br />
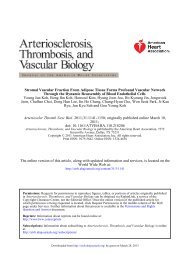
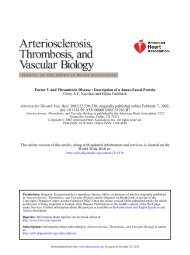
FIG 2. Line plots of mean postprandial total cholesterol,<br />
non-high-density llpoprotein (HDL) cholesterol, HDL cholesterol,<br />
and triglyceride values after subjects were ted a<br />
baseline (circle), reduced-fat (triangle), low-fat (-> energy)<br />
(square), or low-fat (J. energy) (diamond) diet. See "Methods"<br />
for definitions of diets. *P
1758 <strong>Arterioscler</strong>osis and <strong>Thromb</strong>osis Vol <strong>14</strong>, No 11 November <strong>1994</strong><br />
TABLE 5. Effects of Continued Weight Loss on Plasma<br />
Upld and Upoproteln Concentrations<br />
Upld or<br />
Upoproteln<br />
Total cholesterol<br />
VLDL cholesterol<br />
LDL-C<br />
HDL-C<br />
Trig lyce rides<br />
TC/HDL<br />
LDLapoB<br />
ApoA-l<br />
Lp(a)*<br />
LDL apoB/apoA-l<br />
Low Fat<br />
(1 Energy),<br />
Weeks 1-5<br />
190+19<br />
(-15±8%)<br />
32±9<br />
(64 ±62%)<br />
119±15<br />
(-23+9%)<br />
38±8<br />
(-18±10%)<br />
130±32<br />
(22 ±25%)<br />
5.13±1.09<br />
74±18<br />
(-23+24%)<br />
111±15<br />
13+24<br />
(-27±33%)<br />
0.68±0.19<br />
Diet<br />
Low Fat<br />
(I Energy),<br />
Weeks 6-10<br />
190±17<br />
(-15±9%)<br />
31 ±7<br />
(66±87%)<br />
121 ±15<br />
(-23 + 10%)<br />
38±7<br />
(-18±9%)<br />
120±32<br />
(15±39%)<br />
5.09±1.00<br />
86±17<br />
(-7±20%)<br />
110±10<br />
12±21<br />
(-37±26%)<br />
0.80±0.20<br />
VLDL Indicates very-low-density lipoproteln; LDL-C, low-density<br />
lipoproteln cholesterol; HDL-C, high-density lipoprotein cholesterol;<br />
TC, total cholesterol; apo, apollpoproteln; and Lp(a),<br />
lipoprotein(a). Values are mean±SD and are expressed in<br />
milligrams per deciliter (mean percent difference from baseline).<br />
See "Methods" for definitions of diets.<br />
*Raw data were transformed to logt0 values before statistical<br />
analysis.<br />
centrations clearly needs to be investigated. In addition,<br />
at what level plasma lipids stabilize once lower body<br />
weights are achieved and maintained remains to be<br />
determined.<br />
Consuming a low-fat diet in the absence of specific<br />
efforts to maintain a constant body weight resulted in<br />
weight loss. No apparent relation between the magnitude<br />
of body weight change and change in plasma lipid<br />
concentrations was identified. A larger sample size<br />
would have been necessary to more thoroughly assess<br />
such issues.<br />
The present study was designed to study the effect of<br />
moderate and radical reductions in fat intake on<br />
plasma measures of cardiovascular risk. The data<br />
suggest, at least in the short term, that diets consistent<br />
with NCEP step 2 guidelines result in significant<br />
reductions in plasma lipid concentrations; however,<br />
radical reductions in fat intake have a beneficial effect<br />
on plasma lipid profiles only when accompanied by<br />
weight loss.<br />
Acknowledgments<br />
This work was supported by contract 53-3K06-5-10 from the<br />
USDA, grant HL 39326 from the National Institutes of Health,<br />
Bethesda, Md, and by a grant from the American Heart<br />
Disease Prevention Foundation, Inc, Fairfax, Va. The contents<br />
of this publication do not necessarily reflect the views or<br />
policies of the USDA nor does mention of trade names,<br />
commercial products, or organizations imply endorsement by<br />
the US government. The authors would like to thank the staff<br />
of the Metabolic Research Unit for the expert care provided to<br />
the study subjects and gratefully acknowledge the cooperation<br />
of the study subjects, without whom this investigation would<br />
not have been possible.<br />
References<br />
I. National Cholesterol Education Program Expert Panel. Summary<br />
of the second report of the National Cholesterol Education<br />
Program (NCEP) expert panel on detection, evaluation, and<br />
treatment of high blood cholesterol in adults (Adult Treatment<br />
Panel \\).JAMA. 1993;269:3015-3023.<br />
2. Mann J. Complex carbohydrates: replacement energy for fat or<br />
useful in their own right? Am J Clin Nutr. 1987;45(suppl):<br />
1202-1206.<br />
3. National Research Council Committee on Diet and Health. Fats<br />
and other lipids. In: Diet and Health: Implications for Reducing<br />
Chronic Disease Risk. Washington, DC: National Academy PTess;<br />
1989:183.<br />
4. Grundy SM, Denke MA. Dietary influences on serum lipids and<br />
lipoproteins. / Lipid Res. 1990;31:1<strong>14</strong>9-1172.<br />
5. Nichaman MZ, Hamm P. Low-fat, high-carbohydrate diets and<br />
plasma cholesterol. Am J Clin Nutr. 1987;45:1155-1160.<br />
6. Blankenhorn DH, Johnson RL, Mack WJ, El Zein HA, Vailas LI.<br />
The influence of diet on the appearance of new lesions in human<br />
coronary arteries. JAMA. 1990;263:1646-1652.<br />
7. Oraish D, Brown SE, Scherwitz LW, Billings JH, Armstrong WT,<br />
Ports TA, McLanahan SM, Kirkeeide RL, Brand RJ, Gould KL.<br />
Can lifestyle changes reverse coronary heart disease? Lancet. 1990;<br />
336:129-133.<br />
8. Grundy SM. Monounsaturated fatty acids and cholesterol metabolism:<br />
implications for dietary recommendations. J Nutrition. 1989;<br />
119:529-533.<br />
9. Brussaard JH, Dallinga-Thie G, Groot PHE, Katan MB. Effects of<br />
amount and type of dietary fat on serum lipids, lipoproteins and<br />
apolipoproteins in man: a controlled 8-week trial. Atherosclerosis.<br />
1980;36:515-527.<br />
10. Brussaard JH, Katan MB, Groot PHE, Havekes LM, Hautvast<br />
GAJ. Serum lipoproteins of healthy persons fed a low-fat diet or a<br />
polyunsaturated fat diet for three months. Atherosclerosis. 1982;42:<br />
205-219.<br />
11. Shephard J, Packard CJ, Grundy SM, Yeshurun D, Gotto AM,<br />
Taunton OD. Effects of saturated and polyunsaturated fat diets on<br />
the chemical composition and metabolism of low density lipoprotein<br />
in man. / Lipid Res. 1980;21:91-99.<br />
12. Vega GL, Groszek E, Wolf R, Grundy SM. Influence of polyunsaturated<br />
fats on composition of plasma lipoproteins and apolipoproteins.<br />
J Lipid Res. 1982;23:811-822.<br />
13. Fumeron F, Brigant L, Parra H-J, Bard J-M, Fruchart J-C,<br />
Apfelbaum M. Lowering of HDL2-cholesterol and lipoprotein A-I<br />
particle levels by increasing the ratio of polyunsaturated to saturated<br />
fatty acids. Am J Clin Nutr. 1991^3:655-659.<br />
<strong>14</strong>. Schaefer EJ, Levy RI, Ernst ND, van Sant FD, Brewer BH. The<br />
effects of low cholesterol, high polyunsaturated fat, and low-fat<br />
diets on plasma lipid and lipoprotein cholesterol levels in normal<br />
and hypercholesterolemic subjects. Am J Clin Nutr. 1981;34:<br />
1758-1763.<br />
15. <strong>Lichtenstein</strong> <strong>AH</strong>, Ausman LM, Carrasco W, Jenner JL, Gualtieri<br />
LJ, Goldin BR, Ordovas JM, Schaefer EJ. Effects of canola, corn,<br />
and olive oils on fasting and postprandial plasma lipoproteins in<br />
humans as part of a National Cholesterol Education Program Step<br />
2 diet <strong>Arterioscler</strong> <strong>Thromb</strong>. 1993;13:1533-1542.<br />
16. Brinton EA, Eisenberg S, Breslow JL. A low-fat diet decreases<br />
high density lipoprotein (HDL) cholesterol levels by decreasing<br />
HDL apolipoprotein transport rates. J Chn Invest 1990;85:<br />
<strong>14</strong>4-151.<br />
17. Mattson FH, Grundy SM. Comparison of effects of dietary saturated,<br />
monounsaturated, and polyunsaturated fatty acids on<br />
plasma lipids and lipoproteins in man. J Lipid Res. 1985;26:<br />
194-202.<br />
18. Mensink R, Katan MB. Effect of a diet enriched with monounsaturated<br />
or polyunsaturated fatty acids on levels of low-density and<br />
high-density lipoprotein cholesterol in healthy women and men.<br />
NEnglJMed 1989;321:436-441.<br />
Downloaded from<br />
http://atvb.ahajournals.org/ by guest on December 7, 2012
19. McDonald BE, Genard JM, Bruce VM, Comer EJ. Comparison<br />
of the effect of olive oil and sunflower oil on plasma lipids and<br />
lipoproteins and on in vivo thromboxane A2 and prostacyclin<br />
production in healthy young men. Am J Clin Nutr. 1989;50:<br />
1382-1388.<br />
20. Dreon DM, Vranizan KM, Krauss RM, Austin MA, Wood PD.<br />
The effects of polyunsaturated fat vs monounsaturated fat on<br />
plasma lipoproteins. JAMA. 1990;263:2462-2466.<br />
21. Wardlaw GM, Snook JT. Effect of diets high in butter, corn oil, or<br />
high-oleic acid sunflower oil on serum lipids and apolipoproteins in<br />
men. Am J Clin Nutr. 1990^1:815-821.<br />
22. Ginsberg HN, Barr SL, GUbert A, Karmally W, Deckelbaum R,<br />
Kaplan K, Ramakrishnan R, Holleran S, Dell RB. Reduction of<br />
plasma cholesterol levels in normal men on an American Heart<br />
Association Step I diet or a Step I diet with added monounsaturated<br />
fat. N Engi J Med. 1990;322:574-579.<br />
23. Chan JK, Bruce VM, McDonald BE. Dietary alpha-linolenic acid<br />
is as effective as oleic acid and linoleic acid in lowering blood<br />
cholesterol in normolipidemic men. Am J CUn Nutr. 1991;53:<br />
1230-1234.<br />
24. BerTy EM, Eisenberg S, Haratz D, Friedlander Y, Norman Y,<br />
Kaufmann NA, Stein Y. Effects of diet rich in monounsaturated<br />
fatty acids on plasma lipoproteins: the Jerusalem Nutrition Study;<br />
high MUFAs vs high PUFAs. Am J Clin Nutr 1991;53:899-907.<br />
25. Wardlaw GM, Snook JT, Lin M-C, Puangco MA, Kwon JS. Serum<br />
lipid and apolipoprotein concentrations in healthy men on diets<br />
enriched in either canola oil or safflower oil. Am J Clin Nutr.<br />
1991^4:104-110.<br />
26. Mata P, Arvarez-Sala LA Rubio MJ, Nuno J, Oya MD. Effects of<br />
long-term monunsatuxated- vs polyunsaturated-enriched diets on<br />
lipoproteins in healthy men and women. Am J Clin Nutr 1992;55:<br />
846-850.<br />
27. Wahrburg U, Martin H, Sandkamp M, Schulte H, Assmann G.<br />
Comparative effects of a recommended lipid-lowering diet vs a diet<br />
rich in monounsaturated fatty acids on serum lipid profiles in<br />
healthy young adults. Am J CUn Nutr. 1992^6:678-683.<br />
28. Becker N, IUingworth DR, Alaupovic P, Connor WE, Sundberg<br />
EE. Effects of saturated, monounsaturated, and n-6 polyunsaturated<br />
fatty acids on plasma lipids, lipoproteins, and apoproteins<br />
in humans. Am J Clin Nutr. 1983^7:355-360.<br />
29. Masana L, Camprubi M, Sarda P, Sola R, Joven J, Turner PR. The<br />
Mediterranean-type diet: is there a need for further modification?<br />
Am J Clin Nutr. 1991^3:886-889.<br />
30. Sirtori CR, Tremoli E, Gatti E, Montanari G, Sirtori M, Colli S,<br />
Gianfraceschi G, Maderna P, Dentone CZ, Testolin G, Galli C.<br />
Controlled evaluation of fat intake in the Mediterranean diet:<br />
comparative activities of olive oil and corn oil on plasma lipids and<br />
platelets in high-risk patents. Am J CUn Nutr. 1986;44:635-642.<br />
31. Mata P, Garrido JA, Ordovas JM, Blazquez E, AJvarez-Sala LA,<br />
Rubio MJ, Alonso R, de Oya M. Effect of dietary monounsaturated<br />
fatty acids on plasma lipoprotein and apolipoproteins in<br />
women. Am J Clin Nutr. 1992^6:77-83.<br />
32. Valsta LM, Jauhiainen H Aro A, Katan MB, Mutanen M. Effects<br />
of a monounsaturated rapeseed oil and a polyunsaturated sunflower<br />
oil diet on lipoprotein levels in humans. <strong>Arterioscler</strong> <strong>Thromb</strong>.<br />
1992;12:5O-57.<br />
33. National Research Council Committee on Diet and Health.<br />
Protein. In: Diet and Health: Implications for Reducing Chronic<br />
Disease Risk. Washington, DC: National Academy Press; 1989:259.<br />
34. Szostak WB, Cybulska B. Dietary carbohydrates in the prevention<br />
and treatment of metabolic diseases of major public health<br />
importance. Am J CUn Nutr. 1987;45:1207-1217.<br />
35. Dougherty RM, Fong AKH, Iacono JM. Nutrient content of the<br />
diet when the fat is reduced. Am J Clin Nutr. 1988;48:970-979.<br />
36. Retzlaff BM, Dowdy AA, Walden CE, McCann BS, Gey G,<br />
Cooper M, Knopp RH. Changes in vitamin and mineral intakes<br />
and serum concentrations among free-Irving men on cholesterollowering<br />
diets: the Dietary Alternatives Study. Am J Clin Nutr.<br />
1991^3:890-898.<br />
37. Tremblay A, Lavallee N, Almeras N, Allard L, Despres J,<br />
Bouchard C. Nutritional determinants of the increase in energy<br />
intake associated with a high fat diet. Am J Clin Nutr. 1991 ;53:<br />
1134-1137.<br />
38. Rolls BJ, Kim S, McNelis AL, Fischman MW, Foltin RW, Moran<br />
TH. Time course of effects of preloads high in fat or carbohydrate<br />
on food intake and hunger ratings in humans. Am J PhysioL 1991;<br />
26O:R756-R763.<br />
39. Hatch JT, Abell LL, Kendall FE. Effects of restriction of dietary<br />
fat and cholesterol upon serum lipids and lipoproteins in patients<br />
with hypertension. Am J Med. 1955;19:48-60.<br />
<strong>Lichtenstein</strong> et al Low-Fat Diet, Weight Loss, and Plasma Lipids 1759<br />
40. Coulston AM, Liu GC, Reaven GM. Plasma glucose, insulin and<br />
lipid responses to high carbohydrate, low fat diets in normal<br />
humans. Metabolism. 1983;32:52-56.<br />
41. Antonis A, Bersohn 1. Influence of diet on serum triglyceride in<br />
South African White and Bantu prisoners. Lancet. 1961;l:3-9.<br />
42. Lewis B, Hammett F, Katan M, Kay RM, Merkx I, Nobels A,<br />
Miller NE, Swan AV. Towards an improved lipid-lowering diet:<br />
additive effects of changes in nutrient intake. Lancet. 1981;2:<br />
1310-1313.<br />
43. Simpson HCR, Mann JI, Meade TW, Chakrabarti R, Stirling Y,<br />
Woolf L. Hypertriglyceridaemia and hypercoagulability. Lancet<br />
1983;l:786-790.<br />
44. UUmann D, Connor WE, Hatcher LF, Connor SL, FlaveU DP. Will<br />
a high-carbohydrate, low-fat diet lower plasma lipids and lipoproteins<br />
without producing hypertriglyceridemia? <strong>Arterioscler</strong><br />
<strong>Thromb</strong>. 1991;11:1059-1067.<br />
45. Lissner L, Levitsky DA, Strupp BJ, Kalkwarf HJ, Roe DA. Dietary<br />
fat and the regulation of energy intake in human subjects. Am J<br />
CUn Nutr. 1987;46:886-892.<br />
46. Kendall A, Levitsky DA, Strupp BJ, Lissner L. Weight loss on a<br />
low-fat diet: consequence of the imprecision of the control of food<br />
intake in humans. Am J Clin Nutr. 1991^3:1124-1129.<br />
47. Walford RL, Harris SB, Gunion MW. The caloricalry restricted<br />
low-fat nutrient-dense diet in Biosphere 2 significantly lowers blood<br />
glucose, total leukocyte count, cholesterol, and blood pressure in<br />
humans. Proc NatlAcad Sd USA. 1992;89:11533-11537.<br />
48. Thuesen L, Henriksen LB, Engby B. One-year experience with a<br />
low-fat low-cholesterol diet in patients with coronary heart disease.<br />
Am J CUn Nutr. 1986;44:212-219.<br />
49. <strong>Lichtenstein</strong> <strong>AH</strong>, Ausman LM, Carrasco W, Jenner JL, Ordovas<br />
JM, Schaefer EJ. Hydrogenation impairs the hypolipidemic effect<br />
of corn oil in humans. <strong>Arterioscler</strong> <strong>Thromb</strong>. 1993;13:154-161.<br />
50. <strong>Lichtenstein</strong> <strong>AH</strong>, Ausman LM, Carrasco W, Jenner JL, Gualtieri<br />
LJ, Goldin BR, Ordovas JM, Schaefer EJ. Hypercholesterolemic<br />
effect of dietary cholesterol in diets enriched in polyunsaturated<br />
and saturated fat. <strong>Arterioscler</strong> <strong>Thromb</strong>. <strong>1994</strong>;<strong>14</strong>:168-175.<br />
51. <strong>Lichtenstein</strong> <strong>AH</strong>, Ausman LM, Carrasco W, Jenner JL, Gualtieri<br />
LJ, Goldin BR, Ordovas JM, Schaefer EJ. Rice bran oil consumption<br />
and plasma lipid levels in moderately hypercholesterolemic<br />
humans. <strong>Arterioscler</strong> <strong>Thromb</strong>. <strong>1994</strong>;<strong>14</strong>:546-556.<br />
52. <strong>Lichtenstein</strong> <strong>AH</strong>, Millar J, McNamara JR, Ordovas JM, Schaefer<br />
EJ. Long-term lipoprotein response to the NCEP Step 2 diet<br />
enriched in n-3 fatty acids. Circulation. 1992;82(suppl III):III-475.<br />
Abstract.<br />
53. McNamara JR, Schaefer EJ. Automated enzymatic standardized<br />
lipid analyses for plasma and lipoprotein fractions. Clin ChemActa.<br />
1987;166:l-8.<br />
54. Warnick GR, Benderson J, Albers JJ. Dextran sulfate-Mg++ precipitation<br />
procedure for quantitation of high density lipoprotein<br />
cholesterol. Clin Chim Ada. 1982;28:1379-1388.<br />
55. Ordovas JM, Peterson J, Santaniello P, Cohn JG, Wilson JWF,<br />
Schaefer EJ. Enzyme-linked immunosorbent assay for human<br />
plasma apolipoprotein B. J Lipid Res. 1987;28:1216-1224.<br />
56. Schaefer EJ, Ordovas JM. Metabolism of apolipoproteins A-I, A-II<br />
and A-IV. Methods Enzymol. 1986;129:420-443.<br />
57. Jenner JL, Ordovas JM, Lamon-Fava S, Schaefer MM, Wilson<br />
PWF, Castelli WP, Schaefer EJ. Effects of age, sex, and menopausal<br />
status on plasma lipoprotein(a) levels: the Framingham<br />
Offspring Study. Circulation. 1993;87:1135-1<strong>14</strong>1.<br />
58. Gould KL, Ornish D, Kirkeeide R, Brown S, Stuart Y, Buchi M,<br />
Billings J, Armstrong W, Ports T, Scherwitz L_ Improved stenosis<br />
geometry by quantitative coronary arteriography after vigorous<br />
risk factor modification. Am J Cardiol. 1992;69:845-853.<br />
59. Stamler J. Population studies. In: Levy RI, Rif kind BM, Dennis<br />
BH, Ernst N, eds. Nutrition, Lipids and Coronary Heart Disease.<br />
New York, NY: Raven Press; 1979:25-88.<br />
60. Gordon T, Kagan A, Garcia-Palmieri M, Kannel WB, Zukel WJ,<br />
Tillotson J, Sortie P, Hjortland M. Diet and its relation to coronary<br />
heart disease and death in three populations. Circulation. 1981;63:<br />
500-515.<br />
61. Schaefer EJ, Rees DG, Siguel EN. Nutrition, lipoproteins, and<br />
atherosclerosis. Am J CUn Nutr. 1986^:99-111.<br />
62. Kasim SE, Martino S, Kim PN, Khilnani S, Boomer A, Depper J,<br />
Reading BA, Heilbrun LK. Dietary and anthropometric determinants<br />
of plasma lipoproteins during a long-term low-fat diet in<br />
healthy women. Am J CUn Nutr. 1993^7:<strong>14</strong>6-153.<br />
63. Thomas CD, Peters JC, Reed GW, Abumrad NN, Sun M, Hill JO.<br />
Nutrient balance and energy expenditure during ad libitum<br />
feeding of high-fat and high-carbohydrate diets in humans. Am J<br />
CUn Nutr. 1992^5:934-942.<br />
Downloaded from<br />
http://atvb.ahajournals.org/ by guest on December 7, 2012
<strong>1760</strong> <strong>Arterioscler</strong>osis and <strong>Thromb</strong>osis Vol <strong>14</strong>, No 11 November <strong>1994</strong><br />
64. Duncan KH, Bacon JA, Weinsier RL. The effects of high and low<br />
energy density diets on satiety, energy intake, and eating time of<br />
obese and nonobese subjects. Am J Clin Nutr. 1983^7:763-767.<br />
65. Trerablay A, Lavallee N, Almeras N, Allard L, Despres J,<br />
Bouchard C. Nutritional determinants of the increase in energy<br />
intake associated with a high-fat diet. Am J Clin Nutr. 1991^53:<br />
1134-1137.<br />
66. Sheppard L, Kristal AR, Kushi LH. Weight loss in women participating<br />
in a randomized trial of low-fat diets. Am J Clin Nutr.<br />
1991^4:821-828.<br />
67. Insull W, Henderson MW, Prentice RL, Thompson DJ, Clifford C,<br />
Goodman S, Gorbach S, Moskowitz M, Thompson R, Woods M.<br />
Results of a randomized feasibility study of a low-fat diet. Arch<br />
Intern Med. 1990,150:421-427.<br />
68. Blundell JE, Burley VJ, Cotton JR, Lawton CL. Dietary fat and<br />
the control of energy intake: evaluating the effects of fat on meal<br />
size and postmeal satiety. Am J Clin Nutr. 1993;57(suppl):<br />
772S-777S.<br />
Downloaded from<br />
http://atvb.ahajournals.org/ by guest on December 7, 2012<br />
69. McMurry MP, Cerqueira MT, Connor SL, Connor WE. Changes<br />
in lipid and lipoprotein levels and body weight in Tarahumara<br />
Indians after consumption of an affluent diet. N EnglJ Med. 1991;<br />
325:1704-1708.<br />
70. Dattilo AM, Kris-Etherton PM. Effects of weight reduction on<br />
blood lipids and lipoproteins: a meta-anah/sis. Am J Clin Nutr.<br />
71. Jenkins DJA, Wolever TMS, Rao AV, Hegele RA, Mitchell SJ,<br />
Ransom TPP, Boctor DL, Spadafora PJ, Jenkins AL, Mehlina C, et<br />
al. Effect on blood lipids of very high intakes of fiber in diets low<br />
in saturated fat and cholesterol. N EnglJ Med. 1993^329:21-26.<br />
72. Bell LP, Hectorn KJ, Reynolds H, Hunninghake DB. Cholesterollowering<br />
effects of soluble-fiber cereals as part of a prudent diet for<br />
patients with mild to moderate hypercholesterolemia. Am J Clin<br />
Nutr. 1990-42:1020-1026.<br />
73. Miettinen TA. Dietary fiber and lipids. Am J Clin Nutr. 1987;45:<br />
1237-1242.