ARIZONA & MEXICO
gzQP301iFyz
gzQP301iFyz
Create successful ePaper yourself
Turn your PDF publications into a flip-book with our unique Google optimized e-Paper software.
WORKFORCE TRENDS AND ECONOMIC DEVELOPMENT EFFORTS<br />
IN THE SOUTHWEST BORDER REGION<br />
By Alex Steenstra, Ph.D., Rosalicia Cordova, D.M., Rakesh Pangasa, Ph.D., and Jeremy Spencer, M.B.A.<br />
Mexico’s population growth rates are slowing down and education levels are rising.<br />
The community across Arizona’s Southwest Border is relatively populous and prosperous.<br />
Binational collaboration between Mexico and the United States includes emergency response<br />
plans, health efforts, economic development, and workforce development.<br />
Educational institutions and economic development agencies from both sides of the border<br />
provide opportunities for workforce and economic development.<br />
Northern Arizona University in Yuma promotes regional economic development, cross-border<br />
education, and workforce development through collaboration with Mexican universities and<br />
incubators across the region through the Business Innovation Accelerator.<br />
Differences in unemployment rates, income levels and education levels together with an<br />
underdeveloped workforce separated by a national border provide both challenges and opportunities<br />
that are being explored by educational institutions and economic development agencies in the border<br />
communities of Arizona and Mexico. This section looks at initiatives to address the challenges in<br />
education, economic, and workforce development in the desert Southwest border region.<br />
SLOWER POPULATION GROWTH AND RISING EDUCATION LEVELS IN <strong>MEXICO</strong><br />
The following data for Mexico has implications for workforce and economic development in the region.<br />
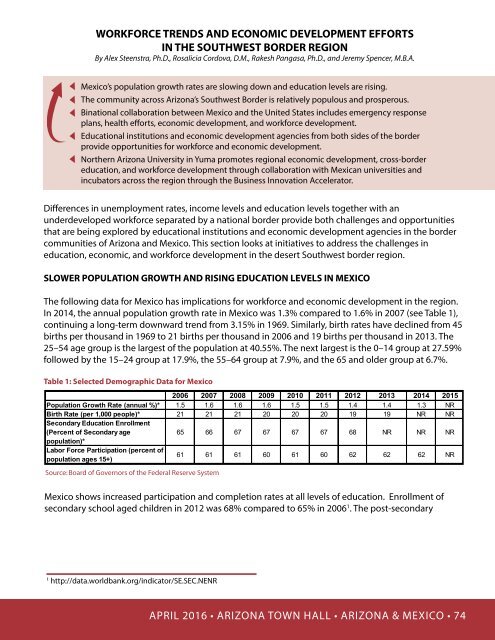
In 2014, the annual population growth rate in Mexico was 1.3% compared to 1.6% in 2007 (see Table 1),<br />
continuing a long-term downward trend from 3.15% in 1969. Similarly, birth rates have declined from 45<br />
births per thousand in 1969 to 21 births per thousand in 2006 and 19 births per thousand in 2013. The<br />
25–54 age group is the largest of the population at 40.55%. The next largest is the 0–14 group at 27.59%<br />
followed by the 15–24 group at 17.9%, the 55–64 group at 7.9%, and the 65 and older group at 6.7%.<br />
Table 1: Selected Demographic Data for Mexico<br />
2006 2007 2008 2009 2010 2011 2012 2013 2014 2015<br />
Population Growth Rate (annual %)* 1.5 1.6 1.6 1.6 1.5 1.5 1.4 1.4 1.3 NR<br />
Birth Rate (per 1,000 people)* 21 21 21 20 20 20 19 19 NR NR<br />
Secondary Education Enrollment<br />
(Percent of Secondary age<br />
65 66 67 67 67 67 68 NR NR NR<br />
population)*<br />
Labor Force Participation (percent of<br />
population ages 15+)<br />
61 61 61 60 61 60 62 62 62 NR<br />
Purchasing Power Parity 7.186 7.348<br />
Source: Board of Governors of the Federal Reserve System<br />
7.470 7.430 7.668 7.673 7.859 8.015 7.927 NR<br />
Mexico shows increased participation and completion rates at all levels of education. Enrollment of<br />
secondary school aged children in 2012 was 68% compared to 65% in 2006 1 . The post-secondary<br />
1<br />
http://data.worldbank.org/indicator/SE.SEC.NENR<br />
APRIL APRIL 2016 2016 • • <strong>ARIZONA</strong> TOWN TOWN HALL HALL 108 •• <strong>ARIZONA</strong> & <strong>MEXICO</strong>• 38 74


