Attention! Your ePaper is waiting for publication!
By publishing your document, the content will be optimally indexed by Google via AI and sorted into the right category for over 500 million ePaper readers on YUMPU.
This will ensure high visibility and many readers!

Your ePaper is now published and live on YUMPU!
You can find your publication here:
Share your interactive ePaper on all platforms and on your website with our embed function

eldo_user

You also want an ePaper? Increase the reach of your titles
YUMPU automatically turns print PDFs into web optimized ePapers that Google loves.
Monte Carlo Analysis<br />
Additional Uncertainty Analyses (the .mcm File)<br />
and:<br />
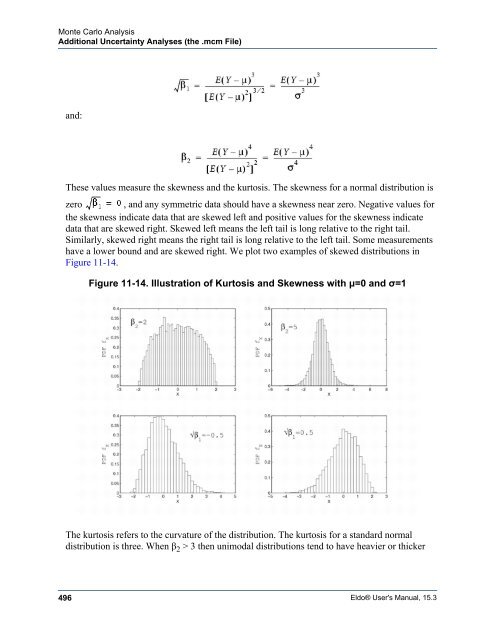
These values measure the skewness and the kurtosis. The skewness for a normal distribution is<br />
zero , and any symmetric data should have a skewness near zero. Negative values for<br />
the skewness indicate data that are skewed left and positive values for the skewness indicate<br />
data that are skewed right. Skewed left means the left tail is long relative to the right tail.<br />
Similarly, skewed right means the right tail is long relative to the left tail. Some measurements<br />
have a lower bound and are skewed right. We plot two examples of skewed distributions in<br />
Figure 11-14.<br />
Figure 11-14. Illustration of Kurtosis and Skewness with μ=0 and σ=1<br />
The kurtosis refers to the curvature of the distribution. The kurtosis for a standard normal<br />
distribution is three. When β 2 > 3 then unimodal distributions tend to have heavier or thicker<br />
496<br />
Eldo® User's Manual, 15.3
Monte Carlo Analysis Additional Uncertainty Analyses (the .mcm File) and: These values measure the skewness and the kurtosis. The skewness for a normal distribution is zero , and any symmetric data should have a skewness near zero. Negative values for the skewness indicate data that are skewed left and positive values for the skewness indicate data that are skewed right. Skewed left means the left tail is long relative to the right tail. Similarly, skewed right means the right tail is long relative to the left tail. Some measurements have a lower bound and are skewed right. We plot two examples of skewed distributions in Figure 11-14. Figure 11-14. Illustration of Kurtosis and Skewness with μ=0 and σ=1 The kurtosis refers to the curvature of the distribution. The kurtosis for a standard normal distribution is three. When β 2 > 3 then unimodal distributions tend to have heavier or thicker 496 Eldo® User's Manual, 15.3
Monte Carlo Analysis Additional Uncertainty Analyses (the .mcm File) tails than the normal distribution. They also have higher modes in the central area. When β 2 3(n−1)/(n+1) indicates thick tails in the distribution. In the .mcm file we provide Fisher G-statistics to remove the bias in b 2 . The quantities are analogous to and b 2 , but involve ratios of unbiased cumulant. We give the formulae here: These values are presented in the following table: Eldo® User's Manual, 15.3 497
- Page 1 and 2:
Eldo® User's Manual Release 15.3
- Page 3 and 4:
Table of Contents Chapter 1 Introdu
- Page 5 and 6:
Table of Contents Preparing and Ins
- Page 7 and 8:
Table of Contents Chapter 7 Running
- Page 9 and 10:
Table of Contents Eldo Reduction .
- Page 11 and 12:
Table of Contents Chapter 12 Statis
- Page 13 and 14:
Table of Contents Simulating a Bloc
- Page 15 and 16:
Table of Contents atanh . . . . . .
- Page 17 and 18:
Table of Contents xmin . . . . . .
- Page 19 and 20:
Table of Contents COS. . . . . . .
- Page 21 and 22:
Table of Contents One Step Relaxati
- Page 23 and 24:
List of Figures Figure 1-1. Cascade
- Page 25 and 26:
List of Figures Figure 14-1. Mixed-
- Page 27 and 28:
List of Tables Table 1-1. Documenta
- Page 29 and 30:
Chapter 1 Introduction to Eldo The
- Page 31 and 32:
Introduction to Eldo Getting Starte
- Page 33 and 34:
Introduction to Eldo Getting Starte
- Page 35 and 36:
Eldo Input and Output Files Introdu
- Page 37 and 38:
Introduction to Eldo Eldo Documenta
- Page 39 and 40:
Introduction to Eldo Documentation
- Page 41 and 42:
Chapter 2 Running Eldo This chapter
- Page 43 and 44:
Running Eldo Multi-Threading Eldo S
- Page 45 and 46:
Running Eldo Multi-Threading Eldo S
- Page 47 and 48:
Running Eldo Simulation Connection
- Page 49 and 50:
Running Eldo Simulation Connection
- Page 51 and 52:
Running Eldo Eldo Initialization Fi
- Page 53 and 54:
Running Eldo Location Maps Location
- Page 55 and 56:
Running Eldo Performance Bottleneck
- Page 57 and 58:
Running Eldo Statistics File Statis
- Page 59 and 60:
Running Eldo Additional Tools and U
- Page 61 and 62:
Chapter 3 Eldo Premier This chapter
- Page 63 and 64:
Eldo Premier Overview of Eldo Premi
- Page 65 and 66:
Eldo Premier Automatic Activation o
- Page 67 and 68:
Eldo Premier Handling Matrix-Like C
- Page 69 and 70:
Eldo Premier Eldo Premier Output El
- Page 71 and 72:
Eldo Premier Forcing Elaboration Ti
- Page 73 and 74:
Netlist reduction is activated with
- Page 75 and 76:
Eldo Premier Supported Commands Tab
- Page 77 and 78:
Eldo Premier Supported Commands Tab
- Page 79 and 80:
Table 3-3. Eldo Premier—Supported
- Page 81 and 82:
Table 3-3. Eldo Premier—Supported
- Page 83 and 84:
Table 3-3. Eldo Premier—Supported
- Page 85 and 86:
Table 3-3. Eldo Premier—Supported
- Page 87 and 88:
Table 3-3. Eldo Premier—Supported
- Page 89 and 90:
Eldo Premier Supported Models Enabl
- Page 91 and 92:
o Eldo Premier Other Supported Func
- Page 93 and 94:
Eldo Premier Miscellaneous Limitati
- Page 95 and 96:
Chapter 4 Eldo Netlist Setup This c
- Page 97 and 98:
Eldo Netlist Setup Netlist Structur
- Page 99 and 100:
Subcircuit Definitions and Calls El
- Page 101 and 102:
Eldo Netlist Setup Simulator Comman
- Page 103 and 104:
Eldo Netlist Setup General Aspects
- Page 105 and 106:
Eldo Netlist Setup Case-Sensitivity
- Page 107 and 108:
Eldo Netlist Setup Numerical Values
- Page 109 and 110:
Eldo Netlist Setup Functions, Opera
- Page 111 and 112:
Function PWL_LIN(xvalue, interp, x1
- Page 113 and 114:
Notes Eldo Netlist Setup Arithmetic
- Page 115 and 116:
Eldo Netlist Setup Operators Operat
- Page 117 and 118:
Eldo Netlist Setup Operators Bitwis
- Page 119 and 120:
Eldo Netlist Setup Expressions Spec
- Page 121 and 122:
Eldo Netlist Setup Directives Direc
- Page 123 and 124:
Eldo Netlist Setup Directives Inter
- Page 125 and 126:
Eldo Netlist Setup Directives to Po
- Page 127 and 128:
Eldo Netlist Setup Working With Sub
- Page 129 and 130:
Eldo Netlist Setup Subcircuits Spec
- Page 131 and 132:
Eldo Netlist Setup Subcircuits Rela
- Page 133 and 134:
Eldo Netlist Setup Device Libraries
- Page 135 and 136:
Eldo Netlist Setup Device Libraries
- Page 137 and 138:
Eldo Netlist Setup Device Libraries
- Page 139 and 140:
Eldo Netlist Setup Encrypting Libra
- Page 141 and 142:
Eldo Netlist Setup encrypt_eldo Too
- Page 143 and 144:
Eldo Netlist Setup encrypt_eldo Too
- Page 145 and 146:
Eldo Netlist Setup Protection of En
- Page 147 and 148:
Eldo Netlist Setup Protection of En
- Page 149 and 150:
Eldo Netlist Setup Protection of En
- Page 151 and 152:
Eldo Netlist Setup Protection of En
- Page 153 and 154:
Eldo Netlist Setup Protection of En
- Page 155 and 156:
Eldo was not able to find the reque
- Page 157 and 158:
Eldo Netlist Setup Running Multiple
- Page 159 and 160:
Eldo Netlist Setup Merging Instance
- Page 161 and 162:
Chapter 5 Simulator Compatibility E
- Page 163 and 164:
Simulator Compatibility Hybrid Comp
- Page 165 and 166:
Simulator Compatibility Devices in
- Page 167 and 168:
Simulator Compatibility Devices in
- Page 169 and 170:
Simulator Compatibility Commands in
- Page 171 and 172:
Simulator Compatibility Commands in
- Page 173 and 174:
Simulator Compatibility Options in
- Page 175 and 176:
Netlist in Compat Mode Some aspects
- Page 177 and 178:
Simulator Compatibility Arithmetic
- Page 179 and 180:
Simulator Compatibility Spectre Com
- Page 181 and 182:
Simulator Compatibility Spectre Com
- Page 183 and 184:
Eldo can be launched on the Spectre
- Page 185 and 186:
Simulator Compatibility Working wit
- Page 187 and 188:
Simulator Compatibility Troubleshoo
- Page 189 and 190:
Error Code Related Topics Spectre C
- Page 191 and 192:
Simulator Compatibility Spectre to
- Page 193 and 194:
Simulator Compatibility Spectre to
- Page 195 and 196:
Simulator Compatibility Spectre to
- Page 197 and 198:
spect2el Command Reference Simulato
- Page 199 and 200:
Simulator Compatibility spect2el Co
- Page 201 and 202:
Simulator Compatibility spect2el Co
- Page 203 and 204:
Chapter 6 Setting Up An Analysis Th
- Page 205 and 206:
DC and Operating Point Analyses The
- Page 207 and 208:
Setting Up An Analysis Performing a
- Page 209 and 210:
Setting Up An Analysis Operating Po
- Page 211 and 212:
Setting Up An Analysis DC Convergen
- Page 213 and 214:
Setting Up An Analysis DC Convergen
- Page 215 and 216:
Setting Up An Analysis Saving and R
- Page 217 and 218:
Setting Up An Analysis Transient An
- Page 219 and 220:
Setting Up An Analysis Saving and R
- Page 221 and 222:
.SAVE END in Combination with .REST
- Page 223 and 224:
Setting Up An Analysis Saving and R
- Page 225 and 226:
AC Analysis Results Setting Up An A
- Page 227 and 228:
Setting Up An Analysis Saving and R
- Page 229 and 230:
Loop Stability Analysis Setting Up
- Page 231 and 232:
Setting Up An Analysis Pole Zero An
- Page 233 and 234:
Setting Up An Analysis Pole Zero An
- Page 235 and 236:
Hand Selection Setting Up An Analys
- Page 237 and 238:
Setting Up An Analysis Transfer Fun
- Page 239 and 240:
Setting Up An Analysis Noise Analys
- Page 241 and 242:
Setting Up An Analysis Transient No
- Page 243 and 244:
Transient Noise Analysis Principles
- Page 245 and 246:
Setting Up An Analysis Transient No
- Page 247 and 248:
Setting Up An Analysis Transient No
- Page 249 and 250:
Setting Up An Analysis Transient No
- Page 251 and 252:
Setting Up An Analysis Transient No
- Page 253 and 254:
Figure 6-10. PSD of a Flicker Noise
- Page 255 and 256:
Setting Up An Analysis Transient No
- Page 257 and 258:
Setting Up An Analysis Transient No
- Page 259 and 260:
Setting Up An Analysis Transient No
- Page 261 and 262:
o Setting Up An Analysis Transient
- Page 263 and 264:
Setting Up An Analysis Transient No
- Page 265 and 266:
Setting Up An Analysis Statistical
- Page 267 and 268:
Setting Up An Analysis Worst Case A
- Page 269 and 270:
Setting Up An Analysis DC Mismatch
- Page 271 and 272:
Setting Up An Analysis DC Sensitivi
- Page 273 and 274:
AC Sensitivity Analysis Results Set
- Page 275 and 276:
Design of Experiments Analysis Resu
- Page 277 and 278:
Setting Up An Analysis Aging and Re
- Page 279 and 280:
High Impedance Node Check Setting U
- Page 281 and 282:
Results Setting Up An Analysis View
- Page 283 and 284:
Setting Up An Analysis RF Analyses
- Page 285 and 286:
Setting Up An Analysis RF Analyses
- Page 287 and 288:
Chapter 7 Running Parametric Analys
- Page 289 and 290:
Running Parametric Analyses Tempera
- Page 291 and 292:
Running Parametric Analyses Assigni
- Page 293 and 294:
Running Parametric Analyses .STEP S
- Page 295 and 296:
Running Parametric Analyses Nested
- Page 297 and 298:
Running Parametric Analyses .DATA P
- Page 299 and 300:
Running Parametric Analyses Removin
- Page 301 and 302:
Running Parametric Analyses .ALTER
- Page 303 and 304:
Running Parametric Analyses Using O
- Page 305 and 306:
Chapter 8 Specifying Simulation Out
- Page 307 and 308:
Specifying Simulation Output Output
- Page 309 and 310:
Specifying Simulation Output Types
- Page 311 and 312:
Examples of Wildcard Usage in Subci
- Page 313 and 314:
See Also • .PLOT command in the E
- Page 315 and 316:
Compound Waveforms Specifying Simul
- Page 317 and 318:
Specifying Simulation Output Tabula
- Page 319 and 320:
Specifying Simulation Output Dynami
- Page 321 and 322:
Specifying Simulation Output Extrac
- Page 323 and 324:
Specifying Simulation Output Plot a
- Page 325 and 326:
Specifying Simulation Output Extrac
- Page 327 and 328:
Specifying Simulation Output Extrac
- Page 329 and 330:
Specifying Simulation Output Extrac
- Page 331 and 332:
3. Right-click on the sweep paramet
- Page 333 and 334:
Specifying Simulation Output Extrac
- Page 335 and 336:
Specifying Simulation Output Extrac
- Page 337 and 338:
Specifying Simulation Output Exampl
- Page 339 and 340:
Specifying Simulation Output Exampl
- Page 341 and 342:
Safe Operating Area (SOA) Checks Sp
- Page 343 and 344:
Specifying Simulation Output Plotti
- Page 345 and 346:
See Also • .CHECKSOA in the Eldo
- Page 347 and 348:
Specifying Simulation Output Safe O
- Page 349 and 350:
Specifying Simulation Output High I
- Page 351 and 352:
Specifying Simulation Output High I
- Page 353 and 354:
• .OPTION PRINT_OPTION=0 (in the
- Page 355 and 356:
Specifying Simulation Output Increm
- Page 357 and 358:
Chapter 9 Analyzing Simulation Resu
- Page 359 and 360:
File Extension Table 9-1. Eldo Stan
- Page 361 and 362:
File Extension _csdf.trX _csdf.acX
- Page 363 and 364:
Interpreting the Output Log (.chi)
- Page 365 and 366:
Analyzing Simulation Results Simula
- Page 367 and 368:
Analyzing Simulation Results Simula
- Page 369 and 370:
Analyzing Simulation Results Error
- Page 371 and 372:
Analyzing Simulation Results EZwave
- Page 373 and 374:
Related Topics EZwave Joint Wavefor
- Page 375 and 376:
Analyzing Simulation Results Marchi
- Page 377 and 378:
Analyzing Simulation Results Diagno
- Page 379 and 380:
Analyzing Simulation Results Non-Co
- Page 381 and 382:
Nodes/Devices Impacting Time-Step A
- Page 383 and 384:
Analyzing Simulation Results Perfor
- Page 385 and 386:
Analyzing Simulation Results Using
- Page 387 and 388:
Analyzing Simulation Results Statis
- Page 389 and 390:
Chapter 10 Post-Layout Simulation T
- Page 391 and 392:
Post-Layout Simulation Post-Layout
- Page 393 and 394:
Post-Layout Simulation DSPF File St
- Page 395 and 396:
o ii. iii. Post-Layout Simulation E
- Page 397 and 398:
Connecting a Source to a DSPF Backa
- Page 399 and 400:
SPEF File Structure Post-Layout Sim
- Page 401 and 402:
SPEF File Example for Corners Post-
- Page 403 and 404:
Post-Layout Simulation Eldo Reducti
- Page 405 and 406:
Post-Layout Simulation Reduction Ou
- Page 407 and 408:
Post-Layout Simulation Reduction Re
- Page 409 and 410:
Chapter 11 Monte Carlo Analysis Mon
- Page 411 and 412:
Introduction to Monte Carlo Analysi
- Page 413 and 414:
Monte Carlo Analysis Introduction t
- Page 415 and 416:
The Monte Carlo Flow Monte Carlo An
- Page 417 and 418:
Monte Carlo Analysis Monte Carlo Ba
- Page 419 and 420:
Monte Carlo Analysis Monte Carlo Ba
- Page 421 and 422:
Monte Carlo Analysis Specifying a M
- Page 423 and 424:
Monte Carlo Analysis Statistical Va
- Page 425 and 426:
Monte Carlo Analysis Specifying Sta
- Page 427 and 428:
Specifying Statistical Parameters M
- Page 429 and 430:
Controlling Statistical Parameter V
- Page 431 and 432:
How to Specify a Distribution Funct
- Page 433 and 434:
Gaussian or Normal Distribution Mon
- Page 435 and 436:
User-defined Distribution Monte Car
- Page 437 and 438:
Monte Carlo Analysis Correlation Be
- Page 439 and 440:
Monte Carlo Analysis Correlation Be
- Page 441 and 442:
Monte Carlo Analysis Correlation Be
- Page 443 and 444:
Monte Carlo Analysis Local and Glob
- Page 445 and 446: Monte Carlo Analysis Specifying Sta
- Page 447 and 448: Monte Carlo Analysis Tolerance Sett
- Page 449 and 450: Examples Monte Carlo Analysis Toler
- Page 451 and 452: Monte Carlo Analysis Sampling Plan
- Page 453 and 454: Monte Carlo Analysis Importance Sam
- Page 455 and 456: Monte Carlo Analysis Importance Sam
- Page 457 and 458: Monte Carlo Analysis Latin Hypercub
- Page 459 and 460: Monte Carlo Analysis Model-Based Mo
- Page 461 and 462: Monte Carlo Analysis Model-Based Mo
- Page 463 and 464: Monte Carlo Analysis Post-Analysis
- Page 465 and 466: Monte Carlo Analysis Output of Unce
- Page 467 and 468: • MCCORR(LABEL_EXT1,LABEL_EXT2) M
- Page 469 and 470: Extracts the total number of Monte
- Page 471 and 472: Monte Carlo Analysis Output of Unce
- Page 473 and 474: Monte Carlo Analysis Primary Statis
- Page 475 and 476: Monte Carlo Analysis Primary Statis
- Page 477 and 478: Monte Carlo Analysis Primary Statis
- Page 479 and 480: Monte Carlo Analysis Primary Statis
- Page 481 and 482: Monte Carlo Analysis Primary Statis
- Page 483 and 484: Monte Carlo Analysis Primary Statis
- Page 485 and 486: Approximations of the CDF Monte Car
- Page 487 and 488: Monte Carlo Analysis Primary Statis
- Page 489 and 490: Monte Carlo Analysis Primary Statis
- Page 491 and 492: Monte Carlo Analysis Additional Unc
- Page 493 and 494: Monte Carlo Analysis Additional Unc
- Page 495: Monte Carlo Analysis Additional Unc
- Page 499 and 500: Monte Carlo Analysis Additional Unc
- Page 501 and 502: Monte Carlo Analysis Additional Unc
- Page 503 and 504: Monte Carlo Analysis Additional Unc
- Page 505 and 506: Monte Carlo Analysis Input/Output S
- Page 507 and 508: Monte Carlo Analysis Input/Output S
- Page 509 and 510: Monte Carlo Analysis Graphical Outp
- Page 511 and 512: Monte Carlo Analysis Graphical Outp
- Page 513 and 514: Monte Carlo Analysis Graphical Outp
- Page 515 and 516: Stopping Test for AVG Monte Carlo A
- Page 517 and 518: Monte Carlo Analysis SETTLING Techn
- Page 519 and 520: Monte Carlo Analysis MCCONV Extract
- Page 521 and 522: Monte Carlo Analysis Global Sensiti
- Page 523 and 524: Monte Carlo Analysis Large Scale Va
- Page 525 and 526: Monte Carlo Analysis Large Scale Va
- Page 527 and 528: Figure 11-21. Monte Carlo Analysis
- Page 529 and 530: Monte Carlo Analysis Importance Sam
- Page 531 and 532: Monte Carlo Analysis Importance Sam
- Page 533 and 534: Monte Carlo Analysis Model-Based Ap
- Page 535 and 536: Monte Carlo Analysis Further Exampl
- Page 537 and 538: Monte Carlo Analysis Parameter Nami
- Page 539 and 540: Five independent random variables w
- Page 541 and 542: Monte Carlo Analysis Parameter Nami
- Page 543 and 544: Monte Carlo Analysis Parameter Nami
- Page 545 and 546: Monte Carlo Analysis Problems in St
- Page 547 and 548:
Monte Carlo Analysis Problems in St
- Page 549 and 550:
Figure 11-22. LIMIT Distribution wi
- Page 551 and 552:
Figure 11-23. Four Random Samples f
- Page 553 and 554:
Monte Carlo Analysis Obsolete Featu
- Page 555 and 556:
Chapter 12 Statistical Experimental
- Page 557 and 558:
Statistical Experimental Design and
- Page 559 and 560:
Statistical Modeling for Discrete C
- Page 561 and 562:
Statistical Experimental Design and
- Page 563 and 564:
Statistical Experimental Design and
- Page 565 and 566:
Statistical Experimental Design and
- Page 567 and 568:
Statistical Experimental Design and
- Page 569 and 570:
Statistical Experimental Design and
- Page 571 and 572:
Statistical Experimental Design and
- Page 573 and 574:
Conducting a Screening Experiment G
- Page 575 and 576:
Statistical Experimental Design and
- Page 577 and 578:
Statistical Experimental Design and
- Page 579 and 580:
Statistical Experimental Design and
- Page 581 and 582:
Statistical Experimental Design and
- Page 583 and 584:
Statistical Experimental Design and
- Page 585 and 586:
Statistical Experimental Design and
- Page 587 and 588:
Chapter 13 Optimization The purpose
- Page 589 and 590:
Optimization Optimization in Eldo O
- Page 591 and 592:
Optimization Optimization Options .
- Page 593 and 594:
Table 13-1. Eldo Optimization Metho
- Page 595 and 596:
Figure 13-2. Discretization of Desi
- Page 597 and 598:
Optimization Specifying Tracking wi
- Page 599 and 600:
Optimization Scaling Design Variabl
- Page 601 and 602:
Optimization Scaling Design Variabl
- Page 603 and 604:
Optimization Design Objectives Desi
- Page 605 and 606:
Scalar Design Objectives Optimizati
- Page 607 and 608:
Optimization Specifying Design Obje
- Page 609 and 610:
Notes Optimization Specifying Desig
- Page 611 and 612:
Optimization Types of Design Object
- Page 613 and 614:
Optimization Types of Design Object
- Page 615 and 616:
Optimization Types of Design Object
- Page 617 and 618:
Optimization Types of Design Object
- Page 619 and 620:
Optimization Design Objectives for
- Page 621 and 622:
Optimization Scaling Design Objecti
- Page 623 and 624:
Optimization Eldo Optimizer SQP Alg
- Page 625 and 626:
Figure 13-3. Illustration of Optima
- Page 627 and 628:
Optimization Eldo Optimizer/Search
- Page 629 and 630:
Conducting an Eldo Optimization Opt
- Page 631 and 632:
Smooth and Non-Smooth Problems Opti
- Page 633 and 634:
Optimization of Sweep Simulations O
- Page 635 and 636:
Optimization Optimization of Sweep
- Page 637 and 638:
Optimization Optimization of Sweep
- Page 639 and 640:
Optimization Post-Analysis of Optim
- Page 641 and 642:
Optimization Explicitly Declaring R
- Page 643 and 644:
Optimization ASCII Optimization Fil
- Page 645 and 646:
Optimization ASCII Optimization Fil
- Page 647 and 648:
Optimization ASCII Optimization Fil
- Page 649 and 650:
o o Goal Value — Goal value of th
- Page 651 and 652:
Optimization ASCII Optimization Fil
- Page 653 and 654:
Optimization Monitoring Design Obje
- Page 655 and 656:
Optimization Monitoring Design Obje
- Page 657 and 658:
Code Table 13-3. Optimization Resul
- Page 659 and 660:
Optimization Normal and Elastic Mod
- Page 661 and 662:
Optimization Normal and Elastic Mod
- Page 663 and 664:
Optimization Normal and Elastic Mod
- Page 665 and 666:
Optimization Designing a Low Noise
- Page 667 and 668:
Optimization Designing a Low Noise
- Page 669 and 670:
Optimization Designing a Low Noise
- Page 671 and 672:
Optimization Fourband Filter Optimi
- Page 673 and 674:
Optimization Fourband Filter Optimi
- Page 675 and 676:
Optimization MOS Characterization R
- Page 677 and 678:
Optimization Robust Optimization Us
- Page 679 and 680:
Optimization Robust Optimization Us
- Page 681 and 682:
Optimization Setup Time Computation
- Page 683 and 684:
Chapter 14 Working with S, Y, Z Par
- Page 685 and 686:
Working with S, Y, Z Parameters S,
- Page 687 and 688:
The default mixed-mode can be set u
- Page 689 and 690:
Working with S, Y, Z Parameters Out
- Page 691 and 692:
Working with S, Y, Z Parameters Sim
- Page 693 and 694:
Working with S, Y, Z Parameters Tec
- Page 695 and 696:
Working with S, Y, Z Parameters Imp
- Page 697 and 698:
• Simulation of passive networks
- Page 699 and 700:
Working with S, Y, Z Parameters Ins
- Page 701 and 702:
Working with S, Y, Z Parameters Ins
- Page 703 and 704:
Working with S, Y, Z Parameters Ins
- Page 705 and 706:
Working with S, Y, Z Parameters Tou
- Page 707 and 708:
Working with S, Y, Z Parameters Tou
- Page 709 and 710:
VAR_LIST_BEGIN / VAR_LIST_END SEG_L
- Page 711 and 712:
Working with S, Y, Z Parameters Ins
- Page 713 and 714:
Chapter 15 Aging and Reliability Si
- Page 715 and 716:
Chapter 16 Electrothermal Simulatio
- Page 717 and 718:
Electrothermal Simulation Specifyin
- Page 719 and 720:
Electrothermal Simulation Specifyin
- Page 721 and 722:
The .TEMPNODE statement can also be
- Page 723 and 724:
Electrothermal Simulation Reporting
- Page 725 and 726:
Electrothermal Simulation Electroth
- Page 727 and 728:
Chapter 17 IBIS Models Support in E
- Page 729 and 730:
IBIS Models Support in Eldo IBIS Re
- Page 731 and 732:
IBIS Models Support in Eldo Checkin
- Page 733 and 734:
IBIS Models Support in Eldo Buffers
- Page 735 and 736:
IBIS Models Support in Eldo Buffers
- Page 737 and 738:
Figure 17-3. Output Buffer Model Bu
- Page 739 and 740:
Figure 17-5. 3_state Buffer Model B
- Page 741 and 742:
IBIS Models Support in Eldo Buffers
- Page 743 and 744:
IBIS Models Support in Eldo Buffers
- Page 745 and 746:
IBIS Models Support in Eldo Compone
- Page 747 and 748:
IBIS Models Support in Eldo Compone
- Page 749 and 750:
IBIS Models Support in Eldo IBIS Su
- Page 751 and 752:
IBIS Models Support in Eldo IBIS Mo
- Page 753 and 754:
IBIS Models Support in Eldo IBIS Bu
- Page 755 and 756:
IBIS Models Support in Eldo IBIS Bu
- Page 757 and 758:
IBIS Models Support in Eldo IBIS Bu
- Page 759 and 760:
IBIS Models Support in Eldo IBIS Bu
- Page 761 and 762:
IBIS Models Support in Eldo IBIS Bu
- Page 763 and 764:
IBIS Models Support in Eldo IBIS Bu
- Page 765 and 766:
IBIS Component Instantiates an IBIS
- Page 767 and 768:
IBIS Models Support in Eldo IBIS Co
- Page 769 and 770:
IBIS Models Support in Eldo IBIS Co
- Page 771 and 772:
IBIS Models Support in Eldo IBIS Co
- Page 773 and 774:
IBIS Models Support in Eldo IBIS Pa
- Page 775 and 776:
IBIS Models Support in Eldo IBIS Pa
- Page 777 and 778:
IBIS Electrical Board Description I
- Page 779 and 780:
IBIS Models Support in Eldo IBIS El
- Page 781 and 782:
IBIS Models Support in Eldo Support
- Page 783 and 784:
D_overshoot_ampl_l 5.0 [Rgnd] 2.1 [
- Page 785 and 786:
a_pos 4.1 a_neg 4.1 a_signal_pos 4.
- Page 787 and 788:
IBIS Algorithmic Model Interface (A
- Page 789 and 790:
IBIS Models Support in Eldo IBIS Al
- Page 791 and 792:
IBIS Models Support in Eldo Example
- Page 793 and 794:
IBIS Models Support in Eldo Example
- Page 795 and 796:
IBIS Models Support in Eldo Example
- Page 797 and 798:
IBIS Models Support in Eldo Example
- Page 799 and 800:
IBIS Models Support in Eldo Example
- Page 801 and 802:
Chapter 18 Eldo Control Language Th
- Page 803 and 804:
Eldo Control Language Examples Eldo
- Page 805 and 806:
Example Dir 22-plot_mos_ operating_
- Page 807 and 808:
Eldo Control Language Eldo Control
- Page 809 and 810:
Eldo Control Language Testbenches T
- Page 811 and 812:
Eldo Control Language Testbench Ins
- Page 813 and 814:
Eldo Control Language Rules for Tes
- Page 815 and 816:
Eldo Control Language Task Definiti
- Page 817 and 818:
Eldo Control Language Task Instanti
- Page 819 and 820:
Eldo Control Language Task Instanti
- Page 821 and 822:
Eldo Control Language Statement Ove
- Page 823 and 824:
Once assigned an initial value, var
- Page 825 and 826:
Eldo Control Language Statement Ove
- Page 827 and 828:
Eldo Control Language Statement Ove
- Page 829 and 830:
Eldo Control Language Statement Ove
- Page 831 and 832:
Eldo Control Language Statement Ove
- Page 833 and 834:
Eldo Control Language Statement Ove
- Page 835 and 836:
Eldo Control Language Statement Ove
- Page 837 and 838:
Eldo Control Language Statement Ove
- Page 839 and 840:
Eldo Control Language Functions For
- Page 841 and 842:
Defining and Running Simulations El
- Page 843 and 844:
Eldo Control Language Defining and
- Page 845 and 846:
Eldo Control Language Defining and
- Page 847 and 848:
Eldo Control Language Defining and
- Page 849 and 850:
Eldo Control Language Defining and
- Page 851 and 852:
Eldo Control Language Defining and
- Page 853 and 854:
Eldo Control Language Defining and
- Page 855 and 856:
Command compoundcontent conj cos co
- Page 857 and 858:
Eldo Control Language Library of Fu
- Page 859 and 860:
Command system tan tanh trunc var w
- Page 861 and 862:
Eldo Control Language Library of Fu
- Page 863 and 864:
Eldo Control Language Library of Fu
- Page 865 and 866:
Eldo Control Language Library of Fu
- Page 867 and 868:
Eldo Control Language Library of Fu
- Page 869 and 870:
Eldo Control Language Library of Fu
- Page 871 and 872:
Eldo Control Language Library of Fu
- Page 873 and 874:
Eldo Control Language Library of Fu
- Page 875 and 876:
Eldo Control Language Library of Fu
- Page 877 and 878:
Eldo Control Language Library of Fu
- Page 879 and 880:
Eldo Control Language Library of Fu
- Page 881 and 882:
Eldo Control Language Library of Fu
- Page 883 and 884:
Eldo Control Language Library of Fu
- Page 885 and 886:
Eldo Control Language Library of Fu
- Page 887 and 888:
Eldo Control Language Library of Fu
- Page 889 and 890:
Eldo Control Language Library of Fu
- Page 891 and 892:
Eldo Control Language Library of Fu
- Page 893 and 894:
Eldo Control Language Library of Fu
- Page 895 and 896:
Eldo Control Language Library of Fu
- Page 897 and 898:
Eldo Control Language Library of Fu
- Page 899 and 900:
Eldo Control Language Library of Fu
- Page 901 and 902:
Eldo Control Language Library of Fu
- Page 903 and 904:
Eldo Control Language Library of Fu
- Page 905 and 906:
Eldo Control Language Library of Fu
- Page 907 and 908:
Eldo Control Language Library of Fu
- Page 909 and 910:
Examples Eldo Control Language Libr
- Page 911 and 912:
Eldo Control Language Library of Fu
- Page 913 and 914:
Eldo Control Language Library of Fu
- Page 915 and 916:
Eldo Control Language Library of Fu
- Page 917 and 918:
Eldo Control Language Library of Fu
- Page 919 and 920:
Eldo Control Language Library of Fu
- Page 921 and 922:
Eldo Control Language Library of Fu
- Page 923 and 924:
Eldo Control Language Library of Fu
- Page 925 and 926:
Eldo Control Language Library of Fu
- Page 927 and 928:
Complex Number Function Natural log
- Page 929 and 930:
Complex Number Function Decimal log
- Page 931 and 932:
Eldo Control Language Library of Fu
- Page 933 and 934:
Eldo Control Language Library of Fu
- Page 935 and 936:
Eldo Control Language Library of Fu
- Page 937 and 938:
Eldo Control Language Library of Fu
- Page 939 and 940:
Eldo Control Language Library of Fu
- Page 941 and 942:
Eldo Control Language Library of Fu
- Page 943 and 944:
Eldo Control Language Library of Fu
- Page 945 and 946:
pow_10 Task function category: Func
- Page 947 and 948:
Eldo Control Language Library of Fu
- Page 949 and 950:
Eldo Control Language Library of Fu
- Page 951 and 952:
Eldo Control Language Library of Fu
- Page 953 and 954:
Eldo Control Language Library of Fu
- Page 955 and 956:
Eldo Control Language Library of Fu
- Page 957 and 958:
Eldo Control Language Library of Fu
- Page 959 and 960:
Eldo Control Language Library of Fu
- Page 961 and 962:
Eldo Control Language Library of Fu
- Page 963 and 964:
Eldo Control Language Library of Fu
- Page 965 and 966:
Eldo Control Language Library of Fu
- Page 967 and 968:
Eldo Control Language Library of Fu
- Page 969 and 970:
Eldo Control Language Library of Fu
- Page 971 and 972:
Eldo Control Language Library of Fu
- Page 973 and 974:
Eldo Control Language Library of Fu
- Page 975 and 976:
Eldo Control Language Library of Fu
- Page 977 and 978:
Eldo Control Language Library of Fu
- Page 979 and 980:
Eldo Control Language Library of Fu
- Page 981 and 982:
Eldo Control Language Library of Fu
- Page 983 and 984:
Eldo Control Language Library of Fu
- Page 985 and 986:
Eldo Control Language Library of Fu
- Page 987 and 988:
Eldo Control Language Library of Fu
- Page 989 and 990:
Eldo Control Language Library of Fu
- Page 991 and 992:
Eldo Control Language Library of Fu
- Page 993 and 994:
Eldo Control Language Library of Fu
- Page 995 and 996:
Eldo Control Language Library of Fu
- Page 997 and 998:
Eldo Control Language Library of Fu
- Page 999 and 1000:
Eldo Control Language Library of Fu
- Page 1001 and 1002:
Eldo Control Language Library of Fu
- Page 1003 and 1004:
Eldo Control Language Library of Fu
- Page 1005 and 1006:
Eldo Control Language Library of Fu
- Page 1007 and 1008:
Eldo Control Language Library of Fu
- Page 1009 and 1010:
Eldo Control Language Library of Fu
- Page 1011 and 1012:
Eldo Control Language Library of Fu
- Page 1013 and 1014:
Eldo Control Language Library of Fu
- Page 1015 and 1016:
Eldo Control Language Simulation Dy
- Page 1017 and 1018:
Eldo Control Language Simulation Dy
- Page 1019 and 1020:
Eldo Control Language Simulation Dy
- Page 1021 and 1022:
Eldo Control Language Simulation Dy
- Page 1023 and 1024:
Eldo Control Language Simulation Dy
- Page 1025 and 1026:
Command _simu_set _simu_set_cond _s
- Page 1027 and 1028:
Eldo Control Language Extended Simu
- Page 1029 and 1030:
Eldo Control Language Extended Simu
- Page 1031 and 1032:
Eldo Control Language Extended Simu
- Page 1033 and 1034:
Eldo Control Language Extended Simu
- Page 1035 and 1036:
Eldo Control Language Extended Simu
- Page 1037 and 1038:
Eldo Control Language Extended Simu
- Page 1039 and 1040:
Eldo Control Language Parallel Oper
- Page 1041 and 1042:
Eldo Control Language Parallel Oper
- Page 1043 and 1044:
Concurrency Issues Eldo Control Lan
- Page 1045 and 1046:
Eldo Control Language Parallel Oper
- Page 1047 and 1048:
Eldo Control Language Parallel Oper
- Page 1049 and 1050:
Eldo Control Language Parallel Oper
- Page 1051 and 1052:
Eldo Control Language Parallel Oper
- Page 1053 and 1054:
Eldo Control Language Parallel Oper
- Page 1055 and 1056:
Launching ECL Simulations on Differ
- Page 1057 and 1058:
Eldo Control Language Parallel Oper
- Page 1059 and 1060:
Eldo Control Language Statistical P
- Page 1061 and 1062:
Command _simu_get_stat_param_de v _
- Page 1063 and 1064:
Eldo Control Language Statistical P
- Page 1065 and 1066:
Eldo Control Language Statistical P
- Page 1067 and 1068:
Eldo Control Language Statistical P
- Page 1069 and 1070:
Eldo Control Language Statistical P
- Page 1071 and 1072:
Eldo Control Language Statistical P
- Page 1073 and 1074:
Eldo Control Language Statistical P
- Page 1075 and 1076:
Eldo Control Language Statistical P
- Page 1077 and 1078:
Eldo Control Language Statistical P
- Page 1079 and 1080:
Eldo Control Language Statistical P
- Page 1081 and 1082:
Eldo Control Language Statistical P
- Page 1083 and 1084:
Eldo Control Language Statistical P
- Page 1085 and 1086:
Eldo Control Language Statistical P
- Page 1087 and 1088:
Eldo Control Language Statistical P
- Page 1089 and 1090:
Eldo Control Language Statistical P
- Page 1091 and 1092:
Eldo Control Language Statistical P
- Page 1093 and 1094:
Eldo Control Language Statistical P
- Page 1095 and 1096:
Eldo Control Language Statistical P
- Page 1097 and 1098:
Eldo Control Language Statistical P
- Page 1099 and 1100:
Eldo Control Language Statistical P
- Page 1101 and 1102:
Eldo Control Language Statistical P
- Page 1103 and 1104:
Eldo Control Language Statistical P
- Page 1105 and 1106:
Eldo Control Language Statistical P
- Page 1107 and 1108:
Eldo Control Language Statistical P
- Page 1109 and 1110:
Eldo Control Language Statistical P
- Page 1111 and 1112:
Eldo Control Language Statistical P
- Page 1113 and 1114:
Eldo Control Language Statistical P
- Page 1115 and 1116:
Temporary Files Eldo Control Langua
- Page 1117 and 1118:
Debug Mode Eldo Control Language Ad
- Page 1119 and 1120:
Eldo Control Language Advanced Simu
- Page 1121 and 1122:
Eldo Control Language Advanced Simu
- Page 1123 and 1124:
Eldo Control Language Examples Usin
- Page 1125 and 1126:
Eldo Control Language .EXTRACT Alte
- Page 1127 and 1128:
Eldo Control Language .PRINTFILE Al
- Page 1129 and 1130:
Eldo Control Language .PRINTFILE Al
- Page 1131 and 1132:
Eldo Control Language .OPTIMIZE Alt
- Page 1133 and 1134:
Eldo Control Language .MPRUN with M
- Page 1135 and 1136:
Chapter 19 Post-Processing Library
- Page 1137 and 1138:
Post-Processing Library Post-Proces
- Page 1139 and 1140:
Post-Processing Library General Usa
- Page 1141 and 1142:
Post-Processing Library Macro-Like
- Page 1143 and 1144:
Post-Processing Library Working wit
- Page 1145 and 1146:
Post-Processing Library evalExpr Re
- Page 1147 and 1148:
Post-Processing Library defineVec N
- Page 1149 and 1150:
Post-Processing Library EZwave Wave
- Page 1151 and 1152:
Post-Processing Library ABS ABS Eld
- Page 1153 and 1154:
Post-Processing Library ACOSH ACOSH
- Page 1155 and 1156:
Post-Processing Library ACOTH ACOTH
- Page 1157 and 1158:
Post-Processing Library ASINH ASINH
- Page 1159 and 1160:
Post-Processing Library ATANH ATANH
- Page 1161 and 1162:
Post-Processing Library COMPRESS CO
- Page 1163 and 1164:
Post-Processing Library COSH COSH E
- Page 1165 and 1166:
Post-Processing Library COTH COTH E
- Page 1167 and 1168:
Post-Processing Library DEG DEG Eld
- Page 1169 and 1170:
Post-Processing Library DERIVE DERI
- Page 1171 and 1172:
Post-Processing Library EXP EXP Eld
- Page 1173 and 1174:
Post-Processing Library GMARGIN GMA
- Page 1175 and 1176:
Post-Processing Library IMAG IMAG E
- Page 1177 and 1178:
Post-Processing Library INTEGRAL IN
- Page 1179 and 1180:
Post-Processing Library INVDB INVDB
- Page 1181 and 1182:
Post-Processing Library LOG10 LOG10
- Page 1183 and 1184:
Post-Processing Library MAX MAX Eld
- Page 1185 and 1186:
Post-Processing Library PHASE PHASE
- Page 1187 and 1188:
Post-Processing Library RAD RAD Eld
- Page 1189 and 1190:
Post-Processing Library RELATION RE
- Page 1191 and 1192:
Post-Processing Library RMS RMS Eld
- Page 1193 and 1194:
Post-Processing Library SETTLINGTIM
- Page 1195 and 1196:
Post-Processing Library SINH SINH E
- Page 1197 and 1198:
Post-Processing Library SQRT SQRT E
- Page 1199 and 1200:
Post-Processing Library TAN TAN Eld
- Page 1201 and 1202:
Post-Processing Library TPD TPD Eld
- Page 1203 and 1204:
Post-Processing Library TPDDU TPDDU
- Page 1205 and 1206:
Post-Processing Library TPDUU TPDUU
- Page 1207 and 1208:
Post-Processing Library VMIN VMIN E
- Page 1209 and 1210:
Post-Processing Library XCOMPRESS X
- Page 1211 and 1212:
Post-Processing Library XWAVE XWAVE
- Page 1213 and 1214:
Post-Processing Library IIPX IIPX E
- Page 1215 and 1216:
Post-Processing Library Built-In DS
- Page 1217 and 1218:
Post-Processing Library CONV CONV E
- Page 1219 and 1220:
Post-Processing Library CORRELO •
- Page 1221 and 1222:
Post-Processing Library CT • fmin
- Page 1223 and 1224:
Post-Processing Library FFT • nor
- Page 1225 and 1226:
Post-Processing Library HDIST HDIST
- Page 1227 and 1228:
Post-Processing Library PERIODO PER
- Page 1229 and 1230:
Post-Processing Library PSD PSD Eld
- Page 1231 and 1232:
Post-Processing Library SAMPLER 10
- Page 1233 and 1234:
Post-Processing Library Accessing W
- Page 1235 and 1236:
Post-Processing Library DISP_FILE D
- Page 1237 and 1238:
Post-Processing Library Additional
- Page 1239 and 1240:
Post-Processing Library GETSIZE GET
- Page 1241 and 1242:
Post-Processing Library SETPOINT SE
- Page 1243 and 1244:
Chapter 20 Speed and Accuracy Eldo
- Page 1245 and 1246:
Speed and Accuracy Speed and Accura
- Page 1247 and 1248:
Speed and Accuracy Integration Meth
- Page 1249 and 1250:
Speed and Accuracy Time Step Contro
- Page 1251 and 1252:
Speed and Accuracy Time Step Contro
- Page 1253 and 1254:
Speed and Accuracy Global Tuning of
- Page 1255 and 1256:
Speed and Accuracy Global Tuning of
- Page 1257 and 1258:
Speed and Accuracy Simulation of La
- Page 1259 and 1260:
Speed and Accuracy Tips for Improvi
- Page 1261 and 1262:
Speed and Accuracy IEM Overview Whe
- Page 1263 and 1264:
Speed and Accuracy IEM Tolerance Pa
- Page 1265 and 1266:
IEM Alone (.OPTION IEM) Speed and A
- Page 1267 and 1268:
Integration Method Speed and Accura
- Page 1269 and 1270:
Chapter 21 Examples The most produc
- Page 1271 and 1272:
Examples Table 21-1. Eldo Examples
- Page 1273 and 1274:
Netlist Explanation Examples Exampl
- Page 1275 and 1276:
Examples Example 2—Transient and
- Page 1277 and 1278:
Examples Example 3—AC and Noise A
- Page 1279 and 1280:
Examples Example 3—AC and Noise A
- Page 1281 and 1282:
Figure 21-8. Low Pass Filter Exampl
- Page 1283 and 1284:
Examples Example 5—Transient Anal
- Page 1285 and 1286:
Examples Example 5—Transient Anal
- Page 1287 and 1288:
Examples Example 6—Transient Anal
- Page 1289 and 1290:
Simulation Results Examples Example
- Page 1291 and 1292:
Figure 21-15. Non-inverting Amplifi
- Page 1293 and 1294:
Examples Example 8—DC Sensitivity
- Page 1295 and 1296:
Simulation Results Examples Example
- Page 1297 and 1298:
Examples Example 9—Transient and
- Page 1299 and 1300:
Examples Example 11—Loop Stabilit
- Page 1301 and 1302:
Examples Example 12—Overshoot Ext
- Page 1303 and 1304:
Simulation Results Examples Example
- Page 1305 and 1306:
Summary of Eldo commands used in th
- Page 1307 and 1308:
Examples Example 16—Transient Ana
- Page 1309 and 1310:
Simulation Results Examples Example
- Page 1311 and 1312:
Examples Example 17—Monte Carlo S
- Page 1313 and 1314:
Examples Example 17—Monte Carlo S
- Page 1315 and 1316:
Examples Example 18—Numerical Int
- Page 1317 and 1318:
Simulation Results Examples Example
- Page 1319 and 1320:
Examples Example 19—DC Mismatch C
- Page 1321 and 1322:
Examples Example 19—DC Mismatch C
- Page 1323 and 1324:
Examples Example 20—DC Mismatch C
- Page 1325 and 1326:
Examples Example 21—Post-Layout S
- Page 1327 and 1328:
Examples Example 22—Extract Gain
- Page 1329 and 1330:
Examples Example 22—Extract Gain
- Page 1331 and 1332:
Examples Example 23—Parametric Se
- Page 1333 and 1334:
Examples Example 23—Parametric Se
- Page 1335 and 1336:
Examples Example 24—Cell Characte
- Page 1337 and 1338:
Examples Example 25—Setting up an
- Page 1339 and 1340:
Examples Example 26—Spectre Compa
- Page 1341 and 1342:
Examples Example 27—Monte Carlo A
- Page 1343 and 1344:
Examples Tutorial—Using Power Ana
- Page 1345 and 1346:
Examples Tutorial—Using Power Ana
- Page 1347 and 1348:
Examples Tutorial—Using Power Ana
- Page 1349 and 1350:
Examples Tutorial—Using Power Ana
- Page 1351 and 1352:
Examples Tutorial—Using Power Ana
- Page 1353 and 1354:
Examples Tutorial—Using Power Ana
- Page 1355 and 1356:
Examples Tutorial—Using Power Ana
- Page 1357 and 1358:
Examples Tutorial—Using Power Ana
- Page 1359 and 1360:
Examples Tutorial—High Impedance
- Page 1361 and 1362:
Examples Tutorial—High Impedance
- Page 1363 and 1364:
Examples Tutorial—High Impedance
- Page 1365 and 1366:
Examples Tutorial—High Impedance
- Page 1367 and 1368:
Examples Tutorial—High Impedance
- Page 1369 and 1370:
Examples Transient Noise Analysis E
- Page 1371 and 1372:
Examples Transient Noise Analysis E
- Page 1373 and 1374:
Examples Transient Noise Analysis E
- Page 1375 and 1376:
Examples Transient Noise Analysis E
- Page 1377 and 1378:
Examples Transient Noise Analysis E
- Page 1379 and 1380:
Appendix A Error and Warning Messag
- Page 1381 and 1382:
Error Number Description Table A-1.
- Page 1383 and 1384:
Error and Warning Messages Global E
- Page 1385 and 1386:
Error Number Description Table A-2.
- Page 1387 and 1388:
Error and Warning Messages Errors R
- Page 1389 and 1390:
Error Number Description Table A-3.
- Page 1391 and 1392:
Error Number Description Table A-3.
- Page 1393 and 1394:
Error and Warning Messages Errors R
- Page 1395 and 1396:
Error Number Table A-4. Errors Rela
- Page 1397 and 1398:
Error and Warning Messages Errors R
- Page 1399 and 1400:
Error and Warning Messages Errors R
- Page 1401 and 1402:
Error Number Description Table A-5.
- Page 1403 and 1404:
Error and Warning Messages Miscella
- Page 1405 and 1406:
Error and Warning Messages Miscella
- Page 1407 and 1408:
Error and Warning Messages Miscella
- Page 1409 and 1410:
Error and Warning Messages Errors R
- Page 1411 and 1412:
Error and Warning Messages Warning
- Page 1413 and 1414:
Error and Warning Messages Global W
- Page 1415 and 1416:
Error and Warning Messages Warnings
- Page 1417 and 1418:
Warning Number Table A-11. Warnings
- Page 1419 and 1420:
Error and Warning Messages Warnings
- Page 1421 and 1422:
Error and Warning Messages Warnings
- Page 1423 and 1424:
Error and Warning Messages Warnings
- Page 1425 and 1426:
Error and Warning Messages Warnings
- Page 1427 and 1428:
Error and Warning Messages Warnings
- Page 1429 and 1430:
Warning Number Table A-14. Warnings
- Page 1431 and 1432:
Warnings Related to Subcircuits The
- Page 1433 and 1434:
Error and Warning Messages Miscella
- Page 1435 and 1436:
Warning Number Table A-16. Miscella
- Page 1437 and 1438:
Error and Warning Messages Miscella
- Page 1439 and 1440:
Warning Number Table A-16. Miscella
- Page 1441 and 1442:
Warning Number Table A-16. Miscella
- Page 1443 and 1444:
Warning Number Table A-16. Miscella
- Page 1445 and 1446:
Warning Number Table A-16. Miscella
- Page 1447 and 1448:
Error and Warning Messages Miscella
- Page 1449 and 1450:
Error and Warning Messages Miscella
- Page 1451 and 1452:
Warning Number Warning 1021092 Warn
- Page 1453 and 1454:
Appendix B Troubleshooting Most use
- Page 1455 and 1456:
Troubleshooting File Troubleshootin
- Page 1457 and 1458:
Appendix C Eldo Interactive Mode El
- Page 1459 and 1460:
Eldo Interactive Mode Reading Infor
- Page 1461 and 1462:
Command [.]LSMODEV LSMODPAR [.]LS
- Page 1463 and 1464:
Eldo Interactive Mode Change Featur
- Page 1465 and 1466:
Eldo Interactive Mode Change Featur
- Page 1467 and 1468:
STOP IF Eldo Interactive Mode Cont
- Page 1469 and 1470:
Appendix D Eldo Conversion Utilitie
- Page 1471 and 1472:
Eldo Conversion Utilities Utility t
- Page 1473 and 1474:
Eldo Conversion Utilities Utility t
- Page 1475 and 1476:
Eldo Conversion Utilities Utility t
- Page 1477 and 1478:
Appendix E STMicroelectronics Model
- Page 1479 and 1480:
STMicroelectronics Models What Does
- Page 1481 and 1482:
Css Css Csb Csb Csb+CJSB Cbd Cdbd C
- Page 1483 and 1484:
Index — Symbols — ! comment del
- Page 1485 and 1486:
PWL_LIN(), 111 PWR(VAL1, VAL2), 110
- Page 1487 and 1488:
32-bit and 64-bit modes, 42 An Intr
- Page 1489 and 1490:
LIMIT function, 110 Limiting Output
- Page 1491 and 1492:
DSPF backannotation, 392 Examples,
- Page 1493 and 1494:
Noise Model, 1373 Syntax Errors, 36
- Page 1495 and 1496:
Third-Party Information This sectio
- Page 1497 and 1498:
3. The name of the author may not b
- Page 1499 and 1500:
USE, DATA, OR PROFITS; OR BUSINESS
- Page 1503 and 1504:
End-User License Agreement The late
- Page 1505 and 1506:
7.1. Mentor Graphics warrants that
Inappropriate
Loading...
Inappropriate
You have already flagged this document.
Thank you, for helping us keep this platform clean.
The editors will have a look at it as soon as possible.
Mail this publication
Loading...
Embed
Loading...
Delete template?
Are you sure you want to delete your template?
DOWNLOAD ePAPER
This ePaper is currently not available for download.
You can find similar magazines on this topic below under ‘Recommendations’.