
Create successful ePaper yourself
Turn your PDF publications into a flip-book with our unique Google optimized e-Paper software.
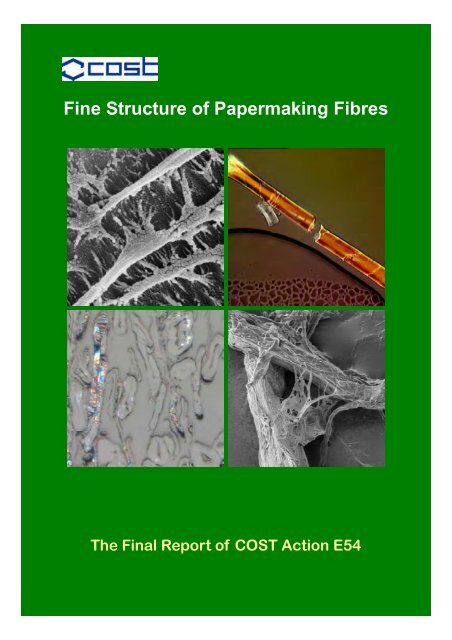
<strong>Fine</strong> <strong>Structure</strong> <strong>of</strong> <strong>Papermaking</strong> <strong>Fibres</strong><br />
Th The Final Fi l Report R t <strong>of</strong> f COST Action A ti E54
<strong>Fine</strong> <strong>Structure</strong> <strong>of</strong> <strong>Papermaking</strong> <strong>Fibres</strong><br />
COST Action E54 “Characterisation <strong>of</strong> the fine structure<br />
and properties <strong>of</strong> papermaking fibres using new<br />
technologies”<br />
Edited by:<br />
P. Ander, W. Bauer, S. Heinemann,<br />
P. Kallio, R. Passas, A. Treimanis<br />
ESF provides the COST Office through an EC contract<br />
COST is supported by the EU RTD Framework programme
COST- the acronym for European Cooperation in Science and Technology - is the oldest and widest<br />
European intergovernmental network for cooperation in research. Established by the Ministerial<br />
Conference in November 1971, COST is presently used by the scientific communities <strong>of</strong> 36 European<br />
countries to cooperate in common research projects supported by national funds.<br />
The funds provided by COST - less than 1% <strong>of</strong> the total value <strong>of</strong> the projects - support the COST<br />
cooperation networks (COST Actions) through which, with EUR 30 million per year, more than 30 000<br />
European scientists are involved in research having a total value which exceeds EUR 2 billion per year.<br />
This is the financial worth <strong>of</strong> the European added value which COST achieves.<br />
A "bottom up approach" (the initiative <strong>of</strong> launching a COST Action comes from the European scientists<br />
themselves), "à la carte participation" (only countries interested in the Action participate), "equality <strong>of</strong><br />
access" (participation is open also to the scientific communities <strong>of</strong> countries not belonging to the<br />
European Union) and "flexible structure" (easy implementation and light management <strong>of</strong> the research<br />
initiatives) are the main characteristics <strong>of</strong> COST.<br />
As precursor <strong>of</strong> advanced multidisciplinary research COST has a very important role for the realisation <strong>of</strong><br />
the European Research Area (ERA) anticipating and complementing the activities <strong>of</strong> the Framework<br />
Programmes, constituting a "bridge" towards the scientific communities <strong>of</strong> emerging countries, increasing<br />
the mobility <strong>of</strong> researchers across Europe and fostering the establishment <strong>of</strong> "Networks <strong>of</strong> Excellence" in<br />
many key scientific domains such as: Biomedicine and Molecular Biosciences; Food and Agriculture;<br />
Forests, their Products and Services; Materials, Physical and Nanosciences; Chemistry and Molecular<br />
Sciences and Technologies; Earth System Science and Environmental Management; Information and<br />
Communication Technologies; Transport and Urban Development; Individuals, Societies, Cultures and<br />
Health. It covers basic and more applied research and also addresses issues <strong>of</strong> pre-normative nature or<br />
<strong>of</strong> societal importance.<br />
Web: http://www.cost.eu<br />
This publication is supported by COST<br />
Scientific Officer: Melae Langbein, Avenue Louise 149, B-1050 Brussels<br />
Publisher: COST Office, Avenue Louise 149, B-1050 Brussels, Belgium<br />
Printer: Swedish University <strong>of</strong> Agricultural Sciences, SLU Service/Repro, Uppsala 2011<br />
Book title: <strong>Fine</strong> <strong>Structure</strong> <strong>of</strong> <strong>Papermaking</strong> <strong>Fibres</strong><br />
ISBN: 978-91-576-9007-4 (Swedish University <strong>of</strong> Agricultural Sciences, Uppsala, Sweden)<br />
©COST Office 2011<br />
No permission to reproduce or utilize the contents <strong>of</strong> this book by any means is necessary, other than in<br />
the case <strong>of</strong> images, diagrammes or other material from other copyright holders. In such cases,<br />
permission <strong>of</strong> the copyright holders is required. This book may be cited as: COST Action E54 <strong>Fine</strong><br />
<strong>Structure</strong> <strong>of</strong> <strong>Papermaking</strong> <strong>Fibres</strong> 2011.<br />
Legal Notice<br />
Neither the COST Office nor any person acting on its behalf is responsible for the use which might be<br />
made <strong>of</strong> information contained in this publication. The COST Office is not responsible for the external<br />
websites refereed to in this publication.<br />
2
COST Action E54 Book<br />
PREFACE<br />
This book contains important results <strong>of</strong> COST Action E54 “Characterisation <strong>of</strong> the fine<br />
structure and properties <strong>of</strong> papermaking fibres using new technologies”. For the COST Book<br />
front page the shorter title “<strong>Fine</strong> <strong>Structure</strong> <strong>of</strong> <strong>Papermaking</strong> <strong>Fibres</strong>” was also adopted.<br />
The Action started on 18 December 2006, and it has continued for four years.<br />
The main objective <strong>of</strong> the Action E54 was to generate new knowledge on the micro- and<br />
nanostructure <strong>of</strong> papermaking fibres and relevant properties required for the efficient and<br />
sustainable use <strong>of</strong> fibres in traditional, advanced and future products. I am confident that this<br />
objective <strong>of</strong> the Action has been met, and the contents <strong>of</strong> the book will serve as evidence for<br />
that.<br />
Action E54 comprised three working groups:<br />
WG1: <strong>Structure</strong> and chemical composition <strong>of</strong> papermaking fibres after different types <strong>of</strong><br />
treatment. The objectives <strong>of</strong> the activities <strong>of</strong> this WG were to develop methods for the<br />
characterisation <strong>of</strong> pulp fibres, and to generate and accumulate new data on the fine structure <strong>of</strong><br />
fibres for papermaking, and other important purposes.<br />
WG2: Treatment and characterisation <strong>of</strong> individual fibres by microsystem technologies.<br />
This WG focused on the development <strong>of</strong> new instruments, namely, microrobotic platforms, by<br />
which individual fibres can be treated and investigated. Using these platforms new possibilities<br />
for testing <strong>of</strong> single fibres have been created.<br />
WG3: The impact <strong>of</strong> the fine structure <strong>of</strong> fibres on their papermaking properties and their<br />
chemical and enzymatic reactivity. The participants <strong>of</strong> the WG exchanged their experience<br />
with respect to the impact <strong>of</strong> the fine structure <strong>of</strong> fibres and their modification on the quality<br />
parameters <strong>of</strong> the paper and handsheets produced there<strong>of</strong>. The fibre and paper properties were<br />
assessed mainly by strength and optical indices as well as interfibre bonding.<br />
Tight links among the three working groups have been established and maintained during the<br />
whole lifetime <strong>of</strong> the Action.<br />
A total <strong>of</strong> 10 joint Management Committee/Working Groups meetings have been organised in<br />
Brussels and other cities. The following seven scientific workshops have been held: Riga (2007),<br />
Graz and Budapest (2008), Tampere and Grenoble (2009), Coimbra (2010) as well as in<br />
Cambridge (2011). Every time abstracts and/or proceedings were printed. From these meetings<br />
pdf-files have also been stored at http://gmail.com and are available by the Action members<br />
using a special username and password. The Latvian website www.kki.lv/cost can also be<br />
consulted for general information.<br />
More than 100 researchers and industrialists participated in the workshops <strong>of</strong> COST Action E54,<br />
while the “core group” consists <strong>of</strong> some 40 scientists. They are authors <strong>of</strong> the articles in this<br />
book which is composed <strong>of</strong> the following three chapters:<br />
The first chapter “Advanced analyses <strong>of</strong> wood pulp fibres” is devoted to the analytical methods,<br />
both chemical and instrumental ones, which have been largely developed during the four years<br />
<strong>of</strong> the Action. For example, different methods for fibre-fibre bonded area measurement have<br />
been elaborated. Several articles reflect the results from newly established networking<br />
connections between researchers from Sweden and Austria, Latvia and Austria, France,<br />
Germany and Finland, etc. One fascinating paper reports on new insights into the architecture <strong>of</strong><br />
3
COST Action E54 Book<br />
wood cell walls, while another one discuss about possibilities for production and application <strong>of</strong><br />
cellulose nan<strong>of</strong>ibrils.<br />
The second chapter “New and emerging methods such as microrobotics and microscopic<br />
techniques” contains articles related mostly to the applications <strong>of</strong> microsystem technologies,<br />
which actually for the first time ever are widely used in the area <strong>of</strong> papermaking fibre research.<br />
The chapter discusses novel microrobotic based methods for the manipulation and mechanical<br />
characterisation <strong>of</strong> individual pulp fibres. New results on the application <strong>of</strong> microscopic<br />
techniques for studying fibre cross sections using serial sectioning techniques are also published.<br />
The third chapter is called “Results <strong>of</strong> standard pulp and paper tests on Common pulps I and<br />
II and other fibre material”. The participants <strong>of</strong> the Action agreed to investigate common<br />
unbleached and bleached Kraft pulp fibre samples using a great number <strong>of</strong> standard tests widely<br />
applied in the European pulp and paper industry. The data provide extended knowledge on the<br />
quality and properties <strong>of</strong> the investigated Common Pulp samples not obtained before.<br />
Thus, the book is primarily for chemists, physicists, biologists and technologists working with<br />
papermaking fibres. I do hope that the book will prove useful also for undergraduate and<br />
graduate students. Short Term Scientific Missions are not described separately but included in<br />
the respective articles.<br />
Concluding this part <strong>of</strong> the book, I would like to mention and to thank Vice Chairmen <strong>of</strong> the<br />
Action Pasi Kallio and Raphael Passas, as well as WG leaders Tomas Larsson and Paul Ander<br />
(WG1), Jean-Marc Breguet and Sabine Heinemann (WG2), Eero Hiltunen and Wolfgang Bauer<br />
(WG3). Thanks a lot to the authors <strong>of</strong> the scientific papers, active participants <strong>of</strong> the COST<br />
Action E54. Last, but not least, I am very grateful to Drs Paul Ander and Sabine Heinemann who<br />
took the overall responsibility for collecting the papers and arranging the printing <strong>of</strong> the book.<br />
General information on COST is available at http://www.cost.eu while on the COST website:<br />
http://www.cost.eu/domains_actions/fps/Actions/<strong>Papermaking</strong>_<strong>Fibres</strong>_Using_New_Technologies<br />
information on Action E54 is available for all those who are interested.<br />
The Action’s participants are grateful to COST Scientific Officer Melae Langbein and<br />
Administrative Officer Cassia Azevedo Zezzi for the concern they have shown during the<br />
Action’s lifetime. I would like to thank also the COST Officers, who had served during the first<br />
years <strong>of</strong> the Action E54, namely Günter Siegel, Nic Standaert and Sylvia Liteanu.<br />
Chairman <strong>of</strong> COST Action E54<br />
Pr<strong>of</strong>essor Arnis Treimanis, Riga, December 2010<br />
4
COST Action E54 Book<br />
ACKNOWLEDGEMENTS<br />
The editors are grateful for all authors sending in their contributions on time and replying<br />
promptly to all comments and questions from the editors. Financial support to Paul Ander for<br />
production <strong>of</strong> this Book was obtained from CRUW (Cooperative Research on the Ultrastructure<br />
<strong>of</strong> Wood <strong>Fibres</strong>) at SLU, Uppsala with financial support from VINNOVA’s Branch Research<br />
Program and six supporting pulp and paper and chemical industries (Eka Chemicals, Holmen,<br />
SCA, Smurfit Kappa, Stora Enso and Södra Cell). The other editors were supported by their<br />
Institutions and Universities as given below. This publication was supported by COST.<br />
ADDRESSES OF THE EDITORS<br />
Paul Ander, CRUW, Dept. <strong>of</strong> Wood Science, Swedish University <strong>of</strong> Agricultural Sciences,<br />
PO Box 7008, SE- 75007, Uppsala, Sweden. E-mail: paul.ander@slu.se<br />
Wolfgang Bauer, Institute for Paper, Pulp and Fiber Technology, Graz University <strong>of</strong><br />
Technology, Kopernikusgasse 24/II, 010 Graz, Austria. E-mail: wolfgang.bauer@tugraz.at<br />
Sabine Heinemann, PO Box 1000, 02044 VTT (Espoo), Finland.<br />
E-mail: sabine.heinemann@vtt.fi<br />
Pasi Kallio, Micro- and Nanosystems Research Group <strong>of</strong> Tampere University <strong>of</strong> Technology,<br />
Korkeakoulunkatu 3, 33720 Tampere, Finland. E-mail: pasi.kallio@tut.fi<br />
Raphael Passas, Laboratory <strong>of</strong> Pulp and Paper Science and Graphic Arts, Grenoble INP-Pagora,<br />
38400 Saint Martin d’Heres Cedex France. E-mail: raphael.passas@pagora.grenoble-inp.fr<br />
Arnis Treimanis, State Institute <strong>of</strong> Wood Chemistry, 27 Dzerbenes str., Riga LV 1006, Latvia.<br />
E-mail: arnis.treimanis@edi.lv<br />
5
COST Action E54 Book<br />
6
COST Action E54 Book<br />
TABLE OF CONTENTS<br />
Legal Notice 2<br />
Preface 3-4<br />
Acknowledgements and Addresses <strong>of</strong> Editors 5-6<br />
Table <strong>of</strong> Contents 7-8<br />
Scientific Articles 9-282<br />
Chapter 1. Advanced analyses <strong>of</strong> wood pulp fibres 9-130<br />
Turner P., Kowalczyk M. and Reynolds A. “New insights into the micro-fibril<br />
architecture <strong>of</strong> the wood cell wall” 11-26<br />
Totolin M.I., Cazacu G. and Vasile C. “Cellulosic materials modification by<br />
physical and chemical methods” 27-38<br />
Gamelas J., Santos J. and Ferreira P.J. “Surface energetics <strong>of</strong> Common<br />
Pulps I and II by Inverse Gas Chromatography” 39-50<br />
Chinga-Carrasco G. and Syverud K. “Cellulose nan<strong>of</strong>ibrils – production,<br />
characterization and applications” 51-64<br />
Ander P., Henniges U. and Potthast A. “SEC studies on HCl treated s<strong>of</strong>twood<br />
and birch kraft pulps” 65-72<br />
Treimanis A., Potthast A., Henniges U., Rosenau T., Grinfelds U., Bikova T.<br />
and Skute M. ”Analysis <strong>of</strong> the surface layers <strong>of</strong> mechanically peeled<br />
unbleached and bleached eucalyptus kraft pulp fibres” 73-82<br />
Kappel L., Hirn U., Bauer W. and Schennach R. “Comparison <strong>of</strong> two different<br />
methods for fiber-fiber bonded area measurement” 83-90<br />
Valchev I.V. and Bikov P.Y. “Pulp dewatering and refining efficiency<br />
improvement by cellulase treatment” 91-96<br />
Valchev I.V., Blyahovski V.N., Bikov P.Y., Nenkova S.K. and Grossmann H.<br />
”Influence <strong>of</strong> cellulase treatment on the individual fiber structure and the<br />
papermaking properties” 97-104<br />
Ioelovich M. “Characterization <strong>of</strong> initial and modified samples <strong>of</strong> bleached<br />
kraft pulp and cotton cellulose” 105-114<br />
Eckhart R., Hirn U. and Bauer W. “A method capable to determine damage <strong>of</strong><br />
the outer fibre wall layers” 115-124<br />
Popescu C.-M. and Larsson, P.T. “Solid State NMR characterization <strong>of</strong><br />
cellulose acetate and lime wood cellulose” 125-130<br />
7
COST Action E54 Book<br />
Chapter 2. New and emerging methods such as microrobotics and<br />
microscopic techniques 131-208<br />
Saketi P. and Kallio P. ”Microrobotic platform for manipulation and<br />
mechanical characterization <strong>of</strong> individual paper fibres” 133-146<br />
Adusumalli R.-B., Kombaiah B., Mook W., Passas R., Raghavan, R. and<br />
Michler, J. ”Nano- and micro-mechanics <strong>of</strong> single wood pulp fibres” 147-162<br />
Mikczinski M., Bartenwerfer M., Saketi P., Heinemann S., Passas R., Kallio P.<br />
and Fatikow S. “Towards automated manipulation and characterisation <strong>of</strong><br />
paper-making fibres and its components” 163-178<br />
Kritzinger J., Donoser M., Hirn U. and Bauer W. “Fiber cross section<br />
properties estimated with an automated serial sectioning technique” 179-190<br />
Batchelor W., Kritzinger J., Bauer W., Kuntzsch T. and Meinl G. “Improved<br />
characterization <strong>of</strong> changes in fibre cross section during sheet forming and<br />
drying using optical fibre analyzer data and a serial sectioning technique“ 191-196<br />
Heinemann S., Wang S., Peltonen J. and Kleen M. “Characterization <strong>of</strong> TMP<br />
fiber wall structures by microscopic techniques“ 197-208<br />
Chapter 3. Results <strong>of</strong> standard pulp and paper tests on Common pulps I and<br />
II and other fibre materials 209-282<br />
Heinemann S. and Ander P. “Standard pulp and paper tests” 211-232<br />
Heinemann S. and Neclaw A. “Hydrodynamic specific surface area – The<br />
Dresden method and its results for pulps affected by different additives” 233-246<br />
Arndt, T. Meinl, G. and Erhard, K. “Behaviour <strong>of</strong> cellulose fine structures in<br />
papermaking tests” 247-252<br />
Popescu C.-M., Totolin M.I., Tibirna C.M., Popescu M.-C., Ander P. and<br />
Vasile C. “Structural and morphological characterization <strong>of</strong> unmodified and<br />
grafted unbleached and bleached s<strong>of</strong>twood Kraft pulp fibres” 253-266<br />
Cazacu G., Sdrobis A., Pintilie M., Rosu D., Ciolacu D., Totolin M. and Vasile<br />
C. “Swelling and electrokinetic properties <strong>of</strong> unbleached/bleached s<strong>of</strong>twood<br />
Kraft cellulose fibers” 267-281<br />
8
COST Action E54 Book<br />
Chapter 1. Advanced analyses <strong>of</strong> wood pulp fibres 9-130<br />
Turner P., Kowalczyk M. and Reynolds A. “New insights into the micro-fibril<br />
architecture <strong>of</strong> the wood cell wall” 11-26<br />
Totolin M., Cazacu G. and Vasile C. “Cellulosic materials modification by<br />
physical and chemical methods” 27-38<br />
Gamelas J., Santos J. and Ferreira P. “Surface energetics <strong>of</strong> Common Pulps I<br />
and II by Inverse Gas Chromatography” 39-50<br />
Chinga-Carrasco G. and Syverud K. “Cellulose nan<strong>of</strong>ibrils – production,<br />
characterization and applications” 51-64<br />
Ander P., Henniges U. and Potthast A. “SEC studies on HCl treated s<strong>of</strong>twood<br />
and birch kraft pulps” 65-72<br />
Treimanis A., Potthast A., Henniges U., Rosenau T., Grinfelds U., Bikova T.<br />
and Skute M. ”Analysis <strong>of</strong> the surface layers <strong>of</strong> mechanically peeled<br />
unbleached and bleached eucalyptus kraft pulp fibres” 73-82<br />
Kappel L., Hirn U., Bauer W. and Schennach R. “Comparison <strong>of</strong> two different<br />
methods for fiber-fiber bonded area measurement” 83-90<br />
Valchev I.V. and Bikov P.Y. “Pulp dewatering and refining efficiency<br />
improvement by cellulase treatment” 91-96<br />
Valchev I.V., Blyahovski V.N., Bikov P.Y., Nenkova S.K. and Grossmann H.<br />
”Influence <strong>of</strong> cellulase treatment on the individual fiber structure and the<br />
papermaking properties” 97-104<br />
Ioelovich M. “Characterization <strong>of</strong> initial and modified samples <strong>of</strong> bleached<br />
kraft pulp and cotton cellulose” 105-114<br />
Eckhart R., Hirn U., Bauer W. “A method capable to determine damage <strong>of</strong> the<br />
outer fibre wall layers” 115-124<br />
Popescu C.-M. and Larsson P.T. “Solid State NMR characterization <strong>of</strong><br />
cellulose acetate and lime wood cellulose” 125-130<br />
9
COST Action E54 Book<br />
10
COST Action E54 Book<br />
NEW INSIGHTS INTO THE MICRO-FIBRIL ARCHITECTURE OF THE<br />
WOOD CELL WALL<br />
Abstract<br />
Philip Turner 1 , Michael Kowalczyk 1 and Alan Reynolds 2<br />
1 Forest Products Research Institute, Edinburgh Napier University<br />
2 Brunel University<br />
ph.turner@napier.ac.uk<br />
Recent studies on the micr<strong>of</strong>ibril architecture <strong>of</strong> the wood cell wall using a new sample<br />
preparation technique (plasma ashing), in combination with Field Emission Electron Microscopy<br />
(FE-SEM), has revealed new, previously unpublished micr<strong>of</strong>ibril structures. The work indicates<br />
that the crystalline cellulose skeleton <strong>of</strong> the cell is largely fractal. A review <strong>of</strong> literature has<br />
shown that these fractal structures are not unique to the wood cell or indeed to biological<br />
materials, leading to the conclusion that fundamental physical processes drive these fractal<br />
structures. In our discussions we consider some key milestones in modern physics and their<br />
contribution to the development <strong>of</strong> a hypothesis <strong>of</strong> the underlying principles that could drive the<br />
fractal structure <strong>of</strong> matter. Based upon two parallel, complementary areas <strong>of</strong> research, scale<br />
relativity theory and string theory, we set a hypothesis that the fractal geometry <strong>of</strong> the wood cell<br />
wall is driven by the fractal geodesics <strong>of</strong> space-time.<br />
Introduction<br />
The current model <strong>of</strong> how cellulose micr<strong>of</strong>ibrils are laid down within the different layers <strong>of</strong> the<br />
wood cell wall has been established for a number <strong>of</strong> decades. The conventional view <strong>of</strong> their<br />
arrangement is illustrated in Figure 1. However, the results <strong>of</strong> work reported here using a new<br />
sample preparation technique combined with Scanning Electron Microscopy (SEM) reveals that<br />
the micr<strong>of</strong>ibril architecture <strong>of</strong> the cell wall is largely fractal. The paper goes on to explore why<br />
these fractal structures are produced. A number <strong>of</strong> examples are given <strong>of</strong> similar structures in<br />
other biological and inorganic materials indicating that the<br />
mechanisms driving these structures are not biological but<br />
physical. A review <strong>of</strong> recent developments in fundamental<br />
physics has led to a radical hypothesis that the fractal structure<br />
<strong>of</strong> the cell, and indeed the whole tree and the majority <strong>of</strong><br />
biological and inorganic materials in general is driven by the<br />
geometric structure <strong>of</strong> space-time which is fractal.<br />
Methodology<br />
Figure 1. Illustration <strong>of</strong> the classical model <strong>of</strong> the orientation <strong>of</strong><br />
micro-fibrils within the primary wall, S1, S2 and S3 layers within a<br />
wood cell (Cǒté 1974)<br />
Except where mentioned to the contrary, the bulk <strong>of</strong> the experimental work was carried out on a<br />
single sample <strong>of</strong> an industrially processed Eucalyptus grandis based pulp. A small sample <strong>of</strong> a<br />
few grams <strong>of</strong> pulp was mixed with deionized water in order to create a dilute suspension <strong>of</strong><br />
individual fibres. Samples <strong>of</strong> fibre were prepared by placing drop <strong>of</strong> the suspension on a number<br />
11
COST Action E54 Book<br />
<strong>of</strong> electron microscope stubs, which were subsequently dried in an oven to dry at 50 o C. After<br />
drying, the fibre samples were placed in a plasma Asher (Emitech K1050X) for a range <strong>of</strong><br />
exposure times (1 to 5 minutes) at a setting <strong>of</strong> between 30-60 Watts. Plasma ashing, first<br />
reported by Humphries (1979), is a process involving the oxidization <strong>of</strong> organic matter by<br />
oxygen plasma. The resulting carbon oxides and water vapor are volatilized and pumped away<br />
under vacuum. When the plasma is applied to wood cells at the correct level <strong>of</strong> exposure, the<br />
more reactive amorphous lignin and polysaccharides are preferentially oxidized, leaving behind<br />
the more stable crystalline skeleton, which can be viewed with an Electron Microscope.<br />
After exposure in the plasma Asher, the stubs were gold coated then examined using a Hitachi<br />
S4800 Field Emission Scanning Electron Microscope (FE-SEM) at a range <strong>of</strong> magnifications. A<br />
low voltage electron beam was used (
COST Action E54 Book<br />
Figure 3. Primary wall at low (10 000 x) magnification<br />
Figure 4. An enlargement <strong>of</strong> the primary wall illustrated in Figure 3 at 50 000 x magnification. The<br />
image reveals the dendritic (fractal) arrangement <strong>of</strong> the micro-fibrils<br />
The S1 layer<br />
Figure 5 shows an image <strong>of</strong> the structure just below the primary wall. The predominant structure<br />
at this magnification (10 000 x) is an intricately branched fractal scaffold, which is attached to<br />
the underlying S1 layer fibrils, which are aligned perpendicular to the cell axis. They can just be<br />
seen at this magnification. Figure 6 reveals in more detail how the apparently intermediate<br />
fractal scaffold interacts with perpendicular fibrils <strong>of</strong> the S1 layer. Figure 7 shows yet more<br />
detail after further exposure to plasma ashing. It is clear from this figure that the scaffold is an<br />
integral part <strong>of</strong> the S1 layer forming a complex web <strong>of</strong> interconnections. It should be noted that<br />
this combination <strong>of</strong> fractal web and linear fibrils within the S1 layer was not common to fibres in<br />
other eucalyptus pulp samples. Figure 8 shows an image <strong>of</strong> an alternative industrial eucalyptus<br />
pulp fibre at low magnification (5000 x). In this image the fibre has again been stripped <strong>of</strong> the<br />
13
COST Action E54 Book<br />
primary wall to reveal the underlying S1 layer. Figure 9 shows an enlargement <strong>of</strong> this same fibre<br />
at 25 000 x magnification, showing a neatly arranged set <strong>of</strong> micr<strong>of</strong>ibrils oriented perpendicular<br />
to the main fibre axis. A further magnification (50 000 x) <strong>of</strong> the same structure is illustrated in<br />
figure 10. In this set <strong>of</strong> images the intermediate fractal skeleton found in figures 5-7 is not<br />
present. The overall arrangement <strong>of</strong> the S1 layer in figures 8-10 is comparable to the traditional<br />
model seen in Figure 1.<br />
The different structures within the S1 layer suggest some variation between different pulp fibres.<br />
It is not possible to say if these variations are due to genetic or environmental influences at this<br />
stage.<br />
Figure 5. Low magnification image (10 000 x) revealing a fractal scaffold interacting with the underlying<br />
micro-fibrils <strong>of</strong> the S1 layer which are oriented perpendicular to the main axis <strong>of</strong> the cell<br />
Figure 6. High resolution image (100 000 x) illustrating the complex branching structure that connects<br />
the fractal scaffold with the micro-fibrils in the underlying S1 layer which are oriented perpendicular to<br />
the main axis <strong>of</strong> the cell<br />
14
COST Action E54 Book<br />
Figure 7. Image showing how the fractal scaffold is an integral part <strong>of</strong> the structure <strong>of</strong> the S1 layer in<br />
this fibre<br />
Figure 8. Primary wall <strong>of</strong> an alternative industrial eucalyptus pulp fibre at low magnification (5000 x).<br />
The fine structure <strong>of</strong> the fibril arrangement cannot be seen at this magnification but is revealed at higher<br />
magnifications (Figure 9 and 10)<br />
15
COST Action E54 Book<br />
Figure 9. Image <strong>of</strong> micro-fibrils in the S1 wall layer oriented perpendicular to the main axis <strong>of</strong> the cell<br />
(25 000 x)<br />
Figure 10. Image <strong>of</strong> micro-fibrils in the S1 wall layer oriented perpendicular to the main axis <strong>of</strong> the cell<br />
(50 000 x)<br />
The S2 layer<br />
In the established cell wall model the micr<strong>of</strong>ibrils in the S2 layer orient parallel to the main axis<br />
<strong>of</strong> the cell. The variation in the micro-fibril angle from the main axis has been extensively<br />
reported as impacting on issues such as wood stiffness and shrinkage during drying. Figure 11<br />
shows a low magnification image (10 000 x) <strong>of</strong> a cell that has been exposed to a relatively high<br />
level <strong>of</strong> plasma ashing. The primary wall and S1 and S3 layers have been completely removed.<br />
What remains is the main body <strong>of</strong> crystalline material within the cell wall, i. e. the S2 layer.<br />
Imaging <strong>of</strong> a large portion <strong>of</strong> the whole cell helps indicate the scale <strong>of</strong> the crystalline structure<br />
relative to the cell.<br />
Figure 12 illustrates the detailed structure <strong>of</strong> the crystalline fibrils at 100 000 x magnification.<br />
Whilst there is a general trend to orientation along the axis <strong>of</strong> the cell, the micro-fibrils form a<br />
16
COST Action E54 Book<br />
complexed, nodular, “Velcro like” fractal structure. The image <strong>of</strong> the S2 layer in figure 12<br />
represents the most common structure found to date. However there are some variations on this<br />
structure, most <strong>of</strong> which are related to the level <strong>of</strong> packing <strong>of</strong> the fractal structure. To date, no<br />
examples <strong>of</strong> a linear S2 layer have been found to support the traditional model <strong>of</strong> a linear<br />
arrangement <strong>of</strong> fibrils parallel to the cell axis, despite looking at a range <strong>of</strong> species including<br />
pines, spruce, cedar, eucalyptus and acacia. A wider study may reveal these more classical<br />
structures. However, it is proposed that the traditional model <strong>of</strong> the S2 layer architecture needs<br />
to be revisited.<br />
The findings <strong>of</strong> this work suggest that a rethink is required on the exact role <strong>of</strong> the S2 layer on<br />
the structural characteristics <strong>of</strong> the cell. It is interesting that Velcro like “slip” properties <strong>of</strong> wood<br />
have been reported in the recent past (Keckes et al. 2003). Our results, revealing a “Velcro like”<br />
structure at the fibrilar may <strong>of</strong>fer new insights into how the S2 layer could be influencing these<br />
observed characteristics.<br />
One interesting question relates to how this fractal structure is affected by pulping and bleaching<br />
processes. Figure 13 shows a highly aggregated structure in a high alpha cellulose pulp. We have<br />
not seen this level <strong>of</strong> aggregation in non-pulped wood samples, suggesting that the aggregation<br />
is due to an aggressive pulping and bleaching process which can lead to insoluble structures (and<br />
potential problems) in subsequent dissolving pulp processes.<br />
Figure 11. A low magnification image (10 000 x) in which the primary wall and S1 layer have been<br />
removed to reveal the S2 skeleton <strong>of</strong> the cell<br />
17
COST Action E54 Book<br />
Figure 12. A high-resolution image (100 000 x) <strong>of</strong> the complex, fractal micro-fibril structure found within<br />
the S2 layer<br />
Figure 13. An image <strong>of</strong> an aggregated S2 layer at 50 000 x magnification, thought to be a result <strong>of</strong><br />
aggressive pulping and bleaching<br />
The S3 layer<br />
It proved difficult to etch away the S2 layer to reveal the S3 layer. As can be seen from Figure<br />
11, the energy levels required to remove polysaccharides to expose the S2 layer also remove the<br />
S3 layer. However, we were able to view the S3 by an alternative mechanism. Figure 14 is a low<br />
magnification image <strong>of</strong> two cells etched to reveal the fractal scaffold that forms part <strong>of</strong> the S1<br />
layer. The cell on the right has torn during handling, revealing the underside <strong>of</strong> the S2 layer and<br />
exposing the S3 layer, which can be seen in more detail in Figure 15. The S3 layer appears to be<br />
fractal in structure, with a similar but not directly comparable structure to that <strong>of</strong> the primary<br />
wall.<br />
18
COST Action E54 Book<br />
Figure 14. 10 000 x magnification <strong>of</strong> two cells exposed to plasma to reveal the fractal scaffold <strong>of</strong> the S1<br />
layer. The right hand cell has torn to reveal the underside <strong>of</strong> the S2 layer and the S3 layer, which is<br />
shown at higher magnification in figure 15<br />
Figure 15. An image showing the fractal structure <strong>of</strong> the S3 layer exposed by a tear in the S1 and S2<br />
layer which is peeled backwards<br />
Discussion<br />
As part <strong>of</strong> the process <strong>of</strong> improving our understanding <strong>of</strong> micr<strong>of</strong>ibril structure we reviewed past<br />
literature to see if the fractal cellulose structures reported here (particularly in the S2 layer) had<br />
been previously observed. The search was unsuccessful. We concluded that the plasma etching<br />
process was, for the first time revealing the true structure <strong>of</strong> the micr<strong>of</strong>ibril architecture.<br />
However, we have not ruled out the possibility that some species will have structures similar to<br />
the traditional model described in Figure 1.<br />
19
COST Action E54 Book<br />
In order to try and better understand the role that the observed fractal structures might play in the<br />
cell and at the level <strong>of</strong> the tree, we broadened our search to see if comparable structures could be<br />
found elsewhere. The result was unexpected. Brune et al. (1994) reported on the formation <strong>of</strong><br />
fractal structure created by silver atoms, which were almost identical to that shown in the<br />
primary wall (Figure 4). A paper by Enculescu and Topa (2006) revealed fractal structures<br />
formed by gold atoms in a diffusion limited aggregation process, which were very similar to<br />
some <strong>of</strong> those we found in the S2 layer. A further paper on the fractal structure <strong>of</strong> brain neurons<br />
was published by Hagan et al. (2002). The structures were almost identical to some <strong>of</strong> our<br />
images <strong>of</strong> the S2 layer.<br />
The overall outcome <strong>of</strong> our review was a large body <strong>of</strong> work published over the last 20 years<br />
reporting the formation <strong>of</strong> fractal structures in both organic and inorganic materials. It is clear<br />
from the review that fractal structures are ubiquitous in inorganic and biological systems when<br />
the structures are allowed to grow in an unconstrained way, normally referred to as diffusion<br />
limited aggregation. It is also clear that these fractal structures are not driven by biological<br />
processes, but something more fundamental, at the level <strong>of</strong> atomic structure (or smaller). In<br />
order to explain these observations we need a new, higher level hypothesis.<br />
At this stage we refocused our review on historical and current scientific literature in<br />
fundamental physics. A full and comprehensive review is beyond the scope <strong>of</strong> this current paper.<br />
For the sake <strong>of</strong> brevity we have focused on a few key milestones, which form the foundations,<br />
upon which we have constructed a new perspective on the fractal structure <strong>of</strong> materials and<br />
biological systems.<br />
We began our search with the hypothesis that the fractal structure <strong>of</strong> materials must have some<br />
sort <strong>of</strong> foundation in the structure <strong>of</strong> the atom. In terms <strong>of</strong> scale, the nucleus is the equivalent <strong>of</strong><br />
a pinhead in the Albert Hall, i.e., most <strong>of</strong> the atom is comprised <strong>of</strong> space though which electrons<br />
travel whilst orbiting the nucleus. From this hypothesis, a few key pillars <strong>of</strong> modern physics<br />
emerge.<br />
In 1915 Albert Einstein published the general theory <strong>of</strong> relativity. His greatest achievement in<br />
general relativity was to base the theory <strong>of</strong> gravity on geometry (Riemannian geometry). The<br />
theory generalizes his special theory <strong>of</strong> relativity and Newton's law <strong>of</strong> universal gravitation,<br />
providing a unified description <strong>of</strong> gravity as a geometric property <strong>of</strong> four dimensional space and<br />
time (space-time). The theory takes a classical approach using non-linear, partial differential<br />
equations to describe smooth changes in the curvature <strong>of</strong> space-time as opposed to quantum<br />
jumps. In that sense, it resembles the 19 th century version <strong>of</strong> electromagnetic theory, not 20 th<br />
century quantum physics that is used to describe the other three forces known to physics. These<br />
forces include electromagnetism plus two additional forces, which operate within the nucleus <strong>of</strong><br />
an atom. The strong force, holds a nucleus together, in spite <strong>of</strong> the fact that it contains protons<br />
that should repel each other. The weak force is responsible for radioactive decay. Both these<br />
forces have only a short range, within an atomic nucleus. A key focus <strong>of</strong> modern physics is to<br />
find a quantum theory <strong>of</strong> gravity, which can then be combined into one package with the other<br />
three quantum fields.<br />
Quantum mechanics was from its origin, fundamentally about wave mechanics, which led to the<br />
unification <strong>of</strong> matter and radiation. In 1905, Einstein introduced the concept <strong>of</strong> a quantum <strong>of</strong><br />
light (the photon). He related the frequency <strong>of</strong> the wave to the energy <strong>of</strong> the photon and its<br />
wavelength to its momentum. In 1923 de Broglie made the same suggestion for matter. De<br />
Broglie hypothesized that all particles (e.g. electrons) had similar properties. Assuming that the<br />
waves travel roughly along classical paths, he showed that they form standing waves for certain<br />
20
COST Action E54 Book<br />
discrete frequencies. These correspond to discrete energy (or quantum) levels. These proposals<br />
by Einstein and de Broglie were the origin <strong>of</strong> wave mechanics that became quantum mechanics.<br />
Following up on these ideas, Schrödinger developed a wave equation for the electron, which he<br />
used to compute the hydrogen spectra series by treating a hydrogen atom’s electron as a wave.<br />
The solution accurately reproduced the energy levels <strong>of</strong> the Bohr model.<br />
The Schrödinger equation describes how the quantum state <strong>of</strong> a physical system changes in time.<br />
The most general form is the time-dependant Schrödinger equation, which describes a system<br />
evolving with time. A time independent Schrödinger equation can be used for systems in a<br />
stationary state. Max Born interpreted the wave as probability amplitude, which became known<br />
as the Copenhagen interpretation.<br />
The theory <strong>of</strong> scale relativity<br />
At this point we come to the work <strong>of</strong> Laurent Nottale a French astrophysicist. Since 1991,<br />
Nottale has published a number <strong>of</strong> papers on his theory <strong>of</strong> scale relativity [Nottale (1991, 1993,<br />
1994, 1995a, 1995b, 1997, 2003a, 2003b, 2007), Nottale and Celerier (2009), Nottale et al.<br />
(1996)]. The theory <strong>of</strong> scale relativity is an extension <strong>of</strong> the theories <strong>of</strong> relativity. In the general<br />
theory <strong>of</strong> relativity the geodesic curvature <strong>of</strong> space-time is smooth and differentiable. The scale<br />
relativity theory treats space-time as continuous but non-differentiable, (fractal) at all scales<br />
from the Planck scale (10 -33 cm) to infinity.<br />
The length <strong>of</strong> a non-differentiable (fractal) curve is dependant on the resolution at which it is<br />
measured. For example, when measuring the coastline <strong>of</strong> Norway its length is scale dependant,<br />
with smaller scale resolutions leading to an increase in the length <strong>of</strong> the coastline measured.<br />
According to the scale relativity theory, this principle can be applied to space, and more<br />
generally to space-time. On a large scale the curvature <strong>of</strong> space-time approximates to a<br />
differentiable curve but as the resolution becomes smaller in scale these curves have an internal<br />
fractal structure with an infinite number <strong>of</strong> possibilities depending upon the scale at which it is<br />
observed. In translation, this suggests that a “wave-particle” such as an electron will have the<br />
geometric properties <strong>of</strong> a subset <strong>of</strong> the fractal geodesics <strong>of</strong> a non-differentiable space-time i.e. an<br />
electron will follow a fractal trajectory in its orbital as it travels through the complex,<br />
multidimensional fractal scaffold <strong>of</strong> space-time. Auffray and Nottale (2008) introduced pure<br />
scale laws describing the dependence on scale <strong>of</strong> fractal paths at a given point <strong>of</strong> space-time. The<br />
paper then goes on to consider the radical consequences on motion <strong>of</strong> the fractal structure <strong>of</strong><br />
space-time. The laws <strong>of</strong> mechanics constructed from the geodesic <strong>of</strong> fractal space-time become<br />
quantum type mechanics. Auffray and Nottale transformed Newton’s equations <strong>of</strong> dynamics into<br />
a generalized macroscopic Schrödinger equation, which leads to a pr<strong>of</strong>ound theory <strong>of</strong> selforganization.<br />
A Schrödinger-type equation is characterized by the existence <strong>of</strong> stationary solutions yielding<br />
well-defined peaks <strong>of</strong> probability linked to quantization laws, <strong>of</strong> the forces applied and <strong>of</strong> the<br />
symmetries <strong>of</strong> the system. Nottale (1997) interpreted these peaks <strong>of</strong> probability as a tendency for<br />
the system to form structures. The theory doesn’t predict precise organization, but rather the<br />
most probable structures among the infinity <strong>of</strong> other close possibilities. This is compatible with<br />
the large variability that characterizes living systems.<br />
Traditionally, scientists have viewed growth as a process <strong>of</strong> “diffusion limited aggregation”<br />
while Nottale and Auffray (2008) suggest that growth processes are based upon the laws <strong>of</strong><br />
quantum mechanics. It should be emphasized that quantum mechanics and diffusion process are<br />
21
COST Action E54 Book<br />
opposite processes. Diffusion laws describe disorganization and entropy increase. Conversely,<br />
quantum-type laws are an archetype for laws <strong>of</strong> self-organization and local entropy decrease.<br />
In living systems, morphologies are acquired through growth processes. According to Auffray<br />
and Nottale (2008), following their “Schrödinger process”, growth can be described in terms <strong>of</strong><br />
an infinite family <strong>of</strong> virtual, fractal and locally irreversible trajectories. However, instead <strong>of</strong> an<br />
infinite number <strong>of</strong> possible morphologies, only some are possible due to the quantized nature <strong>of</strong><br />
trajectories and their corresponding morphologies are also quantized. The quantum level (n) can<br />
be 0 to infinity. When n=0 a one–body structure results. If one increases the energy from this<br />
value, no stable solution can exist before it reaches the second quantized level when a two-body<br />
structure is formed through a process <strong>of</strong> bifurcation. The passage from the fundamental level to<br />
the first excited level provides a rough model <strong>of</strong> duplication or bifurcation. As the energy levels<br />
increase further, bodies <strong>of</strong> increasing complexity result. The model provides a good hypothesis<br />
as to why we see fractal structures at both the macroscopic (tree) level and at the microscopic<br />
(within cell) level. This could also explain why we see both relatively simple, almost linear<br />
arrangements <strong>of</strong> micro-fibrils within the S1 layer in combination with increasing levels <strong>of</strong><br />
complexity in other layers <strong>of</strong> the cell wall.<br />
To demonstrate the principles behind the theory, Auffray and Nottale (2008) show a simple<br />
example <strong>of</strong> the use <strong>of</strong> the “Schrödinger process” to “grow” flower-like shapes, with different<br />
structures (petals, sepals and stamen) within the flower being derived from the same wave<br />
equation.<br />
If space-time is fractal, at all scales then we should see parallel structures both at atomic level<br />
and throughout space. It is interesting to note that the fractal structures formed by gold atoms in<br />
a diffusion limited aggregation process, referred to earlier are very similar to recent published<br />
images <strong>of</strong> the universe from the Sloan digital sky survey (2007) which are fractal on the scale <strong>of</strong><br />
billions <strong>of</strong> light years.<br />
Scale relativity theory provides a fundamental explanation as to how simple through to complex<br />
structures (both organic and inorganic) can be influenced by the fundamental structure <strong>of</strong> spacetime<br />
through the “Schrödinger process. In theory it should be possible to write a complete<br />
system <strong>of</strong> equations including the effects <strong>of</strong> fractality and describe the system, the environment<br />
and the interaction between them. Nottale (1995, 1996a) suggests it is possible to produce a<br />
system <strong>of</strong> equations that can be integrated in terms <strong>of</strong> a single, multisystem Schrödinger<br />
equation, which could have pr<strong>of</strong>ound implications for the description <strong>of</strong> the relations between<br />
biological systems and their environment.<br />
String theory<br />
The second area <strong>of</strong> recent activity <strong>of</strong> relevance to the fractal character <strong>of</strong> matter is string theory.<br />
According to Edward Witten (Davies and Brown 1998), string theory is essentially a new branch<br />
<strong>of</strong> geometry. Which attempts to unify the four forces <strong>of</strong> physics into a single, logical framework<br />
in a way that is analogous to that <strong>of</strong> General relativity in which gravity theory is based on<br />
geometry.<br />
One <strong>of</strong> the most developed forms <strong>of</strong> string theory, Heterotic string theory first developed by<br />
Gross et al. (1985) is essentially a theory <strong>of</strong> gravity in which the particles <strong>of</strong> matter as well as the<br />
other forces <strong>of</strong> nature emerge in the same way that gravity emerges from geometry. The theory<br />
is based on the complex fractal geometry <strong>of</strong> the E8 structure illustrated in Figure 16 (Green et al.<br />
1987). This structure, a representation <strong>of</strong> the Exceptional Lie group E8 was found in a 248<br />
dimensional mathematical puzzle, which was solved in March 2007. An international team <strong>of</strong><br />
22
COST Action E54 Book<br />
mathematicians produced a complex numerical structure, which was described more than a<br />
century ago. Conceptualizing, designing, running the calculations and mapping the 248<br />
dimensional structure, took 18 mathematicians four years. They processed more data than that<br />
used to sequence the human genome sequence.<br />
The reason Heterotic string theory has attracted so much interest is that the symmetries <strong>of</strong><br />
particle physics, which are known about from experiments at energy levels currently accessible,<br />
are part <strong>of</strong> the symmetries <strong>of</strong> the E8 structure. This theory combines earlier string theory, which<br />
works in twenty-six dimensional space-time with one, which works in ten dimensions. Ten <strong>of</strong><br />
the twenty-six dimensions are ordinary space-time dimensions, with the string wriggling in tendimensional<br />
space-time. In addition there are 16 internal dimensions, which lead to extra<br />
structure in the theory that ought to describe forces other than gravity.<br />
According to string theory, strings can oscillate and vibrate in different ways – each <strong>of</strong> these<br />
different modes <strong>of</strong> vibration or oscillation can be thought <strong>of</strong> as describing a particular type <strong>of</strong><br />
particle. The electron, graviton, photon, the neutrino and all other particles are different<br />
harmonics <strong>of</strong> a fundamental string i.e. we have one type <strong>of</strong> string but its pattern <strong>of</strong> motion (and<br />
energy level) defining its nature. It brings a whole new dimension <strong>of</strong> understanding to Einstein’s<br />
equation (E=mc 2 ) in which energy and mass have equivalence.<br />
Figure 16. The E8 structure<br />
String theory takes our conceptual understanding <strong>of</strong> space-time to another level. At the Planck<br />
scale (10 -33 cm), space and time are effectively built <strong>of</strong> strings rather than strings inhabiting space<br />
and time. Conceptually we can consider space-time (and by default all matter) as a complex,<br />
multidimensional web like fractal structure made up <strong>of</strong> strings. The E8 structure forms a good,<br />
possibly oversimplified model. This idea has been actively proposed by El Nashie (2006 and<br />
2007). El Nashie’s Cantorian E-infinity theory <strong>of</strong> space-time takes a similar approach to Nottale,<br />
describing space-time as an infinitely dimensional fractal structure in which the Exceptional Lie<br />
group E8xE8 describes the volume <strong>of</strong> space-time.<br />
23
COST Action E54 Book<br />
It needs to be emphasized that at this moment in time, string theory is not completely understood<br />
with solutions being at best approximations. It is generally accepted that physicists are still<br />
looking for the best formulation, which may take years. The radical conclusion to string theory is<br />
that all matter is comprised <strong>of</strong> the vibrating fabric <strong>of</strong> space-time. If correct, it would certainly<br />
explain the ubiquitous fractal character <strong>of</strong> matter in the natural universe.<br />
Conclusions and the way forward<br />
We have demonstrated a new approach to viewing the internal structure <strong>of</strong> plant cells that has<br />
provided new insights into the architecture <strong>of</strong> the cell wall and suggests that it has a level <strong>of</strong><br />
complexity that rivals that <strong>of</strong> the tree itself (an archetypal fractal structure). The cellulose<br />
skeleton is a complex, largely fractal structure that may <strong>of</strong>fer new insights into the possible role<br />
<strong>of</strong> cellulose in wood characteristics. This new understanding may also assist in the development<br />
<strong>of</strong> new models to better predict wood and pulp and paper properties into the future. For example,<br />
the classical model <strong>of</strong> a highly oriented S2 layer and its impact on issues such as wood strength,<br />
stability and creep needs a re-think. Work has started to model these structures and to use finite<br />
element analysis to assess the role <strong>of</strong> the different cell layers on structural performance <strong>of</strong> the<br />
cell.<br />
Our high magnification images reveal that the surface <strong>of</strong> micro fibrils is nodular in appearance,<br />
suggesting that the internal arrangement <strong>of</strong> cellulose chains may not be a simple, linear<br />
arrangement <strong>of</strong> cellulose chains. Sugiyama et al. (1984) showed linear arrangements <strong>of</strong> cellulose<br />
molecules in a straight, bacterial cellulose micr<strong>of</strong>ibril so clearly these linear arrangements exist.<br />
However, within the context <strong>of</strong> the discussions highlighted here, it is suggested that the internal<br />
structures <strong>of</strong> the samples we have shown may be fractal. Currently unpublished work indicates<br />
that this may well be the case. Work is ongoing to confirm this.<br />
This paper sets the hypothesis that the fractal structure <strong>of</strong> the tree and the cell itself along with<br />
the majority <strong>of</strong> biological and inorganic materials that are allowed to “grow” is driven by the<br />
fundamental fractal structure <strong>of</strong> space-time. This concept has gained considerable momentum<br />
through parallel and independent research programs in fundamental physics.<br />
The macroscopic Schrödinger theory derived from Nottale’s theory <strong>of</strong> scale relativity provides<br />
new insights into how biological functions (morphogenesis, duplication, multiscale hierarchy <strong>of</strong><br />
organization etc) and the ubiquitous fractal structures found in biological systems and the<br />
physical world are influenced by quantum mechanics and fundamental geometric structures <strong>of</strong><br />
space-time.<br />
The development <strong>of</strong> string theory is still ongoing. The jury is still out on what its final form will<br />
take. Meanwhile it provides fundamental insights into the nature <strong>of</strong> matter and provides an<br />
alternative, complementary perspective on the structure and nature <strong>of</strong> space-time to that<br />
proposed by Nottale.<br />
The framework <strong>of</strong>fered by the scale relativity theory opens the opportunity to rethink research in<br />
order to better understand the fundamentals <strong>of</strong> biological systems. This needs to be done taking<br />
an integrative systems approach to biology. Such collaboration has already started through the<br />
SYSTEMOSCOPE Consortium (Auffray et al. 2003b). The work requires multidisciplinary<br />
collaboration between biology, physics, materials science, systems engineering, computer<br />
sciences micro and nanotechnologies and modeling and simulation. We need to pull together a<br />
diverse range <strong>of</strong> expertise to establish more pr<strong>of</strong>ound foundations for a theory <strong>of</strong> biology<br />
24
COST Action E54 Book<br />
through the integration <strong>of</strong> the cell, biochemical and evolution-development theories based on<br />
first principles. On another level, materials scientists are currently focused on understanding and<br />
mimicking biological processes. The ideas discussed in this paper suggest that many biological<br />
systems may well turn out to be purely physical processes. Understanding how these systems<br />
work could lead to insights into the development <strong>of</strong> new self assembly processes at molecular<br />
and nanometer scales.<br />
References<br />
Auffray C., Imbeaud S., Roux-Rouquie M. and Hood L. (2003a): Self organized living systems:<br />
conjunction <strong>of</strong> a stable organization with chaotic fluctuations in biological space-time. Philos. Trans.<br />
Roy. Soc. Math. Phys. Eng. Sci. 361, 1125-1139<br />
Auffrey C., Chen Z., Hood L., Soares B. and Sugano S. (2003b): Foreword: From the transcriptome<br />
conferences to the stemoscope International Consortium. C.R Biologies 326, 867-875<br />
Auffrey C. and Nottale L. (2008): Scale relativity theory and integrative systems biology: 1 Founding<br />
principles and scale laws. Progress in Biophysics & Molecular Biology 97, 79-114<br />
Brune H., Romainczyk C., Roder H. and Kern K. (1994): Mechanism <strong>of</strong> the transition from fractal to<br />
dendritic growth <strong>of</strong> surface aggregates. Nature Vol. 369<br />
Côté W.A. (1974): Wood ultrastructure in relation to chemical composition. In: The structure,<br />
biosynthesis and degradation <strong>of</strong> wood. Vol 11, Ch 1. Plenum, New York, 1-44. Eds: Loewus, F. and<br />
Runeckles, W.C.<br />
Davies P.C.W. and Brown J. (1998): Superstrings. A Theory <strong>of</strong> Everything? Cambridge University Press<br />
El Naschie M.S. (2007): A review <strong>of</strong> applications and results <strong>of</strong> E-infinity theory. Int J Nonlin Sci Simul.<br />
8(1): 11-20<br />
El Naschie M.S. (2006): Elementary prerequisites for E-infinity. Chaos, Solitons and Fractals 30, 579-<br />
605<br />
Enculescu M. and Topa V. (2006): Fractal structures <strong>of</strong> gold obtained by diffusion limited aggregation in<br />
alkali halide crystals. Journal <strong>of</strong> Optoelectronics and Advanced Materials Vol. 8, No. 3, June 2006, p.<br />
1230 – 1233<br />
Green M., Schwarz J. and Witten E. (1987): Superstring Theory, Vols I and II. Cambridge University<br />
Press<br />
Hagan S., Hamer<strong>of</strong>f R. and Tuszynski A. (2002): Quantum computation in brain microtubules:<br />
Decoherence and biological feasibility. Physical Review E, Volume 65, 061901<br />
Humphries W. J. (1979): Scanning Electron Microscopy <strong>of</strong> biological specimens surface-etched by an<br />
Oxygen plasma. Scanning Electron Microscopy 1979/11<br />
Gross D.J., Harvey J.A., Martinec E. and Rohm R. (1985): Heterotic String theory: (11). The interacting<br />
heterotic string. Phys. Rev. Lett. 54, 502-505<br />
Keckes J., Burgert I., Frühmann K., Müller M., Kölln K., Hamilton M., Burghammer M., Roth S. V.,<br />
Stanzl-Tschegg S. E. and Fratzl P. (2003): The ‘molecular Velcro’ model <strong>of</strong> cell-wall recovery after<br />
irreversible deformation <strong>of</strong> wood. Nat. Mater. 2, 810–814<br />
Notalle L. (1991): The theory <strong>of</strong> scale relativity. Int. J. Modern Physics A, vol. 7, No. 20, 4899-4936<br />
25
COST Action E54 Book<br />
Nottale L. (1993): Fractal space-time and microphysics. Towards a theory <strong>of</strong> scale relativity. World<br />
Scientific. ISBN 9810208782<br />
Nottale L. (1994): Scale relativity, Fractal Space-time and Quantum Mechanics. Chaos, Solitons &<br />
Fractals 4(3), 361-388<br />
Nottale L. (1995a): Scale Relativity and Fractal Space-Time: Applications to Quantum Physics,<br />
Cosmology and Chaotic Systems. Chaos, Solitons & Fractals 7(6), 877-938<br />
Nottale L. (1995b): Scale Relativity: From Quantum Mechanics to Chaotic Dynamics. Chaos, Solitons &<br />
Fractals 6, 399-410<br />
Nottale L. (1997): Scale relativity and quantization <strong>of</strong> the universe. I. Theoretical framework. Astronomy<br />
and Astrophysics 327, 867-889<br />
Nottale L. (2003a): The theory <strong>of</strong> Scale Relativity: Non- Differentiable Geometry and Fractal Space-<br />
Time, Computing Anticipatory Systems. CASYS’03 – Sixth Int. Conf.’’ (2003)<br />
Nottale L. (2003b): Scale – relativistic cosmology. Chaos, Solitons & Fractals 16 (2003) 539-564<br />
Nottale L. (2007): Scale Relativity: A Fractal Matrix for Organization in Nature. Electronic Journal <strong>of</strong><br />
Theoretical Physics 4, No. 16 (II), 187-274<br />
Nottale L. and Auffrey C. (2008): Scale relativity theory and integrative systems biology: 2 Macroscopic<br />
quantum-type mechanics. Progress in Biophysics & Molecular Biology 97, 115-157<br />
Nottale L. and Celerier M. (2009): Motion equations for relativistic particles in an external<br />
electromagnetic field in scale relativity<br />
Nottale L., Schumacher G. and Gay J. (1997): Scale Relativity and quantization <strong>of</strong> the solar system.<br />
Astronomy and Astrophysics 322, 1018-1025<br />
Sugiyama J., Harada H., Fujiyoshi Y. and Uyeda N. (1984): High resolution observations <strong>of</strong> cellulose<br />
micr<strong>of</strong>ibrils. Mokuzai Gakkaishi 30(1), 98-99<br />
26
COST Action E54 Book<br />
CELLULOSIC MATERIALS MODIFICATION BY PHYSICAL AND<br />
CHEMICAL METHODS<br />
Marian I. Totolin, Georgeta Cazacu and Cornelia Vasile<br />
“Petru Poni” Institute <strong>of</strong> Macromolecular Chemistry, 41 A Grigore Ghica Voda Alley, IASI,<br />
ROMANIA<br />
Abstract<br />
E-mail: gcazacu@icmpp.ro<br />
It is well-known that paper and cellulosic materials are the best candidates for flexible packaging<br />
materials where good barrier properties, water repellence, grease resistance and flame retardance<br />
are required. The paper describes several ways <strong>of</strong> the modification <strong>of</strong> cellulose substrates by<br />
physical methods (such as plasma treatments) and chemical modifications. Evidence for<br />
chemical reactions mainly on the surface was obtained.<br />
Introduction<br />
With increasing demand for flexible barrier packaging, the industry has no choice but to<br />
continue to innovate and develop new materials and packaging solutions to meet the needs <strong>of</strong> a<br />
growing market. Paper and cellulosic materials hold a good promise <strong>of</strong> being candidates for<br />
flexible packaging materials provided suitable barrier properties such as water repellence and<br />
grease resistance are imparted to them. One <strong>of</strong> the methods to achieve these objectives is surface<br />
modification <strong>of</strong> paper and cellulose by applying thin coatings on the surface.<br />
Cellulose is a complex carbohydrate, (C6H10O5)n, composed <strong>of</strong> glucose units, and forms the main<br />
constituent <strong>of</strong> the cell wall in most plants, and is important in the manufacture <strong>of</strong> numerous<br />
products, such as paper, textiles, pharmaceuticals and composite materials. Cellulose possesses<br />
three types <strong>of</strong> -OH groups, which are quite different in terms <strong>of</strong> regiochemistry and polarity<br />
(Rozmarin 1984; Atalla 1999) (Figure 1).<br />
Figure 1. Molecular structure <strong>of</strong> cellulose (n = polymerization degree)<br />
This difference is considered to be an important factor influencing the physical properties<br />
including solubility, crystallinity, reactivity, gelation and liquid crystallinity. Moreover, -OH<br />
groups have the capacity to facilitate intra- and intermolecular interactions and to easily react<br />
with various reagents allowing the synthesis <strong>of</strong> derivatives, each <strong>of</strong> them showing a specific<br />
behavior and applications.<br />
Plasma treatment represents a modern technique to modify the wettability <strong>of</strong> paper surfaces in a<br />
controlled manner (Deslandes et al. 1998). Paper is a porous material which can be covered by<br />
polymer films in order to make it impermeable to water. Thus, plasma polymerization <strong>of</strong><br />
27
COST Action E54 Book<br />
hydrocarbon monomers like cyclohexane (Tu et al. 1994), carbon tetrafluoride (Denes et al.<br />
1995), plasma deposition <strong>of</strong> the hexamethyldisilazane (Tan et al. 2001), or fluorocarbon films<br />
(Vasmawani et al. 2005) have been demonstrated to make cellulose surfaces hydrophobic.<br />
Cellulose and lignocelluloses fibers, the so-called “bi<strong>of</strong>ibers”, <strong>of</strong>fer several advantages when<br />
combined with other polymers, such as giving lighter composites due to their low density;<br />
modest abrasivity, ensuring greater longevity <strong>of</strong> the materials during processing; improved<br />
mechanical properties (high modulus, strength and stiffness); little requirements on processing<br />
equipment, biodegradability and relatively low price (Joly et al. 1996; Zadorecki and Michell<br />
1989; Klemm et al. 2006; Henriksson and Berglund 2007; Iwamoto et al. 2007; Nisho 1994;<br />
Mohanty et al. 2000; Souza et al. 2004). However, cellulosic materials present some limitations<br />
since their highly polar and hydrophilic character lead both to poor compatibility (weak<br />
interfacial adhesion) with non-polar polymer matrices and to a decrease <strong>of</strong> mechanical properties<br />
due to greater atmospheric moisture adsorption. For these reasons, extensive efforts have been<br />
made in the last decades, in order (i) to provide an efficient hydrophobic barrier and (ii) to<br />
achieve an optimum interfacial adhesion with the non-polar polymer matrix. With this purpose a<br />
wide range <strong>of</strong> techniques are applied such as: (i) physical adsorption; (ii) chemical modification<br />
(etherification, esterification and grafting reactions); and (iii) physical treatments (UV radiation,<br />
corona, cold plasma, etc.).<br />
The plasma treatments <strong>of</strong> the cellulosic substrates (cellulose, lignocellulose and paper materials)<br />
by the use <strong>of</strong> various gases lead to improved surface properties such as mechanical properties<br />
(strength, hardness, wear, friction coefficient, abrasion resistance), electrical properties<br />
(dielectric coefficient, conductivity) and chemical properties (corrosion, oxidation, wettability<br />
and water repellance, flame retardancy, reactive dyeing etc.). These modifications are<br />
accompanied by production <strong>of</strong> barrier layers for chemicals, UV protection, anti-bacterial<br />
activity, etc. (Grace and Gerenser 2003).<br />
Different plasma procedures have been used to modify the cellulosic fibers from jute (Sabharwal<br />
et al. 1993), wood fibers (Olaru et al. 2005), and cotton fabrics (Almeida and Carneiro 2005).<br />
Totolin and co-workers (Totolin et al. 2008) reported the result <strong>of</strong> the grafting <strong>of</strong> flax or Spanish<br />
broom (Spartium junceum, syn. Genista juncea) fibers with different kinds <strong>of</strong> carboxylic acids<br />
under action <strong>of</strong> cold plasma discharges (Vasile et al. 2009).<br />
In case <strong>of</strong> cold plasma treatment <strong>of</strong> cellulosic materials (yarns, fibers, fabrics, dust) an increase<br />
<strong>of</strong> specific surface has been observed. For example, treatment <strong>of</strong> cotton fabrics in<br />
hexamethyldisiloxan plasma (HMDSO) was accompanied by an increase in surface roughness<br />
associated with increasing <strong>of</strong> wetting angle <strong>of</strong> water up to 130 °C, ensuring in this way a strong<br />
hydrophobic effect (Hocker 2002). Similarly, using hexafluoroethane plasma, fluorine was<br />
bound to the surface giving a waterpro<strong>of</strong> material. Hua et al. (1998) discussed the mechanisms<br />
<strong>of</strong> oxygen and argon-RF-plasma induced surface chemistry <strong>of</strong> pure cellulose samples and<br />
established that the mechanisms involve cleavage <strong>of</strong> macromolecular chain and pyranose ring<br />
and formation <strong>of</strong> C=O and O-CO-O groups. The external plasma parameters like RF-power<br />
and pressure <strong>of</strong> plasma gas have significant effect on the surface functionalization and these<br />
enable the control <strong>of</strong> substrate modification and characteristics. Totolin et al. (2007) obtained a<br />
durable flame retardant treatment on cotton fabrics.<br />
The aim <strong>of</strong> this paper is to present our trials to modify various cellulose substrates to obtain<br />
materials with improved properties both for the paper packaging materials or to increase their<br />
compatibility with other polymers.<br />
28
Materials and Methods<br />
COST Action E54 Book<br />
Three types <strong>of</strong> cellulosic substrates have been used to modify their surfaces by physical<br />
treatment: (a) unbleached (UBP) and bleached kraft pulps (BP) from s<strong>of</strong>twood (supplied by<br />
Södra Cell, Sweden for the COST Action E54 project). (b) cotton cellulose fibers (supplied by<br />
Arshad Enterprises, Pakistan); (b) two paper types: standard printer paper (80 g/m 2 ) and natural<br />
degraded old paper (60 g/m 2 , from old documents).<br />
Reagents used for cellulose grafting and chemical modification were: (1) fatty acids: butyric<br />
acid (B) (Merck, purity > 99%); oleic acid (O) (Aldrich, 90 % purity); (2) acrylic polymers like<br />
structures: methyl methacrylate (MMA), methyl acrylate (MeA), ethyl acrylate (EtA), buthyl<br />
acrylate (BuA), acrylamide (AA) (from Merck, purity > 99 %); (3) poly(amido-ethyl) phosphate<br />
(PAEP) synthesized in our institute according to the literature method (Albright and Wilson<br />
(1963). (Tm=60-80 o C, P%=23.8%, N%=11%) ; (4) paraformaldehyde (PF) (Fluka, 95% purity);<br />
(3) solvents: acetone, chlor<strong>of</strong>orm, ethyl alcohol, dimethylsulfoxide (DMSO) grade for synthesis.<br />
Plasma treatments<br />
The cellulose substrates were treated under cold plasma and atmospheric pressure plasma<br />
conditions.<br />
The experimental setup for cold plasma grafting <strong>of</strong> short fibers (horizontal plasma reactor), plane<br />
surfaces (paper, cotton fabrics) and for film deposition is presented in Figure 2.<br />
Figure 2. Laboratory experimental equipment for plane surfaces. RF plasma conditions used: 13.5 MHz<br />
and 200 W power, monomer pressure 0.3 mm Hg, 35 – 40 °C in purified air, discharge time 600 seconds<br />
Before treatment the fibers substrates (cellulose kraft pulp, cotton fibers, and paper) were<br />
impregnated with solutions <strong>of</strong> reactants. After treatment the cellulosic materials were extracted<br />
for 6 h in a Soxhlet extractor and then dried at 105 ºC for 24 hours.<br />
29
Investigation methods<br />
COST Action E54 Book<br />
The following techniques used in this paper to assess the modifications on the fibers surfaces<br />
were: ATR FT-IR spectroscopy, scanning electron microscopy (SEM), ESCA (XPS)<br />
spectroscopy, AFM surface analysis, thermogravimetry and contact angle measurements, ζ<br />
potential measurements (zeta potential) (SurPASS Electrokinetic Analyzer), as well as<br />
comparison <strong>of</strong> physical properties <strong>of</strong> treated and untreated samples. Other treatments and<br />
methods are given in the papers by Totolin et al. (2008) and Vasile et al. (2009)<br />
Results and Discussion<br />
Plasma treatments<br />
Treatment <strong>of</strong> cellulose substrates in cold plasma conditions<br />
Air-plasma treatments were done on some cellulose materials (cotton, paper) using the plasma<br />
device described in Figure 2.<br />
The FT-IR (ATR) spectra for untreated and plasma treated cotton samples evidenced that minor<br />
chemical changes appeared at the surface <strong>of</strong> the samples. However, appearance <strong>of</strong> an additional<br />
absorption band (1730 cm -1 ) in the carbonyl region due to the formation <strong>of</strong> aldehyde (-CHO) and<br />
carboxyl (-COOH) functional groups at the surface was seen (Totolin and Cazacu 2007; Malek<br />
and Holme 2003; Fisher 2004; Chen et al. 2004). The absorption at the level <strong>of</strong> –OH and βglucosidic<br />
groups were not modified; plasma did not affect the macromolecular chain and its<br />
degree <strong>of</strong> polymerization. The changes were not produced in depth but only at the surface; at the<br />
nanometric scale no more than a few macromolecular layers (Totolin and Cazacu 2007; Totolin<br />
2007).<br />
The appearance <strong>of</strong> the new functional groups (-CHO and –COOH) on the surface <strong>of</strong> the plasma<br />
treated cellulose fibers (cotton) was confirmed by the ESCA (XPS) spectroscopy (Totolin and<br />
Cazacu 2007). These functional groups are responsible for the changes in hydrophilic<br />
/hydrophobic balance and roughness <strong>of</strong> the surface. From data presented in Table 1 it can easily<br />
be observed that the peak areas assigned to carboxylic and carbonyl groups increase after plasma<br />
treatment. Also, it can be observed a decrease <strong>of</strong> the C–OH peak surfaces probably due to some<br />
cross-linking reactions which take place during plasma treatment. In the case <strong>of</strong> paper samples<br />
XPS gave the same conclusions.<br />
Table 1. Percentage areas <strong>of</strong> the component signal C 1s for cotton samples<br />
Signal<br />
Area, at%<br />
Control cotton fibers<br />
Area, at%<br />
Plasma treated cotton fibers<br />
-C-OH 56.30 42.90<br />
-C-O- 29.90 30.40<br />
-C-C- 5.40 5.30<br />
-COOH 8.40 15.30<br />
-CHO - 6.10<br />
In X-ray diffractogramms it can be observed that at 2θ < 30 o (higher d spacing) the diffraction<br />
peak intensity was higher for plasma treated cotton sample than for untreated ones, whereas for<br />
diffraction angles 2θ > 30 o (lower d spacing) the peak intensity decreased through plasma<br />
treatment (Figure 3a). The differences were not significant and the degree <strong>of</strong> crystallinity was<br />
30
COST Action E54 Book<br />
little affected by the oxidation and cross-linking processes as a consequence <strong>of</strong> the action <strong>of</strong><br />
plasma active species. In the case <strong>of</strong> the paper samples (Figure 3b) plasma did not affect<br />
structural change or crystallinity degree.<br />
a. b.<br />
Figure 3. X-ray diffractograms <strong>of</strong> the: (a). untreated and (b). plasma treated samples<br />
SEM analyses indicated that the topography <strong>of</strong> the natural fibers is complex and differentiated.<br />
Thus, the cotton fiber presents various shapes and cross-sections along a fiber (Figure 4a and b).<br />
The SEM micrographs <strong>of</strong> the treated cotton indicated no significant surface topographic change<br />
<strong>of</strong> the fibers. Both bulk and surface investigation methods were employed and the obtained data<br />
show that plasma acts only at the surface level within a depth <strong>of</strong> a few nanometers without<br />
affecting the interior paper structure.<br />
SEM images obtained for paper samples treated indicated that pulp from paper is very stable to<br />
the action <strong>of</strong> cold plasma.<br />
a.<br />
Figure 4. SEM images <strong>of</strong> cotton fibers: a – control cotton sample; b<br />
– cold plasma treated (30 min) cotton sample<br />
Grafting <strong>of</strong> cellulose substrates in cold plasma conditions<br />
- Plasma grafting cellulose kraft pulp with fatty acids<br />
The pH dependence <strong>of</strong> the zeta potential <strong>of</strong> cellulose fibers treated with different fatty acids<br />
(oleic acid-O; butyric acid-B) is shown in Figure 5.<br />
31<br />
b.
COST Action E54 Book<br />
Figure 5. Variation ζ potential vs. pH for bleached and unbleached kraft pulp<br />
a. b.<br />
One can observe the presence <strong>of</strong> a zeta potential plateau situated in the pH = 5-10 range. The ζ<br />
plateau value <strong>of</strong> treated bleached pulps was around –3.75 mV in comparison with the ζ plateau<br />
<strong>of</strong> control pulp (–1 mV), due to the distinct reactive groups (especially –COOH groups)<br />
introduced by the grafting process during plasma conditions.<br />
Figure 6. Variation <strong>of</strong> ζ (zeta) potential vs. conductivity for bleached and unbleached kraft pulp<br />
The unbleached pulp treated with butyric acid (UBP-B) has lower zeta potential plateau (-1.75<br />
mV) than that treated with oleic acid (UBP-O) (-2.6 mV), due to the grafting <strong>of</strong> short chain fatty<br />
acid on the fiber surface. The ζ potential decreased with increase <strong>of</strong> the conductivity (Figure 6).<br />
This suggests that zeta potential may be pH-independent at variable conductivity. The effect <strong>of</strong><br />
conductivity on ζ potential depends on the nature <strong>of</strong> the pulp and on treatment conditions.<br />
- Cold plasma grafting <strong>of</strong> cotton fibers with acrylamide<br />
Grafting reaction <strong>of</strong> cotton fibers with acrylamide took place in cold plasma installation<br />
presented in Figure 2 (Totolin and Cazacu 2007). The experiments were carried out according to<br />
a mathematic model <strong>of</strong> second order: compositional, rotating, centering, factorial, design<br />
(Cochran and Cox 1968). The influence <strong>of</strong> the parameters reaction time, power dissipated to the<br />
electrodes and the monomer solution concentration on the process was investigated (Simionescu<br />
and Macoveanu 1977). The optimal working parameters for the grafting process were as follows:<br />
reaction time 341 s, power dissipated 500W and monomer solution concentration 50%. By a<br />
model experiment polymerization <strong>of</strong> acrylamide on inert surfaces) it was established that the<br />
32
COST Action E54 Book<br />
monomer solution concentration was the most important factor, because it controls the deposited<br />
acrylamide layer thickness on the supports.<br />
In addition to the specific absorptions <strong>of</strong> the cellulose, the FT-IR spectra <strong>of</strong> the acrylamidegrafted<br />
cotton fibres also gave vibrations due to the grafted structures: 3182 cm -1 (ν CO-NH-<br />
CO), 1660 cm -1 (ν NH), and 1450 cm -1 , 1410 cm -1 (ν CO-NHR). Elemental analysis confirmed<br />
the presence <strong>of</strong> 5-9% nitrogen on the cellulose.<br />
The plasma-grafting processes lead to important changes in the physico-mechanical properties <strong>of</strong><br />
the cellulose fibers as seen in Table 2.<br />
Table 2. Physico-mechanical indices <strong>of</strong> the grafted cellulose<br />
Sample<br />
Grafting degree,<br />
%<br />
Tensile strength,<br />
kN/mm 2<br />
Elongation at break,<br />
%<br />
Cellulose - 2.40 8.7<br />
Cellulose-g-AAm 33 2.24 8.2<br />
Cellulose-g-AAm 40 2.11 8.0<br />
Cellulose-g-AAm 50 2.09 6.2<br />
It clearly appears that the tensile strength <strong>of</strong> the grafted fibers diminished noticeably, in<br />
comparison with the support polymer, probably due to side destruction reactions and insertion <strong>of</strong><br />
the polyacrylamide in the volume <strong>of</strong> the grafted cellulose. Low elongation percentage values <strong>of</strong><br />
the grafted polymers can be connected to the formation <strong>of</strong> three-dimensional structures in the<br />
case <strong>of</strong> the high degrees <strong>of</strong> grafting.<br />
Also, an improved water absorption in various relative humidity conditions was recorded<br />
(Figure 7) together with increased wetting heat values (69-79 J/g).<br />
Figure 7. Various relative humidity<br />
vs. water absorption data for grafted<br />
cellulose<br />
The action <strong>of</strong> plasma on cellulose (C) is shown by the appearance on the surface <strong>of</strong> the fibers <strong>of</strong><br />
–COOH groups in the treated cellulose (Ctp) and <strong>of</strong> -NH groups in the case <strong>of</strong> grafted samples;<br />
these groups are responsible for water absorption and <strong>of</strong> wetting properties. The high grafted<br />
celluloses (40% and 50%) present the lower water absorption values in respect with the sample<br />
with degree <strong>of</strong> grafting <strong>of</strong> 33 %, probably because some supplementary cross-linking reactions<br />
which took place during plasma treatment.<br />
33
COST Action E54 Book<br />
- Plasma polymer thin films deposition on cellulose supports<br />
After the sample (paper sheet <strong>of</strong> 15x70 mm - Standard line printer paper <strong>of</strong> 80 g/m 2 ) was<br />
introduced into the plasma reactor (Fig. 2), the chamber was evacuated to less than 0.3 mm Hg.<br />
The pure acrylic monomer from the flask was then introduced at steady flow conditions. After<br />
deposition in the plasma reactor, paper sheets coated with films based on poly-methyl<br />
methacrylate (PMMA), poly-methyl acrylate (PMeA), poly-ethyl acrylate (PEtA) and polybuthyl<br />
acrylate (PBuA) were kept in the vacuum desiccator before analysis. Figure 8 shows the<br />
average quantity <strong>of</strong> polymer deposited on surface as a function <strong>of</strong> the reaction time. The average<br />
thickness <strong>of</strong> deposited polymer layer decreased in the order: PMeA > PEtA > PBuA > PMMA.<br />
Figure 8. Polymer average deposition vs.<br />
discharge time in plasma polymerization:<br />
1 PMMA<br />
2 PBuA<br />
3 PEtA<br />
4 PMeA<br />
The ATR-FTIR spectra <strong>of</strong> the thin films deposited on paper sheet samples revealed a similar<br />
structure as with the conventional polymers. The ATR-FTIR spectra <strong>of</strong> all the samples show a<br />
typical broad band in the range <strong>of</strong> 3330 cm -1 corresponding to the OH bending vibration in<br />
cellulose (Table 3).<br />
Table 3. Frequencies, relative intensity and assignments <strong>of</strong> absorption bands for the studied samples<br />
Wave number, cm<br />
x) xx<br />
S - strong; W –weak; ) ν - stretching; β - bending; δ - bending out-<strong>of</strong> plane<br />
-1<br />
Relative intensity x<br />
Assignments xx<br />
~3330 broad ν (O-H)<br />
~ 2910 - 2970 S ν (C-H aliphatic)<br />
1731 S ν (C=O)<br />
~ 1640 - 1660 W Aldehyde groups in cellulose<br />
~1420 - 1450 S β(C-H aliphatic)<br />
~1251 W ν (C-O ester)<br />
~1100 - 1200 S δ(C-H aliphatic)<br />
~1024 S ν (C-C ethyl)<br />
850 W ν (C-C ethyl)<br />
For all the analyzed samples, the presence <strong>of</strong> C=O group was confirmed by the characteristic<br />
sharp carbonyl stretching peak at 1731 cm -1 , while the band at ~1251 cm -1 shows the presence <strong>of</strong><br />
C-O bond (stretching); the band at ~1024 cm -1 is assigned to ethyl group (stretching C-C).<br />
34
COST Action E54 Book<br />
The AFM images <strong>of</strong> the reference sample (Figure 9a) showed typical fibrillar morphology <strong>of</strong><br />
cellulose in paper sheets, while those <strong>of</strong> the paper sheets coated with (PP) films showed some<br />
modifications and differences. Thus, the surface topography imaging <strong>of</strong> PMMA coated paper<br />
(Figure 9b) revealed how the polymer penetrated into the paper substrate and filled the pores, the<br />
resulting morphology following the fibrous template cellulose support. An insignificant decrease<br />
<strong>of</strong> RMS value (Table 4 scanned area <strong>of</strong> 10 µm x10 µm) in comparison with reference paper<br />
sheet was obtained.<br />
(a) (b)<br />
Figure 9. AFM images (3D) <strong>of</strong>: (a) reference paper sheet; (b) (PP) PMMA coated paper sheet<br />
Table 4. RMS surface roughness and contact angle for the investigated samples<br />
Sample RMS, nm<br />
Average contact angle, degree<br />
Reference paper sheet 113.8 Instantaneous absorption<br />
PMMA coated paper 112.9 92<br />
PMeA coated paper 125.8 95<br />
PEtA coated paper 171.5 96<br />
PBuA coated paper 125.9 97<br />
In the case <strong>of</strong> PMeA coated paper sheet it can be noticed that the RMS value slightly increased<br />
in comparison with reference sample, accompanied by an evolution <strong>of</strong> the surface morphology.<br />
The result <strong>of</strong> plasma polymerization with thin film deposition is an isotropic oriented structure.<br />
For PEtA coated paper sheet it can be remarked a more significant increase <strong>of</strong> the RMS value,<br />
while for PBuA sample a small increase <strong>of</strong> the RMS value was obtained, together with evolution<br />
<strong>of</strong> the surface morphology in relation to the reference sample. Unlike the other studied samples<br />
<strong>of</strong> coated paper, the morphological structure formed in this latter case was branched.<br />
The contact angle with water droplets onto the films deposited on paper sheets was used to<br />
estimate the film protective properties against water and water vapors and the result is presented<br />
in Table 4. This concept is important not only because it can <strong>of</strong>fer information on the plasma<br />
treated surface energies but also on wettability.<br />
For the reference paper sheet the hydrophilicity is relevant, the droplet being instantaneously<br />
absorbed by the support, without the capability for optical recording <strong>of</strong> the contact angle. In the<br />
case <strong>of</strong> PMMA, PMeA, PEtA or PBuA deposited on paper sheets, relative to the reference paper,<br />
the average contact angle had increased values, in the range <strong>of</strong> 92 – 97 o .<br />
35
Conclusions<br />
COST Action E54 Book<br />
Radio-frequency electrical discharges are suitable for the surface modification <strong>of</strong> cellulose<br />
substrates they leading to the implantation upon the cellulosic substrate surface <strong>of</strong> the different<br />
functionalities at superficial level changing <strong>of</strong> their quality. The modifications performed are<br />
dependent <strong>of</strong> samples characteristics, type <strong>of</strong> substrate and the treatment time.<br />
Spectral, physical and chemical analyses show formation <strong>of</strong> graft-copolymers and the polymeric<br />
nature <strong>of</strong> the grafts. The modifications and grafting processes develop on the material surface<br />
only, the bulk properties being unaffected. In the conditions applied, the plasma did not give a<br />
degradative effect and the integrity <strong>of</strong> the substrate was preserved.<br />
The investigations on plasma treated cellulose fibers were focused on obtaining fibers with new<br />
or significantly improved properties, with tailored functionalities for special applications,<br />
starting from natural fibers.<br />
Acknowledgements: The EU COST Action E54 “Characterisation <strong>of</strong> the fine structure and<br />
properties <strong>of</strong> papermaking fibres using new technologies” and CNCSIS through IDEI project<br />
17/2007 is acknowledged for financial support.<br />
References<br />
Albright & Wilson Ltd. (1963): Improvements relating to the manufacture <strong>of</strong> polycondensation products.<br />
GB 931146 (A)<br />
Almeida L. and Carneiro N. (2005): Corona treatment, enzyme finishing and application <strong>of</strong> corona<br />
discharge to the pretreatment <strong>of</strong> cotton fabrics PLASMA COST 628 Meeting, Bucharest, Romania, 17-<br />
18th, March 2005<br />
Atalla R. H. (1999): Celluloses, In Comprehensive Natural Products Chemistry, D. Barton, K. Nakanishi,<br />
O. Meth-Cohn, Eds., Vol. 3, Carbohydrates and Their Derivatives Including Tannins, Cellulose, and<br />
Related Lignins, Ed. B. Mario Pinto, Elsevier, Canada, p. 529<br />
Chen Y.Y., Lin H., Ren Y., Wang H.W. and Zhu L. J. (2004): Study on Bombyx mori silk treated by<br />
oxygen plasma. J. Zhejiang Univ. Sci. 5(8), 918-922<br />
Coats A.W. and Redfern J.T. (1964): Kinetic parameters from thermogravimetric data. Nature (London),<br />
201, 68-69<br />
Cochran W.G. and Cox G.M. (1968): Experimental Designs. Wiley & Sons Inc. New York, p. 335-350<br />
Denes F., Hua Z.Q., Barrios E. and Young R.A. (1995): Influence <strong>of</strong> RF-cold plasma treatment on the<br />
surface properties <strong>of</strong> paper. J. Macromol. Sci. Pure Appl. Chem. A32, 1405-1443<br />
Deslandes Y., Pleizier G., Poire E., Sapieha S., Wertheimer M.R. and Sacher E. (1998): The surface<br />
modification <strong>of</strong> pure cellulose paper induced by low-pressure nitrogen plasma treatment. Plasmas and<br />
Polymers 3, 2, 61-76<br />
Fisher E.R. (2004): A review <strong>of</strong> plasma-surface interactions during processing <strong>of</strong> polymeric materials<br />
measured using the IRIS technique. Plasma Process. Polym. 1, 13-27<br />
Grace J. M. and Gerenser L. J. (2003): Plasma treatment <strong>of</strong> polymers. J Dispersion Sci Technol 24 (3-4),<br />
305-341<br />
36
COST Action E54 Book<br />
Henriksson M. and Berglund L.A. (2007): <strong>Structure</strong> and properties <strong>of</strong> cellulose nanocomposite films<br />
containing melamine formaldehyde. J Appl. Polym. Sci. 106, 2817–2824<br />
Höcker H. (2002): Plasma treatment <strong>of</strong> textile fibers. Pure Appl. Chem. 74, 3, 423-427<br />
Hua Z.Q., Sitaru R., Denes F. and Young R. A. (1997): Mechanisms <strong>of</strong> oxygen- and argon-RF-plasmainduced<br />
surface chemistry cellulose. Plasmas and Polymers 2(3), 199-224<br />
Iwamoto S., Nakagaito A.N. and Yano H. (2007): Nano-fibrillation <strong>of</strong> pulp fibers for the processing <strong>of</strong><br />
transparent nanocomposites. Appl. Phys. A-Mater Sci. Process 89, 461–466<br />
Joly C., K<strong>of</strong>man M. and Gauthier R.J. (1996): Polypropylene/cellulose fiber composites chemical<br />
treatment <strong>of</strong> the cellulose assuming compatibilization between the two materials. J. Macromol. Sci.-Pure<br />
Appl. Chem. A33 (12), 1981-1996<br />
Klemm D., Schumann D., Kramer F., Hessler N., Hornung M., Schmauder H.P. and Marsch S. (2006):<br />
Nanocelluloses as innovative polymers in research and application. Polysaccharides 205, 49–96<br />
Malek R.M.A. and Holme I. (2003): The effect <strong>of</strong> plasma treatment on some properties <strong>of</strong> cotton. Iranian<br />
Polym. J. 12(4), 271-280<br />
Mohanty A. K., Misra M. and Hinrichsen G. (2000): Bi<strong>of</strong>ibres, biodegradable polymers and<br />
biocomposites: An overview. Macromolecular Mater. Eng. 276/277, 1-24<br />
Nisho Y. (1994): Hyperfine composites <strong>of</strong> cellulose with synthetic polymers. In Cellulosic Polymers,<br />
Blends and Composites. Ed: R.D. Gilberst, Hanser Publishers, New York, p. 95-113<br />
Oehr C., Müller M., Elkin B., Hegemann D. and Vohrer U., (1999): Plasma grafting – a method to obtain<br />
mon<strong>of</strong>unctional surfaces. Surf. Coat. Technol. 116-119, 25-35<br />
Olaru N., Olaru L. and Cobiliac G. (2005): Plasma-modified wood fibers as fillers in polymeric materials.<br />
Rom. J. Phys. 50(9–10), 1095-1101<br />
Petreus O., Bubulac T., Petreus I. and Cazacu G. (2003): Reactions <strong>of</strong> some phosphorus compounds with<br />
cellulose dissolved in aqueous alkaline solution. J. Appl. Polym. Sci. 90, 327-333<br />
Rozmarin G. (1984): Macromolecular Fundaments <strong>of</strong> Wood Chemistry. Technical Editure, Bucuresti, pp.<br />
34, 45<br />
Sabharwal H.S., Denes F., Nielsen L. and Young R.A. (1993): Free-radical formation in jute from argon<br />
plasma treatment. J. Agric. Food Chem. 41, 2202-2207<br />
Simionescu C.I. and Macoveanu M.M. (1977): The effects <strong>of</strong> radi<strong>of</strong>requency electrical discharge in<br />
cotton cellulose. Cell. Chem. Technol. 11, 87-89<br />
Souza Lima M.M. and Borsali R. (2004): Rodlike cellulose microcrystals: structure, properties and<br />
applications. Macromol. Rapid Comm. 25, 771-787<br />
Tan I.T., da Silva M.L.P. and Demarquette N.R. (2001): Paper surface modification by plasma deposition<br />
layers <strong>of</strong> organic silicon compounds. J. Mater. Chem. 11, 1019-1025<br />
Totolin M., Macocinschi D., Ioanid G. E., Filip D. and Ioanid A. (2007): Materials supports for cultural<br />
heritage objects treated in cold plasma. Optoelectronics and Advanced Materials – Rapid<br />
Communications 1 (12), 722-728<br />
Totolin M. I. (2007): Fourier-transformed infrared spectroscopy, In Cold Plasma in Material’s Treatment.<br />
From Fundamental to Applications. Eds: M. I. Totolin, I. Neamtu, G. I. Ioanid. Published by<br />
Performantica, Iasi, Romania, p. 145-180<br />
37
COST Action E54 Book<br />
Totolin M.I. and Cazacu G. (2007): Natural polymer modification under radi<strong>of</strong>requency electrical<br />
discharge conditions. In Plasma Chemistry and Natural Polymers, Ed: M. Totolin, p. 77-102<br />
Totolin M. I., Vasile C., Tibirna M. C. and Popescu M. C. (2008): Grafting <strong>of</strong> Spanish broom (Spartium<br />
junceum) fibers with fatty acids under cold plasma conditions. Cell. Chem. Technol. 42(7-8), 317-333<br />
Tu X., Young R.A. and Denes F. (1994): Improvement <strong>of</strong> bonding between cellulose and polypropylene<br />
by plasma treatment. Cellulose 1, 87-106<br />
Vasile C., Totolin M.I. and Tibirna M.C. (2009): Grafting <strong>of</strong> some bio-fibres with carboxylic acids under<br />
cold plasma conditions. In Chemistry and Biochemistry: From Pure to Applied Science Eds: E. M. Pearce<br />
and G. E. Zaikov, New Horizons, vol. 3, Nova Science Publishers, INC, p. 9 – 40<br />
Vaswani S., Koskinen J. and Hess D.W. (2005): Surface modification <strong>of</strong> paper and cellulose by plasmaassisted<br />
deposition <strong>of</strong> fluorocarbon films. Surface & Coatings Technol. 195, 121-129.<br />
Zadorecki P. and Michell A.J. (1989): Future prospects for wood cellulose as reinforcement in organic<br />
polymer composites. Polym. Compos. 10, 69-77<br />
38
COST Action E54 Book<br />
SURFACE ENERGETICS OF SOFTWOOD KRAFT PULPS BY INVERSE<br />
GAS CHROMATOGRAPHY<br />
1* José A. F. Gamelas, 2 José M. R. C. A. Santos and 1 Paulo J. Ferreira<br />
1 Departamento de Engenharia Química, Universidade de Coimbra, Pólo II – R. Sílvio Lima,<br />
3030-790 Coimbra, Portugal<br />
2 CeNTI-Centre for Nanotechnology and Smart Materials, Rua Fernando Mesquita 2785, 4760-<br />
034 VN Famalicão, Portugal<br />
Abstract<br />
*jafgas@eq.uc.pt<br />
The results <strong>of</strong> the analysis <strong>of</strong> a s<strong>of</strong>twood kraft pulp by inverse gas chromatography (IGC) are<br />
presented. The effect <strong>of</strong> the beating process on the surface energy properties <strong>of</strong> this pulp was<br />
also assessed. The dispersive component <strong>of</strong> the surface energy, the enthalpy and the entropy <strong>of</strong><br />
adsorption with apolar and polar probes, and the Lewis acid-base constants, Ka and Kb, were<br />
determined. The value <strong>of</strong> the dispersive component <strong>of</strong> the surface energy at 40 °C was<br />
41.7 mJ/m 2 , and after beating it was 44.7 mJ/m 2 . For both unbeaten and beaten pulps, the highest<br />
specific component <strong>of</strong> the entalphy <strong>of</strong> adsorption, -�Ha s , was obtained with acetone, indicating<br />
an amphoteric behaviour <strong>of</strong> the corresponding surfaces. Nonetheless, the ratios -�Ha s (THF)/-<br />
�Ha s (TCM) and Wa s (THF)/Wa s (TCM) were always higher than 1, suggesting the presence <strong>of</strong><br />
surfaces with a more acidic than basic character. A decrease <strong>of</strong> the basicity constant (Kb) with<br />
beating was observed, while the acidity constant (Ka) was nearly the same before and after<br />
beating. The results presented in this work are comparable with those reported in the literature<br />
for other bleached kraft pulps.<br />
Keywords: IGC; pine; spruce; beating; bleached kraft pulps; surface energy; acid-base<br />
Introduction<br />
IGC (inverse gas chromatography) has been widely used to study the thermodynamics <strong>of</strong><br />
adsorption and the surface properties <strong>of</strong> organic and inorganic materials (Conder and Young<br />
1979; Santos and Guthrie 2005). This technique is based on the physical adsorption <strong>of</strong> a wellknown<br />
probe by a solid surface. From the elution peak, the retention time and the peak shape<br />
provide information about the adsorption process. IGC allows the determination <strong>of</strong> enthalpy, free<br />
energy, and entropy <strong>of</strong> adsorption. The London dispersive component <strong>of</strong> the surface energy<br />
(Kamdem and Riedl 1991; 1992) and the acid-base surface properties (Saint Flour and Papirer<br />
1982; Shultz et al. 1987) <strong>of</strong> the stationary phase can also be obtained by IGC. It should be noted<br />
that the dispersive and polar component <strong>of</strong> the surface energy can be obtained from classical<br />
contact-angle measurements. However, the surface roughness, the presence <strong>of</strong> pores, and surface<br />
energy gradients <strong>of</strong> some materials make the contact angle method not so adequate for rigorous<br />
surface energetics measurements (Riedl and Kamdem 1992). An alternative route for estimating<br />
the surface energy and the acid-base surface properties is based on the IGC technique.<br />
Several studies have been reported previously regarding the use <strong>of</strong> IGC for the study <strong>of</strong><br />
cellulose, wood fibres from pulping and bleaching processes, paper samples, among other<br />
materials (Gurnagul and Gray 1985; Lee and Luner 1989; Kamdem and Riedl 1991; 1992; Felix<br />
and Gatenholm 1993; Jacob and Berg 1994; Belgacem et al. 1995, Belgacem et al. 1996;<br />
Tshabalala 1997; Shen et al. 1998; Shen and Parker 1999; Belgacem 2000; Santos et al. 2001;<br />
Carvalho et al. 2005a; 2005b; Megiatto et al. 2007; Mills et al. 2008). For instance, bleached<br />
39
COST Action E54 Book<br />
Eucalyptus globulus kraft pulps showed values for the dispersive component <strong>of</strong> the surface<br />
energy (�s d ) at 40 °C <strong>of</strong> 35-45 mJ/m 2 , and an amphoteric character with more acidic than basic<br />
properties (Shen et al. 1998; Carvalho et al. 2005a; 2005b). On the other hand, beating <strong>of</strong> the<br />
fibres lead to an increase <strong>of</strong> the �s d value as well as the Lewis acidic character <strong>of</strong> the surface<br />
(Carvalho et al. 2005b). The cooking and bleaching processes may also influence the final<br />
surface properties <strong>of</strong> the pulps (Shen and Parker 1999; Carvalho et al. 2005b). The introduction<br />
<strong>of</strong> an oxygen delignification stage prior to bleaching has enhanced the Lewis acidic character <strong>of</strong><br />
the fibres.<br />
In this paper, the analysis by IGC <strong>of</strong> a s<strong>of</strong>twood kraft pulp, before and after beating, will be<br />
reported. The dispersive component <strong>of</strong> the surface energy was determined by the measurement<br />
<strong>of</strong> the interaction with a series <strong>of</strong> n-alkanes. The specific component <strong>of</strong> the enthalpy <strong>of</strong><br />
adsorption <strong>of</strong> Lewis acidic probes and <strong>of</strong> Lewis basic probes on the pulps, together with the<br />
acidity (Ka) and basicity (Kb) constants <strong>of</strong> the surfaces, were also determined.<br />
Experimental<br />
A bleached kraft pulp (Södra Cell, Sweden, Common Pulp II), as dry, containing 81% <strong>of</strong> spruce<br />
fibres and 19% <strong>of</strong> pine fibres was analysed before (A) and after beating (B). Pulp was refined in<br />
a pilot disc refiner at PTS - Papiertechnische Stiftung (Germany), using a cutting angle <strong>of</strong> 60°, a<br />
specific edge load <strong>of</strong> 2 W.s/m and a cutting length/ per second <strong>of</strong> 2.85 km/s. Before analysis by<br />
IGC, the samples were previously air dried in laboratory and milled in order to obtain a pulp <strong>of</strong><br />
granular structure with small size.<br />
A DANI GC 1000 digital pressure control (DPC) gas chromatograph, equipped with a hydrogen<br />
flame ionization detector (FID), was used for IGC data collection. Stainless steel columns, 0.5 m<br />
long and 0.4 cm inside diameter, were degreased, washed and dried before packing. 1.5–2.0 g <strong>of</strong><br />
sample were packed into the GC columns using a vacuum pump. The columns were shaped in a<br />
smooth ‘‘U” shape to fit the detector/injector geometry <strong>of</strong> the instrument. The packed columns<br />
were conditioned overnight at 105 °C, under a helium flow, before any measurements were<br />
made. This procedure was used to remove any volatiles, including water molecules, adsorbed on<br />
the stationary phase surface and that, consequently, could affect the retention <strong>of</strong> the probe<br />
molecules.<br />
Experiments were carried out at a column temperature between 40 and 55 °C with increments <strong>of</strong><br />
5 °C. The injector and detector were kept at 180 and 200 °C, respectively. Helium was used as<br />
carrier gas and its flow was selected to ensure that neither absorption nor diffusion <strong>of</strong> the probes<br />
would occur inside the column stationary phase. Small quantities <strong>of</strong> probe vapour (
Intensity (V)<br />
7000<br />
6000<br />
5000<br />
4000<br />
3000<br />
2000<br />
1000<br />
0<br />
0.774<br />
COST Action E54 Book<br />
t r = 1.006 min<br />
1.238<br />
0.0 0.5 1.0 1.5 2.0 2.5<br />
Time (min)<br />
Figure 1. Determination <strong>of</strong> the retention time using the Conder and Young method for ETA on pulp B at<br />
40 °C<br />
Results and Discussion<br />
IGC data analysis<br />
The net retention volume Vn, which is the volume <strong>of</strong> inert carrier gas that is necessary to push<br />
the probe molecule through the chromatographic column containing the solid sample, depends<br />
on the sample–probe interactions and can be calculated from IGC data using Equation 1. Here, tr<br />
is the retention time <strong>of</strong> the injected probe through the column, t0 is the retention time <strong>of</strong> the noninteracting<br />
probe (methane), F is the flow rate <strong>of</strong> the inert carrier gas (measured with a digital<br />
flow meter), and J is the James–Martin compression correction factor, determined by Equation<br />
2. Here, P1 is equal to Pa (atmospheric pressure) plus the pressure drop in the column (Chtourou<br />
et al. 1995).<br />
� ( t � t ) F J<br />
(1)<br />
Vn r o<br />
2<br />
3 [ 1�<br />
( P1<br />
/ Pa<br />
) ]<br />
J � (2)<br />
3<br />
2 [ 1�<br />
( P / P ) ]<br />
1<br />
a<br />
Assuming that the experiments take place at infinite dilution, the free energy <strong>of</strong> adsorption <strong>of</strong> the<br />
probe on the stationary phase surface, per mole, �Ga, can be determined from the retention<br />
volume, Vn, according to Equation 3. R is the gas constant and T is the column absolute<br />
temperature. The constant K is dependent on the chosen reference state (Dorris and Gray 1980;<br />
Santos and Guthrie 2005).<br />
ΔGa � �RT<br />
ln( Vn<br />
) � K<br />
(3)<br />
On the other hand, the free energy <strong>of</strong> adsorption can be related to the work <strong>of</strong> adhesion, Wa,<br />
according to Equation 4, where N is the Avogadro number and a is the surface area <strong>of</strong> the probe<br />
(Dorris and Gray 1980; Santos and Guthrie 2005).<br />
41
a<br />
a<br />
COST Action E54 Book<br />
� �G<br />
� N.<br />
a.<br />
W<br />
(4)<br />
If only dispersive interactions occur, the work <strong>of</strong> adhesion is given by Equation 5, where �s d and<br />
�l d are the dispersive components <strong>of</strong> the surface energy <strong>of</strong> the interacting solid and probe,<br />
respectively.<br />
W � 2 γ . γ<br />
(5)<br />
a<br />
d<br />
s<br />
d<br />
l<br />
Thus, based on Equations 3, 4 and 5, the net retention volume Vn can be related to the dispersive<br />
components, �s d and �l d , by Equation 6.<br />
RT ln( V<br />
n<br />
d<br />
d<br />
) � γ 2 N.<br />
a γ � K<br />
(6)<br />
s<br />
l<br />
According to Equation 6, it is possible to estimate the dispersive component <strong>of</strong> the surface <strong>of</strong> the<br />
sample, from the slope <strong>of</strong> the linear fit <strong>of</strong> RT ln(Vn) as a function <strong>of</strong> 2N�a(�l d ) 0.5 , using the IGC<br />
data obtained with the apolar probes. It should be noted that the dispersive component <strong>of</strong> the<br />
surface energy represents the potential <strong>of</strong> materials to undergo London dispersion interactions.<br />
If a Lewis acid–Lewis base interaction occurs, as is the case with polar probes, there will be a<br />
corresponding specific component contribution, �Ga s , in addition to the dispersive component, to<br />
the overall free energy <strong>of</strong> adsorption, �Ga (Santos and Guthrie 2005). The overall free energy <strong>of</strong><br />
adsorption, �Ga, is related to the net retention volume by Equation 3. Therefore, the free energy<br />
<strong>of</strong> adsorption that is caused by specific interactions, �Ga s , can be estimated by calculating the<br />
difference between the values <strong>of</strong> RT ln(Vn), obtained for the polar probes and the corresponding<br />
estimation for the apolar probe. The graphical method is represented in Figure 2.<br />
RTln(V n) (mJmol -1 )<br />
1.2E+07<br />
1.0E+07<br />
8.0E+06<br />
6.0E+06<br />
4.0E+06<br />
2.0E+06<br />
0.0E+00<br />
-2.0E+06<br />
-4.0E+06<br />
polar probe (THF)<br />
-�G a s<br />
C6<br />
0.0E+00 2.0E+06 4.0E+06 6.0E+06<br />
2N .a ( � l d ) 0.5 ((mJ) 0.5 m.mol -1 ))<br />
C7<br />
C8<br />
Figure 2. Determination <strong>of</strong> -�Ga s for the basic probe THF in pulp A at 40 °C<br />
C9<br />
C10<br />
If the experiments take place at different temperatures, it is possible to calculate the specific<br />
component <strong>of</strong> the enthalpy <strong>of</strong> adsorption, �Ha s , and the specific component <strong>of</strong> the entropy <strong>of</strong><br />
adsorption, �Sa s , by plotting �Ga s versus 1/T (Equation 7). On the other hand, the enthalpy <strong>of</strong><br />
adsorption, �Ha s , is related to the electron acceptor and electron donor parameters <strong>of</strong> the solid<br />
surface, Ka and Kb, by Equation 8 (Saint Flour and Papirer 1982; Shultz et al. 1987; Chtourou et<br />
al. 1995; Santos and Guthrie 2005). Ka is the Lewis acidity constant and Kb is the Lewis basicity<br />
constant. DN and AN* are the Gutmann’s electron donor and electron acceptor numbers,<br />
42
COST Action E54 Book<br />
respectively, <strong>of</strong> the acid-base probe (Gutmann 1978; Riddle and Fowkes 1990). Thus, Ka and Kb<br />
can be graphically determined by plotting -�Ha s /AN* versus DN/AN*. According to Equation 8,<br />
Ka is obtained as the slope <strong>of</strong> the linear fit, whereas Kb is the origin <strong>of</strong> such plot.<br />
�G<br />
T<br />
s<br />
a<br />
�H<br />
�<br />
T<br />
s<br />
a<br />
� �S<br />
s<br />
a<br />
s<br />
� �H<br />
� K DN � K AN *<br />
(8)<br />
a<br />
a<br />
b<br />
The physical properties <strong>of</strong> the probes used in this work are listed in Table 1 (Riddle and Fowkes<br />
1990; Kamdem et al. 1993; Santos and Guthrie 2005).<br />
Table 1. Properties <strong>of</strong> the probes used in the calculation <strong>of</strong> the surface energy parameters by IGC<br />
Probe a (Å 2 ) �l d (mJ/m 2 )<br />
C6 51.5 18.4<br />
C7 57.0 20.3<br />
C8 63.0 21.3<br />
C9 69.0 22.7<br />
C10 75.0 23.4<br />
(7)<br />
AN* (KJ/mol) DN (KJ/mol)<br />
DCM 31.5 27.6 16.4 0<br />
TCM 44.0 25.0 22.7 0<br />
Acetone 42.5 16.5 10.5 71.4<br />
THF 45.0 22.5 2.1 84.4<br />
ETA 48.0 19.6 6.3 71.8<br />
Results <strong>of</strong> the pulps analysis by IGC<br />
Table 2 presents details <strong>of</strong> the retention times, for each probe, in each sample (unbeaten pulp A<br />
and beaten pulp B) obtained at 40 °C.<br />
The dispersive component <strong>of</strong> the surface energy was determined at several temperatures, in the<br />
range 40-55 °C, based on the retention times obtained for a series <strong>of</strong> n-alkanes (C6, C7, C8, C9,<br />
and C10). The values determined at 40 °C were <strong>of</strong> 41.7 and 44.7 mJ/m 2 for pulps A and B,<br />
respectively. Values <strong>of</strong> the dispersive component <strong>of</strong> the surface energy in the range <strong>of</strong> 38-45<br />
mJ/m 2 have been reported for bleached Eucalyptus globulus kraft pulps (Shen et al. 1998;<br />
Carvalho et al. 2005a; 2005b), and for a bleached sulphite pulp, obtained from 60% beech wood<br />
and 40% birchwood (Felix and Gatenholm 1993). Moreover, values in the range <strong>of</strong> 43-48 mJ/m 2 ,<br />
at similar temperature, have also been obtained for samples <strong>of</strong> purified �-cellulose fibres<br />
(Belgacem et al. 1995; Belgacem et al. 1996; Tshabalala 1997). Therefore, the values obtained in<br />
this work for bleached s<strong>of</strong>twood kraft pulps are close to those reported for other cellulosic<br />
materials, and confirm the dominant presence <strong>of</strong> cellulose at the fibre surface. The decrease <strong>of</strong><br />
the �s d value with beating has been previously observed for bleached Eucalyptus globulus kraft<br />
pulps (45.0 and 48.2 mJ/m 2 before and after beating, respectively) (Carvalho et al. 2005b). In<br />
addition, �s d was found to decrease with the increase <strong>of</strong> temperature (up to 55 °C) for both pulps<br />
(Figure 3). The d�s d /dT values obtained were <strong>of</strong> -0.33 mJm -2 K -1 and -0.31 mJm -2 K -1 , for pulps A<br />
and B, respectively.<br />
43
COST Action E54 Book<br />
Table 2. Retention times at 40 °C for the different probes in pulps A and B<br />
Retention time (min) Pulp A Pulp B<br />
� s d (mJ/m 2 )<br />
Methane 0.343 � 0.000 0.263 � 0.000<br />
C6 0.385 � 0.002 0.318 � 0.001<br />
C7 0.462 � 0.002 0.433 � 0.000<br />
C8 0.699 � 0.002 0.792 � 0.004<br />
C9 1.388 � 0.004 1.836 � 0.011<br />
C10 3.525 � 0.033 5.199 � 0.005<br />
DCM 0.371 � 0.002 0.303 � 0.000<br />
TCM 0.411 � 0.003 0.357 � 0.000<br />
Acetone 0.512 � 0.013 0.589 � 0.007<br />
THF 0.626 � 0.017 0.805 � 0.014<br />
ETA 0.732 � 0.018 0.991 � 0.050<br />
44<br />
42<br />
40<br />
38<br />
36<br />
34<br />
32<br />
30<br />
A<br />
R 2 = 0.920<br />
30 40 50 60<br />
T (ºC)<br />
Figure 3. values <strong>of</strong> �s d at several temperatures for pulps A (A) and B (B)<br />
� s d (mJ/m 2 )<br />
45<br />
43<br />
41<br />
39<br />
37<br />
35<br />
B<br />
R 2 = 0.977<br />
30 40 50 60<br />
T (ºC)<br />
The enthalpy <strong>of</strong> adsorption and the entropy <strong>of</strong> adsorption <strong>of</strong> the apolar probes were also<br />
calculated based on the variations <strong>of</strong> -�Ga/T versus 1/T for each n-alkane (Figure 4). The results<br />
are presented in Table 3. The greater the value <strong>of</strong> -�Ha, the greater is the interaction intensity<br />
between the probe molecules and the solid’s surface. Therefore, it can be concluded that that the<br />
interaction intensity increases in the order: n-hexane < n-heptane < n-octane < n-nonane < ndecane,<br />
as expected. The entropy <strong>of</strong> adsorption is lower than zero for all the n-alkanes, which<br />
agrees well with expectation since during adsorption the system goes from a less ordered phase<br />
(gas) to a more ordered adsorbed phase.<br />
44
��G a/T( mJmol -1 K -1 )<br />
100000<br />
90000<br />
80000<br />
70000<br />
60000<br />
50000<br />
40000<br />
30000<br />
A<br />
0.0030 0.0031 0.0032 0.0033<br />
1/T (K -1 )<br />
COST Action E54 Book<br />
C6<br />
C7<br />
C8<br />
C9<br />
C10<br />
�G a/T (mJmol -1 K -1 )<br />
100000<br />
90000<br />
80000<br />
70000<br />
60000<br />
50000<br />
40000<br />
30000<br />
B<br />
0.0030 0.0031 0.0032 0.0033<br />
1/T (K -1 )<br />
Figure 4. Determination <strong>of</strong> the enthalpy <strong>of</strong> adsorption and entropy <strong>of</strong> adsorption for the n-alkanes on the<br />
surface <strong>of</strong> pulps A (A) and B (B)<br />
Table 3. Enthalpy <strong>of</strong> adsorption and entropy <strong>of</strong> adsorption for the n-alkanes on the surface <strong>of</strong> pulps A and<br />
B<br />
Pulp Probe<br />
-�Ha<br />
(mJ/mol)<br />
�Sa<br />
(mJ/mol K)<br />
Correlation coefficient<br />
A C6 3.85E+07 -6.82E+04 0.99<br />
A C7 4.55E+07 -8.22E+04 0.98<br />
A C8 5.34E+07 -9.82E+04 0.98<br />
A C9 5.71E+07 -1.01E+05 0.99<br />
A C10 6.49E+07 -1.17E+05 0.99<br />
B C6 3.67E+07 -6.09E+04 1.00<br />
B C7 4.35E+07 -7.33E+04 0.99<br />
B C8 5.08E+07 -8.70E+04 1.00<br />
B C9 5.51E+07 -9.16E+04 1.00<br />
B C10 6.18E+07 -1.04E+05 1.00<br />
For the polar probes, the free energy <strong>of</strong> adsorption has one component corresponding to<br />
dispersive interactions and an additional one due to specific interactions, i.e., that due to Lewis<br />
donor-acceptor interactions between the probe and the surface <strong>of</strong> the material under<br />
examination. The determination <strong>of</strong> the specific component <strong>of</strong> the free energy <strong>of</strong> adsorption<br />
(�Ga s ) may be used to characterize the surface in terms <strong>of</strong> its acidity and basicity.<br />
The specific components <strong>of</strong> the enthalpy <strong>of</strong> adsorption (-�Ha s ) and <strong>of</strong> the entropy <strong>of</strong> adsorption<br />
(�Sa s ) for each polar probe were obtained from the plots <strong>of</strong> -�Ga s /T versus 1/T (Figure 5),<br />
following Equation 7. The results presented in Table 4 show that, for both pulps, the highest<br />
value <strong>of</strong> -�Ha s is obtained with acetone, being followed by those with ETA and THF. The higher<br />
interaction <strong>of</strong> the pulps surfaces with amphoteric probes such as acetone and ETA suggests that<br />
the materials are <strong>of</strong> amphoteric nature. The ratio -�Ha s (THF)/-�Ha s (TCM) was 2.3 for the<br />
unbeaten pulp A and 3.8 for the beaten pulp B. The greater affinity <strong>of</strong> the pulps surfaces with a<br />
basic probe (THF), than with an acidic one (TCM), suggests that both pulps have a more acidic<br />
than basic character.<br />
45<br />
C6<br />
C7<br />
C8<br />
C9<br />
C10
COST Action E54 Book<br />
Similar conclusions can be drawn from the determination <strong>of</strong> the work <strong>of</strong> adhesion, Wa s , for each<br />
polar probe, by using Equation 4. At 40 °C, the ratio Wa s (THF)/Wa s (TCM) was 4.1 for the<br />
unbeaten pulp A and 4.6 for the beaten pulp B, confirming the amphoteric, predominantly Lewis<br />
acid character <strong>of</strong> the surface <strong>of</strong> the bleached pulps. This is in agreement with the studies reported<br />
in the literature for other bleached pulps and �-cellulose fibres by using similar methods for the<br />
evaluation <strong>of</strong> the surface acid-base properties (Jacob and Berg 1994; Belgacem et al. 1995; Shen<br />
et al. 1998; Carvalho et al. 2005a; 2005b). In addition, the increase <strong>of</strong> the -�Ha s (THF)/-<br />
�Ha s (TCM) and Wa s (THF)/Wa s (TCM) ratios after beating indicates that there is a larger number<br />
<strong>of</strong> the highest energy acidic sites relative to that <strong>of</strong> the highest energy basic sites upon the<br />
beating operation. This must be due to an increase <strong>of</strong> the accessibility at the fibres surface <strong>of</strong> the<br />
OH functional groups (acidic) relatively to that <strong>of</strong> the oxygen atoms (basic) not bound to<br />
hydrogen as a consequence <strong>of</strong> the beating action (Carvalho et al. 2005b).<br />
��G a s /T( mJmol -1 K -1 )<br />
25000<br />
20000<br />
15000<br />
10000<br />
5000<br />
0<br />
A<br />
0.003 0.0031 0.0032<br />
1/T (K -1 )<br />
TCM<br />
DCM<br />
THF<br />
ETA<br />
Acetone<br />
��G a s /T( mJmol -1 K -1 )<br />
30000<br />
25000<br />
20000<br />
15000<br />
10000<br />
5000<br />
0<br />
B<br />
0.003 0.0031 0.0032<br />
1/T (K -1 )<br />
TCM<br />
DCM<br />
THF<br />
ETA<br />
Acetone<br />
Figure 5. Determination <strong>of</strong> the specific component <strong>of</strong> the enthalpy <strong>of</strong> adsorption and entropy <strong>of</strong><br />
adsorption for the polar probes on the surface <strong>of</strong> pulps A (A) and B (B)<br />
Table 4. Values <strong>of</strong> the specific component <strong>of</strong> the enthalpy and entropy <strong>of</strong> adsorption for the polar probes<br />
on the surface <strong>of</strong> pulps A and B<br />
-�Ha s<br />
Pulp Probe DN/AN* (mJ/mol) (mJ/molK)<br />
Correlation coefficient<br />
A TCM 0.0 8.46E+06 -2.27E+04 0.94<br />
A DCM 0.0 9.86E+06 -2.09E+04 0.98<br />
A Acetone 6.8 2.51E+07 -5.70E+04 0.96<br />
A ETA 11.4 1.94E+07 -4.17E+04 0.97<br />
A THF 40.2 1.93E+07 -4.42E+04 0.97<br />
B TCM 0.0 4.94E+06 -1.13E+04 0.97<br />
B DCM 0.0 1.17E+07 -2.58E+04 0.98<br />
B Acetone 6.8 2.20E+07 -4.34E+04 0.99<br />
B ETA 11.4 1.66E+07 -2.95E+04 1.00<br />
B THF 40.2 1.87E+07 -3.89E+04 0.99<br />
Based on the variation <strong>of</strong> -�Ha s /AN* with DN/AN*, shown in Figure 6, Ka and Kb values are<br />
obtained as the slope and the intersection at the origin <strong>of</strong> the linear fit, respectively. For pulp A,<br />
a Ka value <strong>of</strong> 0.215 and a Kb value <strong>of</strong> 0.621 were determined; the values <strong>of</strong> Ka and Kb for pulp B<br />
were 0.209 and 0.470, respectively. The higher values <strong>of</strong> Kb with respect to those <strong>of</strong> Ka for both<br />
46<br />
�Sa s
COST Action E54 Book<br />
pulps could suggest the presence <strong>of</strong> more basic than acidic surfaces, i.e., a higher propensity <strong>of</strong><br />
donating electrons, which is in disagreement with the results above for the -�Ha s (THF)/-<br />
�Ha s (TCM) and Wa s (THF)/Wa s (TCM) ratios. In addition, it is not expected that the surfaces <strong>of</strong><br />
cellulosic pulp fibres are more basic than acidic, in account for the dominant presence <strong>of</strong> OH<br />
functional groups in the structure <strong>of</strong> these materials. However, as pointed out previously<br />
(Chehimi et al. 1999), it is not possible to compare these scales <strong>of</strong> acidity (Ka) and basicity (Kb)<br />
as they depend on the choice <strong>of</strong> the reference substances used for their determinations.<br />
-�H a s /AN *<br />
10.00<br />
9.00<br />
8.00<br />
7.00<br />
6.00<br />
5.00<br />
4.00<br />
3.00<br />
2.00<br />
1.00<br />
0.00<br />
A<br />
R 2 = 0.997<br />
0.00 10.00 20.00 30.00 40.00 50.00<br />
DN /AN *<br />
10.00<br />
9.00<br />
8.00<br />
7.00<br />
6.00<br />
5.00<br />
4.00<br />
3.00<br />
2.00<br />
1.00<br />
0.00<br />
Figure 6. Determination <strong>of</strong> Ka and Kb for the surface <strong>of</strong> pulps A (A) and B (B)<br />
��H a s /AN *<br />
B<br />
R 2 = 0.996<br />
0.00 10.00 20.00 30.00 40.00 50.00<br />
DN /AN *<br />
It should be reminded that the donor number (DN) parameter is defined as the negative enthalpy<br />
value for the reaction <strong>of</strong> the liquid under test with the acceptor SbCl5. The acceptor number (AN)<br />
parameter is defined as the relative 31 P NMR chemical shift <strong>of</strong> triethylphosphine oxide<br />
(Et3P=O), when this donor substance is dissolved in the liquid being evaluated (when the liquid<br />
is hexane, AN is set to zero) (Gutmann 1978). AN* is obtained from AN after correcting from the<br />
London dispersion forces contribution to the chemical shift, in order to obtain the true acid-base<br />
contribution (Riddle and Fowkes 1990). The reference species used for the determinations <strong>of</strong> DN<br />
and AN* differ in hardness according to the Hard and S<strong>of</strong>t Acids and Bases (HSAB) principle <strong>of</strong><br />
Pearson. While SbCl5 is a s<strong>of</strong>t acid, Et3P=O is known to be a hard base. DN is a scale <strong>of</strong> s<strong>of</strong>tness<br />
whereas AN* is a scale <strong>of</strong> hardness. Thus, for these reasons, the straight comparison <strong>of</strong> the Ka<br />
and Kb values in terms <strong>of</strong> the prevalence <strong>of</strong> the acidic or basic properties can not be made.<br />
Notwithstanding, the amphoteric characteristic <strong>of</strong> the pulps surfaces is confirmed by the<br />
determination <strong>of</strong> the acidity and basicity constants.<br />
Conclusions<br />
A bleached s<strong>of</strong>twood kraft pulp (A) and the corresponding beaten pulp (B) were analysed by<br />
inverse gas chromatography. The dispersive component <strong>of</strong> the surface energy increased slightly<br />
from 41.7 to 44.7 mJ/m 2 (T=40 °C) after beating. The specific component <strong>of</strong> the enthalpy <strong>of</strong><br />
adsorption (-�Ha s ) <strong>of</strong> several acidic, basic and amphoteric polar probes on the pulps surfaces was<br />
determined. The highest value for -�Ha s was obtained with acetone, suggesting a prevailing<br />
amphoteric behaviour. The value <strong>of</strong> the ratio -�Ha s (THF)/-�Ha s (TCM) was higher than 1, as well<br />
as that <strong>of</strong> the ratio Wa s (THF)/Wa s (TCM), both values indicating a higher affinity <strong>of</strong> the pulps<br />
surface with THF than with TCM, and, consequently, a surface with a more acidic than basic<br />
character. Overall, the results <strong>of</strong> this study are comparable to those reported for bleached<br />
hardwood kraft pulps.<br />
47
References<br />
COST Action E54 Book<br />
Belgacem M.N. (2000): Characterization <strong>of</strong> polysaccharides, lignin and other woody components by<br />
inverse gas chromatography: a review. Cell. Chem. Technol. 34, 357-383<br />
Belgacem M.N., Blayo A. and Gandini A. (1996): Surface characterization <strong>of</strong> polysaccharides, lignins,<br />
printing ink pigments, and ink fillers by inverse gas chromatography. J. Colloid Interf. Sci. 182, 431-436<br />
Belgacem M.N., Czeremuszkin G., Sapieha S. and Gandini A. (1995): Surface characterization <strong>of</strong><br />
cellulose fibres by XPS and inverse gas chromatography. Cellulose 2, 145-157<br />
Carvalho M.G., Ferreira P.J., Santos J.M.R.C.A., Amaral J.L. and Figueiredo M.M. (2005a): Effect <strong>of</strong><br />
extended cooking and oxygen prebleaching on the surface energy <strong>of</strong> Eucalyptus globulus kraft pulps. J.<br />
Pulp Pap. Sci. 31(2), 90-94<br />
Carvalho M.G., Santos J.M.R.C.A., Martins A.A. and Figueiredo M.M. (2005b): The effects <strong>of</strong> beating,<br />
web forming and sizing on the surface energy <strong>of</strong> Eucalyptus globulus kraft fibres evaluated by inverse<br />
gas chromatography. Cellulose 12, 371-383<br />
Chehimi M.M., Abel M., Perruchot C., Delamar M., Lascelles S.F. and Armes S.P. (1999): The<br />
determination <strong>of</strong> the surface energy <strong>of</strong> conducting polymers by inverse gas chromatography at infinite<br />
dilution. Synthetic Methods 104, 51-59<br />
Chtourou H., Riedl B. and Kokta B.V. (1995): Surface Characterizations <strong>of</strong> modified polyethylene pulp<br />
and wood pulps fibres using XPS and inverse gas chromatography. J. Adhes. Sci. Technol. 9, 551-574<br />
Conder J.R. and Young C.L. (1979): Physicochemical measurement by gas chromatography. Wiley-<br />
Interscience, New York<br />
Dorris G.M. and Gray D.G. (1980): Adsorption <strong>of</strong> n-alkanes at zero surface coverage on cellulose paper<br />
and wood fibres. J. Colloid Interf. Sci. 77, 353-362<br />
Felix J.M. and Gatenholm P. (1993): Characterization <strong>of</strong> cellulose fibers using inverse gas<br />
chromatography. Nordic Pulp Paper Res. J. 8(1), 200-203<br />
Gurnagul N. and Gray D.G. (1985): An inverse gas chromatographic study <strong>of</strong> newsprint surface area. J.<br />
Pulp Pap. Sci. 11(4), 98-101<br />
Gutmann V. (1978): The donor-acceptor approach to molecular interactions. Plenum Press, New York<br />
Jacob P.N. and Berg J.C. (1994): Acid-base surface energy characterization <strong>of</strong> microcrystalline cellulose<br />
and two wood pulp fiber types using inverse gas chromatography. Langmuir 10, 3086-3093<br />
Kamdem D.P. and Riedl B. (1991): IGC Characterization <strong>of</strong> PMMA grafted onto CTMP fiber. J. Wood<br />
Chem. Technol. 11(1), 57-91<br />
Kamdem D.P. and Riedl B. (1992): Inverse gas chromatography <strong>of</strong> lignocellulosic fibres coated with a<br />
thermosetting polymer: use <strong>of</strong> peak maximum and Conder and Young methods. J. Colloid Interf. Sci.<br />
150, 507-516<br />
Kamdem D.P., Bose S.K. and Luner P. (1993): Inverse gas chromatography characterization <strong>of</strong> birch<br />
wood meal. Langmuir 9, 3039-3044<br />
Lee H.L. and Luner P. (1989): Characterization <strong>of</strong> AKD sized papers by inverse gas chromatography.<br />
Nordic Pulp Paper Res. J. 4(2), 164-172<br />
48
COST Action E54 Book<br />
Megiatto J.D., Oliveira F.B., Rosa D.S., Gardrat C., Castellan A. and Frollini, E. (2007): Renewable<br />
resources as reinforcement <strong>of</strong> polymeric matrices: composites based on phenolic thermosets and<br />
chemically modified sisal fibers. Macromol. Biosci. 7, 1121-1131<br />
Mills R.H., Gardner D.J. and Wimmer R. (2008): Inverse gas chromatography for determining the<br />
dispersive surface free energy and acid-base interactions <strong>of</strong> sheet molding compound-Part II 14<br />
lignocellulosic fiber types for possible composite reinforcement. J. Appl. Polym. Sci. 110, 3880-3888<br />
Riddle F.L. and Fowkes F.M. (1990): Spectral shifts in acid-base chemistry. 1. Van der Waals<br />
contributions to acceptor numbers. J. Am. Chem. Soc. 112, 3259-3264<br />
Riedl B. and Kamdem D.P. (1992): Estimation <strong>of</strong> the dispersive component <strong>of</strong> surface energy <strong>of</strong> polymer<br />
grafted lignocellulosic fibers with inverse gas chromatography. J. Adhes. Sci. Technol. 9, 1053-1067<br />
Saint Flour C. and Papirer E. (1982): Gas solid chromatography: a method <strong>of</strong> measuring surface free<br />
energy characteristics <strong>of</strong> short glass fibers. 2. Through retention volumes measured near zero surface<br />
coverage. Ind. Eng. Chem. Prod. Res. Dev. 21, 666-669<br />
Santos J.M.R.C.A., Gil M.H., Portugal A. and Guthrie J.T. (2001): Characterization <strong>of</strong> the surface <strong>of</strong> a<br />
cellulosic multi-purpose <strong>of</strong>fice paper by inverse gas chromatography. Cellulose 8, 217-224<br />
Santos J.M.R.C.A. and Guthrie J.T. (2005): Analysis <strong>of</strong> interactions in multicomponent polymeric<br />
systems: The key-role <strong>of</strong> inverse gas chromatography. Mat. Sci. Eng. R. 50, 79-107<br />
Shen W., Yao W., Li M. and Parker I. (1998): Characterization <strong>of</strong> eucalypt fibre surface using inverse gas<br />
chromatography and X-ray photoelectron spectroscopy. Appita J. 51(2), 147-151<br />
Shen W. and Parker I.H. (1999): Surface composition and surface energetics <strong>of</strong> various eucalypt pulps.<br />
Cellulose 6, 41-55<br />
Shultz J., Lavielle L. and Martin C. (1987): The role <strong>of</strong> the interface in carbon fibre-epoxy composites. J.<br />
Adhesion 23, 45-60<br />
Tshabalala M.A. (1997): Determination <strong>of</strong> the acid-base characteristics <strong>of</strong> lignocellulosic surfaces by<br />
inverse gas chromatography. J. Appl. Polym. Sci. 65, 1013-1020<br />
49
COST Action E54 Book<br />
50
Abstract<br />
COST Action E54 Book<br />
CELLULOSE NANOFIBRILS -<br />
PRODUCTION, CHARACTERIZATION AND APPLICATIONS<br />
Gary Chinga-Carrasco and Kristin Syverud<br />
Paper and Fibre Research Institute (PFI AS), Høgskoleringen 6b,<br />
NO-7491 Trondheim, Norway.<br />
gary.chinga.carrasco@pfi.no<br />
This works focuses on the production, characterisation and application <strong>of</strong> cellulose nan<strong>of</strong>ibrils.<br />
A short description <strong>of</strong> cellulose fibres is given. In addition, examples <strong>of</strong> how mechanical and<br />
chemi-mechanical production <strong>of</strong> nan<strong>of</strong>ibrils affect their properties are presented. The<br />
nan<strong>of</strong>ibrillated material can be characterised in detail by applying several complementary<br />
microscopy techniques, such as scanners, laser pr<strong>of</strong>ilometry, x-ray microtomography, scanning<br />
electron microscopy and transmission electron microscopy. The various microscopy methods<br />
cover a wide range <strong>of</strong> structure sizes and reveal several characteristic details <strong>of</strong> fibres and the<br />
corresponding nan<strong>of</strong>ibrillated material. Finally, a short overview <strong>of</strong> various application areas<br />
that have been explored and are foreseen for cellulose nan<strong>of</strong>ibrils is given.<br />
Introduction<br />
In the beginning <strong>of</strong> the 20 th century, there was an extensive research on the utilization <strong>of</strong> the<br />
most abundant biopolymer on earth, i.e. cellulose. This resulted in a variety <strong>of</strong> products, e.g.<br />
cellophane, rayon, nitrocellulose (used in gun powder), adhesives and lacquer. During the 20 th<br />
century, petroleum-based polymers became the focus <strong>of</strong> research, also resulting in a variety <strong>of</strong><br />
products, e.g. plastic materials having several superior properties (e.g. water repellence,<br />
mouldability). There are however two major drawbacks with petroleum-based polymers, i) oil is<br />
not a renewable resource and ii) the products are not bio-degradable. Factors such as increasing<br />
oil prices, dwindling oil resources and a high focus on sustainability have motivated a renewed<br />
interest for bio-based polymers. There are reasons to believe that with extensive research, novel<br />
bio-degradable materials will <strong>of</strong>fer a good alternative to petroleum-based products in the near<br />
future.<br />
The structure <strong>of</strong> cellulose fibres<br />
Cellulose fibres are presently a major area <strong>of</strong> research for several end-use applications. <strong>Fibres</strong><br />
can be utilized as reinforcement in bio-degradable composites and as a source <strong>of</strong> raw materials<br />
for bio-energy and biochemicals production. As mentioned above, there is a growing interest in<br />
utilization <strong>of</strong> by-products from agricultural sources and forest industries in order to e.g. develop<br />
biodegradable polymers and thus replace synthetic oil-based products (Lucia and Rojas 2009).<br />
During the last years, chemical pulp fibres have been applied as the raw material for the<br />
production <strong>of</strong> cellulose nan<strong>of</strong>ibrils, which have enormous potential in several applications<br />
(Turbak et al. 1983). However, a successful utilization <strong>of</strong> cellulose fibres requires the<br />
development <strong>of</strong> energy- and cost-efficient procedures for production <strong>of</strong> nan<strong>of</strong>ibrils. A<br />
comprehensive understanding <strong>of</strong> cellulose fibres, their structure, their nanocomponents, and how<br />
their morphologies are affected by a given production procedure and treatment is thus necessary.<br />
51
COST Action E54 Book<br />
The structure <strong>of</strong> cellulose fibres has multiscale characteristics, spanning from the millimetre<br />
length and micrometer width <strong>of</strong> fibres to the nanometre diameter <strong>of</strong> nan<strong>of</strong>ibrils (Chinga-<br />
Carrasco 2011). Chemical pulp fibres have a surface, which is characterized by a particular<br />
pattern created by wrinkles and nan<strong>of</strong>ibrils in the outer layers <strong>of</strong> the fibre wall structure. The<br />
surface structure <strong>of</strong> chemical pulp fibres corresponds mainly to the primary and S1 layers <strong>of</strong> the<br />
fibre wall (Figure 1). Such structures are mainly preserved during chemical pulping, where the<br />
lignin and hemicellulose are extracted. Contrary to the outer layers <strong>of</strong> the fibre wall (primary and<br />
S1 layers), the S2 layer is characterised by having a structure <strong>of</strong> fibrils organized in a helical<br />
manner. S2 layers are commonly observed in thermo-mechanical pulp fibres where the S2 layer<br />
appears due to the mechanical fibrillation <strong>of</strong> the fibres outer layers. During the years, several<br />
microscopy techniques have been applied for visualization and quantification <strong>of</strong> fibre structures<br />
(see e.g. Page and Emerton 1959; Smith 1959; Jang et al. 1991; Moss et al. 1993; Duchesne and<br />
Daniel 2000; Reme et al. 2002; Gustafsson et al. 2003; Brändström et al. 2003; Fernando and<br />
Daniel 2004; Chinga-Carrasco et al. 2010).<br />
Figure 1. Assessment <strong>of</strong> Pinus radiata kraft pulp fibres. A) Surface structure. Note the white network <strong>of</strong><br />
fibrils, which probably correspond to the primary wall layer. B) SEM cross-sectional image, acquired in<br />
backscattered electron imaging (BEI) mode. C) Cross-section <strong>of</strong> a small area <strong>of</strong> a fibre wall structure.<br />
The fibrils, S1, S2 and S3 layers are indicated<br />
Production <strong>of</strong> cellulose nan<strong>of</strong>ibrils<br />
Production <strong>of</strong> homogeneous nan<strong>of</strong>ibril qualities require a major amount <strong>of</strong> energy during<br />
production (Figure 2). The less energy that is utilized, the less is the fibrillation <strong>of</strong> cellulose<br />
fibres and the less the amount <strong>of</strong> produced nan<strong>of</strong>ibrils (Syverud et al. 2011). Several pathways<br />
have been proposed for producing cellulose nan<strong>of</strong>ibrils (Turbak et al. 1983; Saito et al. 2006;<br />
Pääkkö et al. 2007; Heijnesson-Hultén 2007; Eriksen et al. 2008; Zimmermann et al. 2010).<br />
However, the energy consumption during production seems to be the limiting factor for utilizing<br />
nan<strong>of</strong>ibrils in industrial applications.<br />
52
AEC (kWh/t)<br />
60000<br />
50000<br />
40000<br />
30000<br />
20000<br />
10000<br />
200 bar<br />
600 bar<br />
1000 bar<br />
COST Action E54 Book<br />
0<br />
0 1 2 3 4 5 6<br />
Number <strong>of</strong> passes<br />
Figure 2. Homogenisation <strong>of</strong> Pinus radiata kraft pulp fibres. Accumulated energy consumption (AEC) as<br />
a function <strong>of</strong> the number <strong>of</strong> passes through a homogeniser for 3 different pressures<br />
Conventional homogenization (Turbak et al. 1983) may produce a fibrillated material with an<br />
inhomogeneous quality (Figure 6). A chemi-mechanical procedure based on TEMPO-mediated<br />
oxidation has been proposed for producing nan<strong>of</strong>ibrils with homogeneous dimensions, i.e.<br />
diameters <strong>of</strong> less than approx. 15 nm (Saito et al. 2006). Pääkkö et al. (2007) applied an<br />
innovative procedure where a pre-treatment based on enzymatic hydrolysis was introduced. The<br />
authors have recently reported a reduction <strong>of</strong> energy <strong>of</strong> up to 98%, which is industrially relevant.<br />
Presently, new equipment is being installed for upscaling the production <strong>of</strong> the nan<strong>of</strong>ibrillated<br />
material (Ankerfors 2010).<br />
Characterisation <strong>of</strong> nan<strong>of</strong>ibril structures<br />
Relevant procedures for quantification <strong>of</strong> nan<strong>of</strong>ibril quality are most desirable. There are several<br />
methods, which can be applied for direct quantification <strong>of</strong> cellulose nan<strong>of</strong>ibril structures (Table<br />
1). In the following, microscopy methods for direct assessment <strong>of</strong> some characteristics details<br />
are shortly reviewed.<br />
Assessment <strong>of</strong> the fibrillation degree is most interesting. However, the quality <strong>of</strong> nan<strong>of</strong>ibrils tend<br />
to be evaluated with devices covering the nano-range only (e.g. FE-SEM, AFM, TEM). Proper<br />
characterisation requires the quantification <strong>of</strong> the fibrillated material at several scales.<br />
Spectrophotometers have been applied for estimating the fibrillation degree (Iwamoto et al.<br />
2008). The higher the fibrillation <strong>of</strong> the cellulose fibres, the higher the transmittance. A<br />
complementary technique is based on desktop scanners. Although such devices are simple, they<br />
can yield a good assessment <strong>of</strong> the fibres that have not been fibrillated completely. As an attempt<br />
to demonstrate the suitability <strong>of</strong> the technique, scanner images have been acquired from films<br />
made <strong>of</strong> three fibril qualities. The fibrils were produced from Pinus radiata pulp fibres, applying<br />
a TEMPO-mediated oxidation as pre-treatment and three pressures during homogenisation<br />
(Syverud et al. 2011). The images were acquired in transmission mode with 2400 DPI (Figure<br />
3). A transparency measure can be estimated based on the ratio between the average grey-level<br />
<strong>of</strong> the acquired samples and the average grey-level <strong>of</strong> the background (Figure 4). Significant<br />
differences were detected between the nan<strong>of</strong>ibrillated materials. However, note that the<br />
transparency values differed only by 2% (Figure 4), though the energy consumption differed by<br />
roughly 35000 KWh/t (Figure 2). This indicates that depending on the application, the<br />
homogenisation may be adjusted to considerably reduce the energy consumption.<br />
53
COST Action E54 Book<br />
Table 1. Some image acquisition devices that are suitable for assessing several scales <strong>of</strong> nan<strong>of</strong>ibril<br />
structures. The resolution is given considering theoretical aspects, resolution values reported in the<br />
literature and personal communications. See also Chinga-Carrasco (2009)<br />
Technique Abbreviation Approx. res.<br />
(µm)<br />
Comments<br />
Desktop scanners >10 Fast, assessment <strong>of</strong> large areas. Can be<br />
used in transmission and reflective<br />
modes<br />
Pr<strong>of</strong>ilometry 1.0 Fast and automated method, nondestructive,<br />
image acquisition <strong>of</strong> large<br />
areas.<br />
X-ray<br />
microtomography<br />
X- CT
COST Action E54 Book<br />
As demonstrated in this study, scanners can be applied for assessing the fibrillation degree based<br />
on the assessment <strong>of</strong> relatively large areas (> 1 cm 2 ). In addition to the quantification <strong>of</strong> the<br />
fibrillation degree at the macro-scale, the micro-structure can be assessed with laser<br />
pr<strong>of</strong>ilometry. Laser pr<strong>of</strong>ilometry is a most suitable method for quantification <strong>of</strong> surface<br />
topography at the micro-level (Figure 5). This capability has been applied for measuring the<br />
roughness <strong>of</strong> nan<strong>of</strong>ibril films (Chinga-Carrasco and Syverud 2010). The less the fibrillation <strong>of</strong><br />
fibres, the rougher the surface <strong>of</strong> films (Figure 5). It is worth to mention that in order to improve<br />
the detection <strong>of</strong> the surface topography by the laser beam, a thin layer <strong>of</strong> gold has been applied<br />
on films made <strong>of</strong> cellulose nan<strong>of</strong>ibrils. The method has proved to be adequate and yield a<br />
detailed description <strong>of</strong> the surface topography (Chinga-Carrasco and Syverud 2010).<br />
In addition to the assessment <strong>of</strong> surface micro-structures, the detailed characterisation <strong>of</strong><br />
nan<strong>of</strong>ibril-based materials require high-resolution devices, such as the scanning electron<br />
microscope (SEM). One <strong>of</strong> the advantages <strong>of</strong> SEM is its versatility. Images can rapidly be<br />
acquired at low (50000x). In addition, SEM can be operated<br />
in several modes, e.g. secondary electron imaging (SEI), backscatter electron imaging (BEI), in<br />
low vacuum and applying modern in-lens detectors. Figure 6 shows the surface and crosssectional<br />
structures <strong>of</strong> nan<strong>of</strong>ibril films. The surface and cross-sectional images were acquired in<br />
SEM-SEI and SEM-BEI mode, respectively. Note that the cross-sectional images acquired in<br />
SEM-BEI mode are most suitable for direct quantification <strong>of</strong> nan<strong>of</strong>ibril film thicknesses, and<br />
roughnesses.<br />
Figure 5. Laser pr<strong>of</strong>ilometry <strong>of</strong> films made <strong>of</strong> nan<strong>of</strong>ibrils from P. radiata. The nan<strong>of</strong>ibrillated material<br />
was collected after 5 passes through the homogeniser. A) The fibrillated material was produced without<br />
pre-treatment. B) A TEMPO pre-treatment was applied. Size <strong>of</strong> images 2 x 2 mm 2 . Note that the surface<br />
roughness (Sq) is considerably lower for the film made <strong>of</strong> TEMPO-mediated oxidated fibrils (B)<br />
With respect to the morphology <strong>of</strong> fibril structures, the assessment <strong>of</strong> fibril diameter has been<br />
one <strong>of</strong> the applied approaches for evaluating a given fibril quality. The estimation <strong>of</strong> fibril<br />
diameter have been based on AFM, FESEM and TEM images. Fukuzumi et al. (2009) compared<br />
AFM and FE-SEM for estimating the fibril diameters. FE-SEM seemed to overestimate the fibril<br />
diameters. This was probably due to the metallic coating, which was required for making the<br />
sample conductive under the electron beam. Chinga-Carrasco and Syverud (2010) demonstrated<br />
that it is possible to conduct a FE-SEM analysis <strong>of</strong> fibril structures without having a metallic<br />
conductive layer. Applying a low acceleration voltage (< 1 kV) and short working distance (< 1<br />
mm) makes it possible to visualize nan<strong>of</strong>ibril structures at high magnification (>50000x), as seen<br />
in the inset in Figure 6B.<br />
55
COST Action E54 Book<br />
Figure 6. <strong>Structure</strong>s <strong>of</strong> films made <strong>of</strong> nan<strong>of</strong>ibrils made <strong>of</strong> Pinus radiata. A) The nan<strong>of</strong>ibrils have been<br />
manufactured by passing the pulp fibres 5 times through the homogeniser. B) The pulp fibres have been<br />
pre-treated with TEMPO before passing the pulp fibres 5 times through the homogeniser. Note the<br />
homogeneous nan<strong>of</strong>ibril diameters (< 100 nm) exemplified in the inset in B). The corresponding crosssectional<br />
images (acquired in SEM-BEI mode) are given in C and D<br />
(FE)-SEM is thus a valuable method for exploring a given structure, at the micro- and nanolevel.<br />
However a major limitation is the 2D assessment <strong>of</strong> 3D structures. Modern methods based<br />
on X-ray microtomography seems to yield valuable 3D information and are complementary in<br />
structural assessments, though the resolution <strong>of</strong> such devices is still a limiting factor (Figure 7).<br />
It is worth to mention that a relatively new in-situ serial microtoming device can be mounted in a<br />
FE-SEM device (Denk and Hortsman 2004). Such approach may expand the assessment <strong>of</strong><br />
nan<strong>of</strong>ibril structures to 3D and at high-magnification.<br />
Figure 7. X-�CT <strong>of</strong> nan<strong>of</strong>ibril films embedded in epoxy resin<br />
56
COST Action E54 Book<br />
TEM is the ultimate tool for assessment <strong>of</strong> nan<strong>of</strong>ibril morphology (Figure 8). Visualization <strong>of</strong><br />
fibril structures has been demonstrated by several authors (e.g. Andresen et al. 2006; Wågberg et<br />
al. 2008; Syverud et al. 2010). TEM yields images at high-resolution, making it possible to<br />
visualize sub-nanometer structures. TEM in high-resolution mode (HRTEM) has even been most<br />
useful for visualizing the surface modification <strong>of</strong> cellulose nan<strong>of</strong>ibrils (Stenstad et al. 2008;<br />
Syverud et al. 2010a). In addition, TEM tomography may open new possibilities for assessing<br />
nano- and sub-nano structures in 3D, thus introducing a new dimension in the comprehension <strong>of</strong><br />
a renewable and bio-degradable material, such as cellulose nan<strong>of</strong>ibrils.<br />
Figure 8. TEM image <strong>of</strong> a network <strong>of</strong> cellulose nan<strong>of</strong>ibrils produced from P. radiata<br />
Relevant application areas<br />
A series <strong>of</strong> application areas have been suggested for cellulose nan<strong>of</strong>ibrils, e.g. for rheology<br />
adjustment and as emulsion stabilizer <strong>of</strong> food, paint and cosmetics (Turbak et al. 1982; 1985).<br />
During the last years, some <strong>of</strong> these applications have been explored in more detail, and<br />
additional applications have been added to an expanding list. In the following, a brief description<br />
<strong>of</strong> some relevant applications is given.<br />
Paper<br />
Fibrils adhere, make inter-fibril bonds and form networks in a similar way as fibres do. Due to<br />
the small dimensions <strong>of</strong> single fibrils, the number <strong>of</strong> bonds in a sheet <strong>of</strong> fibrils is large compared<br />
to e.g. a sheet <strong>of</strong> paper. This influences the mechanical properties <strong>of</strong> the material (such as high<br />
density and superior strength), as has been demonstrated in several studies (e.g. Taniguchi and<br />
Okamura 1998; Henriksson et al. 2008; Syverud and Stenius 2009). In a recent study, the<br />
influence <strong>of</strong> adding 4 % cellulose nan<strong>of</strong>ibrils to TMP handsheets was studied (Eriksen et al.<br />
2008). The tensile strength was increased with up to 34 % depending on the nan<strong>of</strong>ibril quality.<br />
The light scattering and opacity were however reduced. Nan<strong>of</strong>ibrils have been applied as a<br />
coating layer on handsheets composed <strong>of</strong> 70 % bleached TMP and 30 % clay (Syverud et al.<br />
2009). The nan<strong>of</strong>ibrils formed a dense and continuous film. Hence, a considerable reduction in<br />
surface roughness was quantified. However, the paper gloss did not increase. This was probably<br />
due to the coverage <strong>of</strong> glossy clay particles by the less glossy nan<strong>of</strong>ibrils (Syverud et al. 2009).<br />
Despite the lower gloss, the lower roughness <strong>of</strong> nan<strong>of</strong>ibril coated surfaces may be advantageous<br />
for improving the quality <strong>of</strong> printed surfaces. In addition, the application <strong>of</strong> cellulose nan<strong>of</strong>ibrils<br />
in layered TMP handsheets has been explored by Mörseburg and Chinga-Carrasco (2009). A<br />
series <strong>of</strong> handsheets were made, where the nan<strong>of</strong>ibrils were blended with the middle and surface<br />
57
COST Action E54 Book<br />
layers. It was shown that the appropriate application <strong>of</strong> nan<strong>of</strong>ibrils counteracts the potential<br />
reduction in strength caused by clay particles. Recently, a patent application about using<br />
cellulose nan<strong>of</strong>ibrils together with a polysaccharide hydrocolloid (e.g. starch) as a coating <strong>of</strong><br />
printing paper for reducing linting or dusting has been published (Ankerfors et al. 2009).<br />
Packaging<br />
The ability <strong>of</strong> cellulose nan<strong>of</strong>ibrils to form dense and continuous films proposes the<br />
nan<strong>of</strong>ibrillated material as most suitable for barrier applications in packaging. Superior barrier<br />
against oxygen at low relative humidity has been demonstrated (Syverud and Stenius 2009). As<br />
the humidity increases the oxygen permeability increases dramatically (Aulin et al. 2010;<br />
Minelli et al. 2010). This is probably caused by swelling due to the interaction between water<br />
molecules and the hydroxyl groups on the nan<strong>of</strong>ibril surfaces. Cellulose nan<strong>of</strong>ibrils have an<br />
hydrophilic nature. Good barrier against water and oxygen thus requires the combination <strong>of</strong><br />
nan<strong>of</strong>ibrils with complementary materials. As an example, the combination <strong>of</strong> nan<strong>of</strong>ibrils and<br />
shellac has revealed good barrier properties against water and oxygen (Hult et al. 2010).<br />
Membranes<br />
The application <strong>of</strong> nan<strong>of</strong>ibrils in membranes has been suggested in several studies. It has been<br />
demonstrated that a composite membrane <strong>of</strong> bacterial cellulose and chitosan is able to separate<br />
ethanol and water with good selectivity, flux and mechanical properties (Dubey 2005).<br />
Nan<strong>of</strong>ibrils have also been applied in loudspeaker membranes, alone and as a composite with<br />
melamine formaldehyde. In this respect, the combination <strong>of</strong> high mechanical dampening and<br />
high sound propagation velocity is <strong>of</strong> technical interest (Henriksson and Berglund 2007).<br />
Composites<br />
Nan<strong>of</strong>ibrillated cellulose applied in composite materials have been summarized in two recent<br />
reviews (Hubbe et al. 2008, Siró and Plackett 2010). Superior thermal, mechanical and barrier<br />
properties at low reinforcement levels and better recyclability, transparency and low weight are<br />
reported as advantages <strong>of</strong> nano-composites compared to conventional composites (Oksman et al.<br />
2006, Sorrentine et al. 2007; Siró and Plackett 2010). The nanocomposites can be divided into<br />
several groups depending on the properties <strong>of</strong> the matrices (Siró and Plackett 2010) (Table 2).<br />
Table 2. Classification <strong>of</strong> composite matrices<br />
Non-biodegradable Biodegradable<br />
Hydrophilic matrices acrylic resins, epoxy resins, starch, poly(ethylene)oxide (PEO),<br />
EVOH, latex<br />
chitosan<br />
Hydrophobic matrices polyethylene, polypropylene polylactide, polycaprolactone<br />
The most frequently mentioned motivation for adding fibrils to polymers and forming a<br />
composite is the increase in tensile strength and E-modulus. This has been mentioned by various<br />
authors (see e.g. the review <strong>of</strong> Hubbe et al. 2008). However, due to the hydrophilic nature <strong>of</strong><br />
cellulose, it is necessary to surface modify the material for increasing its compatibility with<br />
hydrophobic matrices. Several approaches are reported, e.g. acetylation (e.g. Kim et al. 2002;<br />
Tingaut et al. 2010), silylation (Goussé et al. 2004; Andresen et al. 2006) and grafting (e.g.<br />
Stenstad et al. 2008). Many <strong>of</strong> these methods involve change <strong>of</strong> solvent and are thus time<br />
consuming and will not be easily applicable in an industrial perspective. Simpler methods for<br />
surface modification are therefore sought. One approach is to use cationic surfactants that can<br />
58
COST Action E54 Book<br />
adsorb to the surfaces <strong>of</strong> fibrils produced by TEMPO-mediated oxidation, which have a<br />
negatively charged surface (Syverud et al. 2010a).<br />
Emulsions<br />
Since the beginning <strong>of</strong> the 20 th century, it has been known that emulsions can be stabilized by<br />
solid particles that are partly wetted by the water phase, and partly by the oil phase; so-called<br />
Pickering emulsions (Pickering 1907). Recently, a few studies have demonstrated that<br />
hydrophobized nan<strong>of</strong>ibrils can be applied for stabilization <strong>of</strong> water-in-oil emulsions (Andresen<br />
et al. 2007; Xhanari et al. 2010; Lif et al. 2010), which is most interesting for end-use products<br />
such as paints and low-emission diesel.<br />
Thickeners<br />
Cellulose nanoparticles have unusual rheological properties. As the cellulose fibres are divided<br />
into individual nano-scaled particles the viscosity increases considerably and a high viscous gellike<br />
structure is formed (Ioelovich 2008). The use <strong>of</strong> nanosized cellulose particles as carrier <strong>of</strong><br />
enzymes is demonstrated with the intended use in cosmetic applications (Ioelovich and Figovsky<br />
2008). In addition, the water-holding capacity <strong>of</strong> bacterial cellulose has been utilized in meat<br />
balls (Lin and Lin 2004).<br />
Medical applications<br />
An area <strong>of</strong> research for cellulosic nano-materials is within medical applications. In this respect,<br />
bacterial cellulose has mostly been in focus due to its purity and the highly swollen 3D structure<br />
<strong>of</strong> the fibrils. It is especially two applications that are foreseen for the nan<strong>of</strong>ibrillated material, 1)<br />
as scaffolds for tissue or bone (see review by Klemm et al. 2006) and 2) for controlled drug<br />
delivery. Hydrogel nanoparticles for drug delivery is an area that has been in focus for some<br />
time (see e.g. reviews by Soppimath et al. (2001) and Hamidi et al. (2008). The use <strong>of</strong> cellulose<br />
nan<strong>of</strong>ibrils has been suggested as a suitable material for preparing such hydrogels (Johnson et al.<br />
2009).<br />
In addition, it has been shown that it is possible to add functionality to the surface <strong>of</strong> nan<strong>of</strong>ibrils<br />
by binding functional molecules to the surface hydroxyl groups. Non-leaching antimicrobial<br />
films have been prepared from nan<strong>of</strong>ibrils. An antimicrobial compound, octadecyldimethyl(3trimethoxysilylpropyl)-ammonium<br />
chloride (ODDMAC) was covalently bonded to the fibril<br />
surfaces. The films showed antibacterial activity against both Gram-positive and Gram-negative<br />
bacteria (Andresen et al. 2007).<br />
Concluding remarks<br />
Nan<strong>of</strong>ibrillated cellulose is an interesting material for several industry sectors. This study gives a<br />
general overview <strong>of</strong> nan<strong>of</strong>ibril production, how different treatments can affect a given nan<strong>of</strong>ibril<br />
quality, how nan<strong>of</strong>ibrils can be efficiently quantified by microscopy methods, and how<br />
nan<strong>of</strong>ibrils can be utilized in several applications.<br />
Being produced from cellulose fibres, a promising application will be in paper products.<br />
Cellulose nan<strong>of</strong>ibrils give strength and improve the surface properties <strong>of</strong> printing paper.<br />
However, the price <strong>of</strong> cellulose nan<strong>of</strong>ibrils, not yet commercialized, will determine if the<br />
promising results regarding use in paper applications can be set into practice. The challenges in<br />
this case are the total production costs <strong>of</strong> nan<strong>of</strong>ibrils, including energy, chemical costs,<br />
investments in production equipments and in upgrading a given paper machine. In addition,<br />
runnability is a challenging issue with respect to nan<strong>of</strong>ibril and paper production.<br />
59
COST Action E54 Book<br />
In addition to applying the nan<strong>of</strong>ibrillated material in paper, cellulose nan<strong>of</strong>ibrils have a wide<br />
range <strong>of</strong> applications, including emulsions, thickeners, novel membranes, filters, composite<br />
materials and in medicine, to name a few. However, a proper utilization <strong>of</strong> nan<strong>of</strong>ibrils will<br />
require a comprehensive understanding <strong>of</strong> its morphology, mechanical properties, and how these<br />
properties are affected by a given production procedure. In this respect, adequate<br />
characterisation and quantification <strong>of</strong> the various scales <strong>of</strong> cellulose fibres and nan<strong>of</strong>ibrils will<br />
be necessary. Complementary microscopy techniques in combination with effective<br />
computerized image analysis will be most suitable for controlling a given nan<strong>of</strong>ibril quality and<br />
it properties.<br />
Acknowledgement<br />
The Research Council <strong>of</strong> Norway is thanked for funding this work through the grants<br />
193706/S50 and 196119/V30. The authors thank Y. Yu (NTNU) for assistance during the<br />
acquisition <strong>of</strong> the TEM image.<br />
References<br />
Andresen M., Johansson L.-S., Tanem B.S. and Stenius P. (2006): Properties and characterization <strong>of</strong><br />
hydrophobized micr<strong>of</strong>ibrillated cellulose. Cellulose 13, 665-667<br />
Andresen M. and Stenius P. (2007): Water-in-oil Emulsions Stabilized by Hydrophobized<br />
Micr<strong>of</strong>ibrillated Cellulose. J. Dispersion Sci. Technol., 28 (5), 837 – 844<br />
Andresen M., Stenstad P., Møretrø T., Langsrud S., Syverud K., Johansson L.-S. and Stenius P. (2007):<br />
Nonleaching Antimicrobial Films Prepared from Surface-Modified Micr<strong>of</strong>ibrillated Cellulose.<br />
Biomacromolecules, 8 (7), 2149 – 2155<br />
Ankerfors M., Lindström T., Hoc M. and Song H. (2009): Composition for coating <strong>of</strong> printing paper.<br />
WO/2009/123560<br />
Ankerfors M. (2010): Great interest in pilot plant for nanocellulose production. Innventia – Beyond<br />
2/2010<br />
Aulin C., Gällstedt M. and Lindström T. (2010): Oxygen and oil barrier properties <strong>of</strong> micr<strong>of</strong>ibrillated<br />
cellulose films and coatings. Cellulose 17, 559-574<br />
Brändström J., Bardage S.L., Daniel G. and Nilsson T. (2003): The structural organisation <strong>of</strong> the S1 cell<br />
wall layer <strong>of</strong> Norway spruce tracheids. IAWA J. 24 (1), 27-40<br />
Chinga-Carrasco G. (2009): Exploring the multi-scale structure <strong>of</strong> printing paper - A review <strong>of</strong> modern<br />
technology. J. Microscopy-Oxford 234(3), 211-242<br />
Chinga-Carrasco G. (2011): Microscopy and computerised image analysis <strong>of</strong> cellulose fibres multiscale<br />
structures. In: Microscopy: Science, Technology, Applications and Education. Microscopy Book Series.<br />
To appear January 2011<br />
Chinga-Carrasco G. and Syverud K. (2010): Computer-assisted quantification <strong>of</strong> the multiscale structure<br />
<strong>of</strong> films made <strong>of</strong> nan<strong>of</strong>ibrillated cellulose. J. Nanop. Res. 12(3), 841-851<br />
Chinga-Carrasco G., Johnsen P.O. and Øyaas K. (2010): Structural quantification <strong>of</strong> wood fibres surfaces<br />
- morphological effects <strong>of</strong> pulping and enzymatic treatment. Micron 41(6), 648-59<br />
Denk W. and Horstman H. (2004): Serial block-face scanning electron microscopy to reconstruct threedimensional<br />
tissue nanostructure. Plos Biology 2(11), 1900-1909<br />
60
COST Action E54 Book<br />
Dubey V., Pandey L.K. and Saxena C. (2005): Pervaporative separation <strong>of</strong> ethanol/water azeotrope using<br />
a novel chitosan-impregnated bacterial cellulose membrane and chitosan-poly(vinyl alcohol) blends. J.<br />
Membrane Science 251, 131-136<br />
Duchesne I. and Daniel G. (2000): Changes in surface ultrastructure <strong>of</strong> Norway spruce fibres during kraft<br />
pulping - visualization by field emission-SEM. Nordic Pulp Paper Res. J. 15(1), 54-61<br />
Eriksen Ø., Gregersen Ø. W. and Syverud K. (2008): The use <strong>of</strong> micr<strong>of</strong>ibrillated cellulose produced from<br />
kraft pulp as strength enhancer in TMP paper. Nordic Pulp Paper Res. J. 23(3), 299-304<br />
Fernando D. and Daniel G. (2004): Micro-morphological observations on spruce TMP fibre fractions<br />
with emphasis on fibre cell wall fibrillation and splitting. Nordic Pulp Paper Res. J. 19(3), 278-285.<br />
Fukuzumi H., Saito T., Iwata T., Kumamoto Y. and Isogai A. (2009): Transparent and high gas barrier<br />
films <strong>of</strong> cellulose nan<strong>of</strong>ibers prepared by TEMPO-mediated oxidation. Biomacromolecules 10, 162-165<br />
Goussé C., Chanzy H., Cerrada M.L. and Fleury E. (2004): Surface silylation <strong>of</strong> cellulose micr<strong>of</strong>ibrils:<br />
preparation and rheological properties. Polymer 45, 1569-1575<br />
Gustafsson J., Ciovica J. and Peltonen J. (2003): The ultrastructure <strong>of</strong> spruce kraft pulps studied by<br />
atomic force microscopy (AFM) and X-ray photoelectron spectroscopy (XPS). Polymer 44, 661-670<br />
Hamidi M., Azadi A. and Rafei P. (2008): Hydrogel nanoparticles in drug delivery. Advanced drug<br />
delivery reviews 60, 1638-1649<br />
Heijnesson-Hultén A. (2007): patent no. WO 2007/001229 A1: Method for preparing micr<strong>of</strong>ibrillar<br />
polysaccharide<br />
Henriksson M. and Berglund L.A. (2007): <strong>Structure</strong> and properties <strong>of</strong> cellulose nanocomposite films<br />
containing melamine formaldehyde. J. Appl. Polymer Sci. 106, 2817-2824<br />
Henriksson M., Berglund L.A., Lindström T. and Nishino T. (2008): Cellulose Nanopaper structures <strong>of</strong><br />
high toughness. Biomacromolecules 9, 1579-1585<br />
Hubbe M.A., Rojas O.J., Lucia L.A. and Mohini S. (2008): Cellulosic nanocomposites: a review.<br />
BioResources 3 (3), 929-980<br />
Hult E-L., Iotti M. and Lenes M. (2010): Efficient approach to high barrier packaging using micr<strong>of</strong>ibrillar<br />
cellulose and shellac. Cellulose 17, 575–586<br />
Ioelovich M. (2008): Cellulose as a nanostructures polymer: a short review. BioRes. 3 (4), 1403-1418<br />
Ioelovich M. and Figovsky O. (2008): Nano-cellulose as promising biocarrier. Trans Tech publications,<br />
DOI: 10.4028/www.scientific.net/AMR.47-50.1286<br />
Iwamoto S., Abe K. and Yano H. (2008): The effect <strong>of</strong> hemicelluloses on wood pulp nan<strong>of</strong>ibrillation and<br />
nan<strong>of</strong>iber network characteristics. Biomacromolecules 9, 1022-1026<br />
Jang H.F., Robertson A.G. and Seth R.S. (1991): Optical sectioning <strong>of</strong> pulp fibres using confocal<br />
scanning laser microscopy. Tappi J. 74(10), 217-219<br />
Johnson R.K., Sharp A.Z., Renneckar S.H. and Glasser W.G. (2009): A new bio-based nanocomposite:<br />
fibrillated TEMPO-oxidized celluloses in hydroxypropylcellulose matrix. Cellulose 16, 227-238<br />
Kim D.Y., Nishiyama Y. and Kuga S. (2002): Surface acetylation <strong>of</strong> bacterial cellulose. Cellulose 9, 361-<br />
367<br />
Klemm D., Schumann D., Kramer F., Hessler N., Hornung M., Schmauder H.-P. and Marsch S. (2006):<br />
Nanocelluloses as innovative polymers in research and application. Adv. Polym. Sci. 205, 49-96<br />
61
COST Action E54 Book<br />
Lif A., Stenstad P., Syverud K., Nydén M. and Holmgren K. (2010): Fischer-Tropsch diesel emulsions<br />
stabilised by micr<strong>of</strong>ibrillated cellulose. J. Colloid Interface Science, accepted<br />
Lin K.-W. and Lin H.-Y. (2004): Quality characteristics <strong>of</strong> Chinese-style meatball containing bacterial<br />
cellulose (Nata). J. Food Sci. 69 (3), 107-111<br />
Minelli M., Baschetti M.G., Doghieri F., Ankerfors M., Lindström T., Siró I. and Plackett D. (2010):<br />
Investigation <strong>of</strong> mass transport properties <strong>of</strong> micr<strong>of</strong>ibrillated cellulose (MFC) films. J. Memb. Sci. 358,<br />
67-75<br />
Moss P.A., Retulainen E., Paulapuro H. and Aaltonen P. (1993): Taking a new look at pulp and paper:<br />
Applications <strong>of</strong> confocal laser scanning microscopy (CLSM) to pulp and paper research. Paperi Ja Puu<br />
75(1-2), 74-79<br />
Mörseburg K. and Chinga-Carrasco G. (2009): Assessing the combined benefits <strong>of</strong> clay and<br />
nan<strong>of</strong>ibrillated cellulose in layered TMP-based sheets. Cellulose 16(5): 795-806<br />
Oksman K., Mathew A.P., Bondeson D. and Kvien I. (2006): Manufacturing process <strong>of</strong> cellulose<br />
whiskers/polylactic acid nanocomposites. Compos. Sci. Technol. 66, 2776-2784<br />
Page D.H. and Emerton H.W. (1959): The microscopic examination <strong>of</strong> fibres, paper, board and wood –<br />
Improved methods for the study <strong>of</strong> surfaces. Svensk Papperstidn. 62(9), 318-332<br />
Pickering S.U. (1907): Emulsions. J. Chem. Soc. 91, 2001-2021<br />
Pääkkö M., Ankerfors M., Kosonen H., Nykänen A., Ahola S., Österberg M., Ruokolainen J., Laine J.,<br />
Larsson P.T., Ikkala O. and Lindström T. (2007): Enzymatic hydrolysis combined with mechanical<br />
shearing and high-pressure homogenization for nanoscale cellulose fibrils and strong gels. Biomacromol.<br />
8, 1934-1941<br />
Reme P.A., Johnsen P.O. and Helle T. (2002): Assessment <strong>of</strong> fibre transverse dimensions using SEM and<br />
image analysis. J. Pulp Pap. Sci. 28(4), 122-128<br />
Saito T., Nishiyama Y., Putaux J.L., Vignon M. and Isogai A. (2006): Homogeneous suspensions <strong>of</strong><br />
individualized micr<strong>of</strong>ibrils from TEMPO-catalyzed oxidation <strong>of</strong> native cellulose. Biomacromol. 7(6),<br />
1687-1691<br />
Smith K.C.A. (1959): Scanning electron microscopy in pulp and paper research. Pulp Paper Can. 60(12),<br />
366-371<br />
Siró I. and Plackett D. (2010): Micr<strong>of</strong>ibrillated cellulose and new nanocomposite materials: a review.<br />
Cellulose 17, 459-494<br />
Soppimath K.S., Aminabhavi T.M., Kulkarni A.R. and Rudzinski W.E. (2001): Biodegradable polymeric<br />
nanoparticles as drug delivery devices. J. Controlled Release 70, 1-20<br />
Sorrentino A., Gorrasi G., Vittoria V. (2007): Potential perspectives <strong>of</strong> bio-nanocomposites for food<br />
packaging applications. Trends Food Sci Technol 18, 84-95<br />
Stenstad P., Andresen M., Tanem B.S. and Stenius P. (2008): Chemical surface modifications <strong>of</strong><br />
micr<strong>of</strong>ibrillated cellulose. Cellulose 15, 35-45<br />
Syverud K. and Stenius P. (2009): Strength and permeability <strong>of</strong> MFC films. Cellulose 16 (1), 75-85<br />
Syverud K., Gregersen Ø., Chinga-Carrasco G. and Eriksen, Ø. (2009): The influence <strong>of</strong> micr<strong>of</strong>ibrillated<br />
cellulose, MFC, on paper strength and surface properties. 14th Fund. Res. Symp., 899-930, Oxford<br />
62
COST Action E54 Book<br />
Syverud K., Xhanari K., Chinga-Carrasco G., Yu Y. and Stenius P. (2010a): Films made <strong>of</strong> cellulose<br />
nan<strong>of</strong>ibrils - surface modification by adsorption <strong>of</strong> a cationic surfactant and characterisation by computerassisted<br />
electron microscopy. J. Nanoparticle Res. DOI: 10.1007/s11051-010-0077-1<br />
Syverud K., Chinga-Carrasco G., Toledo J. and Toledo P. (2011): Comparison <strong>of</strong> Eucalyptus and P.<br />
radiata pulp fibres as raw materials for production <strong>of</strong> cellulose nan<strong>of</strong>ibrils. Submitted<br />
Taniguchi T. and Okamura K. (1998): New films produced from micr<strong>of</strong>ibrillated natural fibres. Polymer<br />
International 47, 291-294<br />
Tingaut P., Zimmermann T. and Lopez-Suevos F. (2010): Synthesis and characterization <strong>of</strong><br />
bionanocomposites with tunable properties from poly (lactic acid) and acetylated micr<strong>of</strong>ibrillated<br />
cellulose. Biomacromol. 11, 454-464<br />
Turbak A.F., Snyder F.W. and Sandberg K.R. (1982): Food products containing micr<strong>of</strong>ibrillated<br />
cellulose. US Patent no. 4,341,807, Jul. 27<br />
Turbak A.F., Snyder F.W. and Sandberg K.R. (1983): Micr<strong>of</strong>ibrillated cellulose, a new cellulose product:<br />
properties, uses, and commercial potential. J. Appl. Polym. Sci., Appl. Polym. Symp. 37, 815–827<br />
Turbak A.F., Snyder F.W. and Sandberg K.R. (1985): Suspensions containing micr<strong>of</strong>ibrillated cellulose.<br />
US Patent no. 4,500,546, Feb. 19<br />
Wågberg L., Decher G., Norgren M., Lindström T., Ankerfors M. and Axnäs K. (2008): The build-up <strong>of</strong><br />
polyelectrolyte multilayers <strong>of</strong> micr<strong>of</strong>ibrillated cellulose and cationic polyelectrolytes. Langmuir 24: 784-<br />
795<br />
Xhanari K., Syverud K. and Stenius P. (2010): Emulsions stabilized by micr<strong>of</strong>ibrillated cellulose: the<br />
effect <strong>of</strong> hydrophobization, concentration and o/w ratio. J. Disp. Sci. Technol. In press<br />
Zimmermann T., Bordeanu N. and Strub E. (2010): Properties <strong>of</strong> nan<strong>of</strong>ibrillated cellulose from different<br />
raw materials and its reinforcement potential. Carbohydrate Polymers 79(4), 1086-1093<br />
63
COST Action E54 Book<br />
64
COST Action E54 Book<br />
SEC STUDIES ON HCL TREATED SOFTWOOD AND<br />
BIRCH KRAFT PULPS<br />
Paul Ander 1 , Ute Henniges 2 and Antje Potthast 2<br />
1 CRUW, Dept. <strong>of</strong> Forest Products/Wood Science, SLU, Uppsala, Sweden<br />
2 BOKU - University <strong>of</strong> Natural Resources and Life Sciences, Vienna, Department <strong>of</strong> Chemistry,<br />
Christian Doppler Laboratory “Advanced Chemistry and Analytics <strong>of</strong> Cellulose”<br />
Abstract<br />
Vienna, Austria. E-mail: paul.ander@slu.se<br />
Unbleached and bleached s<strong>of</strong>twood kraft pulps and six birch kraft pulps were treated with<br />
hydrochloric acid and evaluated for molecular weight changes using Size Exclusion<br />
Chromatography (SEC-MALLS). In addition the distribution <strong>of</strong> uronic acids in hemicelluloses<br />
relative to molecular weight was analysed applying group selective fluorescence labelling. The<br />
goal was to evaluate how cellulose and hemicellulose are affected by acid treatment <strong>of</strong> these<br />
s<strong>of</strong>twood and hardwood pulps. The s<strong>of</strong>twood pulp fibres were strongly cleaved by the acid<br />
during hemicellulose degradation and an overall molecular weight decrease was observed. The<br />
uronic acid content associated with hemicellulose also decreased. The birch fibres were affected<br />
only little by HCl. The SEC results clearly reflect the observed cleavage rates <strong>of</strong> the used<br />
s<strong>of</strong>twood and hardwood pulps. While for the bleached and HCl treated s<strong>of</strong>twood pulp a clear<br />
decrease <strong>of</strong> Mw was observed, the effect on birch pulp was smaller.<br />
Introduction<br />
Fibre deformations are already present in small amounts in naturally grown trees and they<br />
increase during pulp cooking and bleaching. These irregularities have been defined as<br />
dislocations. This term describes the localized change or distortion <strong>of</strong> the crystalline cellulose<br />
micr<strong>of</strong>ibrils in either the S1 or both S1 and S2 secondary cell wall layers (Nyholm et al. 2001).<br />
While small dislocations are not considered to be significant and are thought to add to fibre<br />
flexibility, large dislocations are considered to be a target for chemical, mechanical or enzymatic<br />
attack due to their less ordered or more open amorphous cellulose structure.<br />
Several investigations (Ander et al. 2005; 2008) show that all acid conditions partly cleave fibres<br />
in dislocations. Thus, dislocations make the cell wall more susceptible to enzymatic and<br />
chemical attack allowing for a stronger penetration <strong>of</strong> cooking and bleaching chemicals during<br />
pulping and this leads to inferior strength <strong>of</strong> the resulting paper.<br />
In this study it was tried to link the enhanced availability <strong>of</strong> dislocations that were produced by<br />
hydrochloric treatment in the fibres to changes in molecular weight and uronic acid content. In<br />
order to shed some light on the effects <strong>of</strong> HCl on the s<strong>of</strong>twood and birch fibres and possible<br />
molecular weight changes <strong>of</strong> hemicellulose and cellulose, SEC was run on the different pulps<br />
before and after acid treatment.<br />
Materials and Methods<br />
Pulps<br />
Unbleached (3.9% lignin) and bleached (0.2% lignin) mixed spruce (Picea abies) and pine<br />
(Pinus sylvestris) kraft pulps were obtained from Karin Sjöström, Södra Cell, Sweden (Common<br />
pulp samples COST E54). The ratio <strong>of</strong> spruce to pine was 79:21. The pulps resulted from a batch<br />
65
COST Action E54 Book<br />
cook and were TCF-bleached with the sequence Q - OP - Q+Paa – PO (Q: chelator, Paa:<br />
Peraacetic acid). Lignin and carbohydrate composition was determined at Stora Enso, Karlstad,<br />
Sweden and given in the paper by Heinemann and Ander (2011) in this book.<br />
Six birch (Betula verrucosa) kraft pulps from a pulp bleaching line were obtained from Irina<br />
Rauvanto, Lappeenranta, Finland.<br />
HCl-treatment<br />
HCl-treatment was done using 100 mg pulp (dry-weight) and 1M HCl pH 0 at 81 �C according<br />
to Ander et al. (2008). The equipment for making HCl treatment is shown in Heinemann and<br />
Ander (2011) this book.<br />
Fibre characterisation<br />
Fibre lengths before and after acid treatment were determined using a FibreMaster at Södra Cell<br />
for s<strong>of</strong>twood fibres. For birch fibres a Fiber tester from Lorentzen & Wettre was used.<br />
Cellulose characterization<br />
Size exclusion chromatography and fluorescence labelling <strong>of</strong> oxidized cellulose functionalities<br />
before and after HCl treatments were done as described in Bohrn et al. (2006).<br />
Results and Discussion<br />
S<strong>of</strong>twood pulps and HCl method<br />
The results for unbleached and bleached s<strong>of</strong>twood pulp fibres are shown in Table 1 below.<br />
Table 1. Characterization <strong>of</strong> bleached and unbleached s<strong>of</strong>twood pulp fibres<br />
Pulp type LWFL (mm) LWFL (mm) Cleavage per fibre Cleavage per mm<br />
(L0)<br />
(L)<br />
(L0 / L) - 1<br />
fibre<br />
Unbleached pulp 2.73 0.59 3.62 1.33<br />
Bleached pulp 2.60 0.37 6.11 2.35<br />
Cleavage values <strong>of</strong> 3.6 for the unbleached pulp and <strong>of</strong> 6.1 for the bleached pulp can be<br />
considered typical (Ander et al. 2008). They reflect an increased formation <strong>of</strong> dislocations and<br />
other weak points during pulping and bleaching. HCl releases more xylose than glucose<br />
indicating a stronger effect <strong>of</strong> HCl on hemicellulose. A typical kraft pulp <strong>of</strong> the same kind as<br />
here can give 0.055 g/l <strong>of</strong> xylose and 0.0075 g/l <strong>of</strong> glucose for 100 mg pulp (Ander et al. 2008).<br />
Polarized light microscopy (PLM)<br />
Typical appearance <strong>of</strong> some unbleached and bleached s<strong>of</strong>twood fibres before and after HCl<br />
treatment is shown in Figures 1a-d. Some birch fibres and vessels after HCl treatment are shown<br />
in Figure 2a-c. The vessels appear to be rather acid stable, and although they appear in only a<br />
few percent they may contribute to a seemingly lower acid cleavage <strong>of</strong> the fibres. See also Table<br />
2.<br />
66
a<br />
c<br />
COST Action E54 Book<br />
Figure 1a. Latewood (LW) spruce fibres under polarized light microscopy showing dislocations <strong>of</strong><br />
different sizes. See arrows. Water treated undelignified fibres, 20x<br />
Figure 1b. Grey earlywood (EW) and coloured latewood fibres. Some breakages caused by the industrial<br />
pulp bleaching are seen. Bleached fibres water treated controls, 10x<br />
Figure 1c. A latewood spruce fibre after cleavage in a dislocation, 20x. Unbleached and HCl treated<br />
fibre<br />
LW<br />
Figure 1d. LW and EW fibres cut by the acid treatment are seen. Bleached fibres, 10x. All bars are 30 µm<br />
HCl treatment <strong>of</strong> birch fibres and PLM<br />
b<br />
a b c<br />
Figure 2a. Birch fibres after HCl cleavage.<br />
Figure 2b with a typical birch vessel. Both figures were photographed at magnification 10x indicating<br />
that the width <strong>of</strong> the vessels are about 7 times larger than the width <strong>of</strong> normal birch fibres.<br />
Figure 2c with typical difference in size <strong>of</strong> birch vessels and fibres cut by the acid. The vessels appear to<br />
be rather stable against acid cleavage. Figure 2a & b are from fibre line nr 1; 2c from the most bleached<br />
part <strong>of</strong> the fibre line nr 6. Bars are 50 µm<br />
67<br />
d<br />
EWs<br />
LW
SEC investigations<br />
COST Action E54 Book<br />
Figure 3 gives the weighted average molecular weight <strong>of</strong> the s<strong>of</strong>twood pulp obtained from SEC<br />
before and after acid treatment for bleached and unbleached samples.<br />
Mw [kg/mol]<br />
350<br />
300<br />
250<br />
200<br />
150<br />
100<br />
50<br />
0<br />
SD [%]<br />
unbl_H2O unbl_HCl bl_H2O bl_HCl<br />
Figure 3. Change in Mw for unbleached and bleached s<strong>of</strong>twood pulps before and after HCl treatment<br />
The observed effect on Mw for the unbleached material was significantly lower compared to the<br />
bleached pulp. Bleaching renders the cellulose more accessible, cellulose hydrolysis is more<br />
severe. In addition, lignin may serve as a barrier and protects the pulp during the acid treatment.<br />
carboxyl group content [µmol/g]<br />
30<br />
25<br />
20<br />
15<br />
10<br />
5<br />
0<br />
SD [µmol/g]<br />
unbl_H2O unbl_HCl bl_H2O bl_HCl<br />
Figure 4. Change in carboxyl group content for unbleached and bleached s<strong>of</strong>twood pulps before and<br />
after HCl treatment. Error bars give the standard deviation in µmol/g<br />
The carboxyl group content given in Figure 4 mainly corresponds to the uronic acids, which are<br />
not as pronounced in s<strong>of</strong>twoods compared to hardwood. The uronic acids mainly reflect the<br />
68
COST Action E54 Book<br />
xylan content <strong>of</strong> the material. The differences observed between bleached and unbleached pulp<br />
is not very pronounced, slightly lower numbers were found for the unbleached pulp.<br />
diff log Mw<br />
0,8<br />
0,6<br />
0,4<br />
0,2<br />
0,0<br />
unbleached H 2 O<br />
unbleached HCl<br />
bleached H 2 O<br />
bleached HCl<br />
3 4 5 6 7<br />
log Mw<br />
Figure 5. Molecular weight distribution <strong>of</strong> the unbleached and bleached s<strong>of</strong>twood samples<br />
In Figure 5 it can be observed that the molecular weight distribution <strong>of</strong> the two starting samples<br />
is already different, as one would expect. The water treated samples show a low molecular<br />
weight shoulder that was removed by the acid treatment. This low molecular weight shoulder is<br />
already affected by the water treatment; even though there is no significant change in Mw, this<br />
shoulder is noticeably decreased by the treatment. After HCl-treatment however, the whole<br />
MWD shifted towards smaller masses.<br />
Hardwood birch pulp<br />
The results for the HCl test method for the birch pulp fibre line are given in Table 2.<br />
Table 2. Characterization <strong>of</strong> cleavage <strong>of</strong> birch pulp fibre<br />
Birch<br />
Pulp sample<br />
Cleavage per fibre<br />
80.5�C & 30 min std<br />
stirring<br />
Cleavage per fibre<br />
85.5�C & 30 min std<br />
stirring<br />
Cleavage per fibre<br />
85.5�C & 45<br />
min long stirring<br />
1 0.35 0.62 0.56<br />
2 0.28 0.76 0.77<br />
3 0.33 -- --<br />
4 0.305 -- --<br />
5 0.33 -- --<br />
6 0.225 0.54 0.635<br />
Cleavage per fibre (0.225 – 0.35) at the standard temperature 80.5 �C was unexpectedly low. At<br />
85.5 �C the detected cleavage increased somewhat to 0.54 – 0.76. Longer stirring time had little<br />
effect on the acid degradation. One explanation for this result may be the stability <strong>of</strong> birch<br />
vessels in acidic environments, which result in lower overall cleavage (see Figure 2). Protection<br />
by hemicellulose is another possibility (Ander and Daniel 2006). Although, another hardwood<br />
fibre, bleached eucalyptus also has vessels it was more HCl sensitive and a larger cleavage<br />
69
COST Action E54 Book<br />
number was obtained for that fibre (0.835 and 1.17; Ander 2008). More research is needed for<br />
hardwood fibres.<br />
Mw [kg/mol]<br />
800<br />
600<br />
400<br />
200<br />
0<br />
birch pulp, H 2 O<br />
1 2 3 4 5 6<br />
treatment steps<br />
birch pulp, HCl, average<br />
carboxyl group content [µmol/g]<br />
60<br />
50<br />
40<br />
30<br />
20<br />
10<br />
0<br />
birch pulp, H 2 O<br />
birch pulp, HCl, average<br />
1 2 3 4<br />
treatment steps<br />
5 6<br />
Figure 5. Change in Mw (left) and carboxyl group content (right) for birch pulps before and after HCl<br />
treatment<br />
Regarding birch fibres, Figure 5 left shows that high Mw cellulose decreased in the pulp fibre<br />
line during bleaching. After HCl treatment, the starting Mw was much lower than for water<br />
samples and further decreased for fibre line samples 1 to 4. It appears as if hemicellulose was not<br />
degraded so much by HCl in opposite to the s<strong>of</strong>twood fibres. This result is supported by the<br />
MWD <strong>of</strong> the birch samples: the low molecular weight shoulder that reflects the hemicellulose<br />
content did not disappear in the course <strong>of</strong> the bleaching treatment (not shown).<br />
Regarding the uronic acid content (Figure 5 right), the trend was not clear for the water samples.<br />
For the HCl-treated samples, the uronic acid groups did not change, which may be due low<br />
hemicellulose degradation in birch. That result may fit with the low cleavage induced by HCl <strong>of</strong><br />
the birch fibres reported here in Table 2. With s<strong>of</strong>twood fibres, however, HCl gave strong fibre<br />
cleavage (Table 1). Similarly, Ander et al. (2008) have shown that HCl releases the<br />
hemicellulose sugar xylose in large amounts and rather little cellulose sugars.<br />
Conclusion<br />
In short, the molecular weight <strong>of</strong> s<strong>of</strong>twood pulp decreased by the acid treatment due to<br />
degradation. The fibre cleavage corresponds in this case to the molecular weight decrease.<br />
Bleaching in combination with HCl treatment gave the strongest degradation, but no further<br />
decrease in uronic acid content. This is mainly because the hemicelluloses have been removed<br />
by the bleaching already, resulting in a decreased uronic acid content. Noticeable degradation by<br />
HCl was obtained in all molecular regions; this was most visible for the bleached pulps.<br />
With birch pulp, less fibre cleavage was observed. Hemicelluloses were not affected in the same<br />
way as in s<strong>of</strong>twood pulp. So the lower fibre cleavage observed again reflects the higher stability<br />
<strong>of</strong> the samples as demonstrated by SEC-MALLS. This is mainly explained by more protection <strong>of</strong><br />
the cellulose fibre due to the hemicelluloses in birch pulp that are not easily attacked and<br />
withstand the acid treatment as shown in a generally unchanged uronic acid content.<br />
70
Acknowledgement<br />
COST Action E54 Book<br />
The research <strong>of</strong> PA was carried out within CRUW (Cooperative Research on the Ultrastructure<br />
<strong>of</strong> Wood <strong>Fibres</strong>) with financial support from VINNOVA’s Branch Research Program and six<br />
supporting pulp and paper and chemical industries (Eka Chemicals, Holmen, SCA, Smurfit<br />
Kappa, Stora Enso and Södra Cell).<br />
References<br />
Ander P. (2008): COST Action E54 Workshop “<strong>Fine</strong> fibre”, 10-11 April 2008, Graz, Austria<br />
Ander P., Daniel G., Garcia-Lindgren C. and Marklund A. (2005): Characterization <strong>of</strong> industrial and<br />
laboratory pulp fibres using HCl, Cellulase and FiberMaster analyses. Nordic Pulp Paper Res. J. 20(1),<br />
115-120<br />
Ander P., Hildén L. and Daniel G. (2008): Cleavage <strong>of</strong> s<strong>of</strong>twood kraft pulp fibres by HCl and Cellulases.<br />
Bioresources 3(2), 477-490<br />
Ander P. and Daniel G. (2006): Dislocation counting and comparison <strong>of</strong> pulp fibre properties after HCltreatment<br />
and fibre length determination. Proc. 5th Plant Biomechanics Conference, Stockholm, Vol. I.<br />
August 28 – September 1, 2006. Ed.: L. Salmén. STFI-Packforsk, Stockholm, Sweden, ISBN 91-86018-<br />
12-4, pp. 169-174<br />
Bohrn R., Potthast A., Schiehser S., Rosenau T., Sixta H. and Kosma P. (2006): The FDAM method:<br />
Determination <strong>of</strong> carboxyl pr<strong>of</strong>iles in cellulosic materials by combining group-selective fluorescence<br />
labeling with GPC. Biomacromolecules 7 (6), 1743-1750<br />
Heinemann S. and Ander P. (2011): Standard pulp and paper tests. In COST Action E54<br />
“Characterisation <strong>of</strong> the fine structure and properties <strong>of</strong> papermaking fibres using new technologies”.<br />
Eds: Ander P., Bauer W., Heinemann S., Kallio P., Passas R. and Treimanis A. Swedish University <strong>of</strong><br />
Agricultural Sciences. p. 211-232. ISBN 978-91-576-9007-4<br />
Nyholm K., Ander P., Bardage S. and Daniel G. (2001): Dislocations in pulp fibres – their origin,<br />
characteristics and importance – a review. Nordic Pulp Paper Res. J. 16:4, 376-384<br />
71
COST Action E54 Book<br />
72
COST Action E54 Book<br />
ANALYSIS OF THE SURFACE LAYERS OF MECHANICALLY PEELED<br />
UNBLEACHED AND BLEACHED EUCALYPTUS KRAFT PULP FIBRES<br />
Arnis Treimanis 2 , Antje Potthast 1 , Ute Henniges 1 , Thomas Rosenau 1 ,<br />
Uldis Grinfelds 2 , Tatjana Bikova 2 , Marite Skute 2<br />
1 University <strong>of</strong> Natural Resources and Applied Life Sciences, Muthgasse 18, A-1190, Vienna,<br />
Austria, E-mail: antje.potthast@boku.ac.at<br />
Abstract<br />
2 State Institute <strong>of</strong> Wood Chemistry, 27 Dzerbenes str., Riga LV 1006, Latvia,<br />
E-mail: arnis.treimanis@edi.lv<br />
The objective <strong>of</strong> the present work was to separate and to analyse the surface layers <strong>of</strong> eucalyptus<br />
unbleached and bleached kraft pulp fibres. Upgraded hydromechanical peeling techniques were<br />
applied to isolate fibre wall morphological layers. UV- spectra revealed that the content <strong>of</strong> lignin<br />
and hexenuronic acids was 3-4 times higher in fibre surface layers as compared to the average<br />
values. The content <strong>of</strong> heteroaromatic compounds (furanoids/furan resins) and oxypolysaccharides<br />
was also estimated to be higher in the surface fibre wall fraction. Fluorescence<br />
labelling and GPC-MALLS showed that the molecular weight distribution <strong>of</strong> the surface fraction<br />
differed significantly from that <strong>of</strong> the bulk fibre, mostly in the low molecular weight fraction.<br />
The main fibre secondary wall layer fractions equaled the molecular weight distribution <strong>of</strong> the<br />
bulk fibre. The same held true for molecular weight and carbonyl group content. The impact <strong>of</strong><br />
bleaching on the fraction obtained from the surface layers was very pronounced in spite <strong>of</strong> the<br />
lower final ISO brigthness value. After bleaching, the molecular weights and carboxyl group<br />
contents were found to decrease in all analyzed samples. Again, the surface layer fraction<br />
exhibited a different behaviour than bulk sample and main fibre secondary wall fractions.<br />
Introduction<br />
The residual constituents <strong>of</strong> middle lamella and primary wall <strong>of</strong> wood cell walls affect the<br />
composition <strong>of</strong> pulp fibre surface layers. It is expected that this translates into the pulp fibres’<br />
bleachability. The objective <strong>of</strong> the present work was to separate the surface layers <strong>of</strong> eucalyptus<br />
unbleached kraft pulp fibres by improved hydromechanical peeling techniques and to proceed<br />
with enzyme-aided bleaching <strong>of</strong> the separated layers according to the sequence peroxide –<br />
xylanase treatment – alkaline extraction – peroxide P1-X-E-P2. The composition <strong>of</strong> both<br />
unbleached and bleached fibre wall fractions were analysed by UV/Vis spectroscopy and<br />
fluorescence labelling <strong>of</strong> cellulose functionalities followed by GPC-MALLS.<br />
Hydromechanical (mechanical) method <strong>of</strong> the separation <strong>of</strong> fibre wall outer layers was<br />
introduced in the 60s (e.g. Krause 1967). It is based on the fact that there are comparatively<br />
weaker bonds between the surface <strong>of</strong> secondary wall layers S1 and S2 due to the different<br />
cellulose fibril angles in relation to the fibre axis. An advantage <strong>of</strong> the fibre surface layer<br />
separation method is the possibility to isolate chemically unmodified fractions <strong>of</strong> the fibre wall.<br />
At the Latvian State Institute <strong>of</strong> Wood Chemistry in Riga, the composition <strong>of</strong> different<br />
unbleached and bleached pulp fibre samples has been investigated during a number <strong>of</strong> years.<br />
Both the hydromechanical and the chemical fibre wall peeling (heterogeneous acetylation)<br />
methods have been applied. The first one was modified (Gromov et al. 1976) by adding ethanol<br />
to the fibre suspension in order to prevent the dissolution <strong>of</strong> hemicelluloses during the prolonged<br />
(30-60 h) mixing procedure in a laboratory disintegrator built according to the ISO<br />
73
COST Action E54 Book<br />
standard 5263:1995. As regards the chemical peeling method, acetylation <strong>of</strong> fibre substance and<br />
subsequent dissolution <strong>of</strong> esterified matter in methylene dichloride, a decrease <strong>of</strong> the acetylation<br />
time and the amount <strong>of</strong> catalyst was recommended by Purina et al. (1979). A new parameter –<br />
degree <strong>of</strong> exposure (DE) <strong>of</strong> the fibre wall S2 layer – was introduced to characterize the openness<br />
<strong>of</strong> the main part <strong>of</strong> the secondary wall. Later the hydromechanical peeling procedure was<br />
upgraded (Treimanis 2006) by using a digital device the “FiberTester” from Lorentzen &<br />
Wettre, Sweden (L&W), for evaluation <strong>of</strong> the quantity <strong>of</strong> fibre fines (fragments <strong>of</strong> the surface<br />
layers P and S1) created by peeling.<br />
Materials and Methods<br />
Pulp<br />
Eucalyptus unbleached kraft pulp fibres were kindly provided by Portucel Soporcel group. The<br />
sample was taken after cooking before the oxygen delignification stage.<br />
Hydromechanical peeling<br />
The unbleached kraft pulp fibre walls were divided in two parts by using the upgraded technique<br />
<strong>of</strong> hydromechanical peeling (Treimanis 2006). This method seen in Figure 1, involves a<br />
continuous intense stirring <strong>of</strong> a 3% fibre-water (plus ethanol) suspension, resulting in a partial<br />
removal <strong>of</strong> the primary wall (P) and the outer (S1) layer <strong>of</strong> the secondary wall from the central<br />
part <strong>of</strong> the fibre walls. Before peeling, the parenchyma cells, vessel fragments and fibre debris<br />
were separated by screening <strong>of</strong> the fibre suspension. The intact fibres are collected on sieves<br />
with 600 and 400 µm holes and then combined. During the peeling process, the fibres are<br />
examined using light microscope “Leica DM5500” and fibre dimensions using the digital<br />
analysis equipment L&W “FiberTester” to establish the end <strong>of</strong> the process. It is not possible to<br />
peel <strong>of</strong>f 100% <strong>of</strong> the surface material due to the arising cross-sectional destruction <strong>of</strong> the fibres.<br />
According to the SEM micrographs, certain portion <strong>of</strong> the fibres remains unpeeled (Figure 2). It<br />
means that the fraction containing fibre wall surface material is quite “clean” but the main part<br />
<strong>of</strong> the fibre wall (S2-S3 layers) is “contaminated” with small quantities <strong>of</strong> the surface material.<br />
After the peeling the fibre surface layer fragments are collected by sedimentation, centrifugation<br />
and freeze drying steps. During screening the fraction which passed the sieve with 400 µm holes<br />
is accumulated. The yield <strong>of</strong> the fraction containing fibre surface material, consisting mainly <strong>of</strong><br />
the residues <strong>of</strong> the primary wall P and the outer layer S1 <strong>of</strong> the secondary wall, was determined<br />
to be approx. 5% by mass. Chemical composition <strong>of</strong> the two fibre wall fractions was presented<br />
in a previous paper (Treimanis et al. 2008). It is noteworthy to mention that Klason lignin<br />
content in the surface fraction exceeded the average number by 4 times (2.6% vs. 0.6%).<br />
74
COST Action E54 Book<br />
Figure 1. Scheme <strong>of</strong> the hydromechanical peeling procedure <strong>of</strong> the selected pulp fibres<br />
PS1<br />
Figure 2. SEM micrographs <strong>of</strong> eucalyptus unbleached kraft pulp fibres after peeling <strong>of</strong> the surface layers.<br />
Right-side picture shows the fibre with retained surface layers P-S1<br />
75
Enzyme aided bleaching<br />
COST Action E54 Book<br />
The bleaching <strong>of</strong> the two separated fibre wall fractions was performed according to the sequence<br />
peroxide (P1) – enzyme treatment (X) – alkaline extraction (E) – peroxide (P2). More detailed<br />
pulp bleaching conditions has been reported earlier (Treimanis et al. 2009).<br />
UV/ Vis spectroscopy<br />
Perkin Elmer instrument „Lambda 35” was used. In order to differentiate the UV-absorbance<br />
derived by residual lignin and oxypolysaccharides, sequential alkaline extraction with 0.5% and<br />
10% NaOH was applied. The total NaOH solubility was 40% by weight for unbleached surface<br />
layers and 19% for the residual part <strong>of</strong> the fibre wall.<br />
Cellulose characterization<br />
Size exclusion chromatography and fluorescence labelling <strong>of</strong> oxidized cellulose functionalities<br />
before and after bleaching treatments were performed as described in Röhrling et al. (2002) for<br />
the CCOA-protocol to detect carbonyl groups and in Bohrn et al. (2006) for the FDAM-protocol<br />
to determine carboxyl group content.<br />
Results and Discussion<br />
In Table 1 it can be observed that the analytical data <strong>of</strong> the entire fibre equals those <strong>of</strong> the main<br />
fibre wall fraction S2-S3. Mainly, the molecular weights Mw <strong>of</strong> the two fractions are very<br />
similar. The carbonyl group content, however, is more similar between the entire fibre and the<br />
surface layer fraction. When calculating the theoretical amount <strong>of</strong> reducing endgroups in these<br />
samples, none <strong>of</strong> them showed any sign <strong>of</strong> oxidation; all determined carbonyl groups originate<br />
from the reducing ends <strong>of</strong> the cellulose. Differences between the two values, determined<br />
carbonyl groups and calculated reducing end groups, are assumed to be caused by experimental<br />
error and uncertainties in the calculation itself. Carboxyl group content was not determined in<br />
this case (Table 1).<br />
Table 1. Overview <strong>of</strong> the main analytical characteristics <strong>of</strong> the unbleached samples<br />
Abbreviation Description Mw<br />
[kg/mol]<br />
Mn<br />
[kg/mol]<br />
Carboxyl<br />
groups<br />
[µmol/g]<br />
REG<br />
theor.<br />
[µmol/g]<br />
Carbonyl<br />
groups<br />
[µmol/g]<br />
EUK1 Kraft Pulp 534 130 n.d. 7.7 8.3<br />
EUK2 Kraft Pulp, P-S1 406 114 n.d. 8.8 8.2<br />
EUK3 Kraft Pulp, S2-S3 559 109 n.d. 9.2 7.3<br />
n.d.: not determined<br />
Fluorescence labelling and GPC-MALLS showed that the molecular weight distribution <strong>of</strong> the<br />
surface layer fraction differed significantly from that <strong>of</strong> the whole fibre, mostly in the low<br />
molecular weight fraction. The S2-S3 layers fractions equaled the molecular weight distribution<br />
<strong>of</strong> the whole fibre (Figure 3).<br />
This is also true for the carbonyl group distribution pr<strong>of</strong>ile along the cellulose chains. The S2-S3<br />
layers fraction followed mainly the suggested pr<strong>of</strong>ile for reducing end groups only, while the<br />
two other samples had a different pr<strong>of</strong>ile that is influenced by a more prominent presence <strong>of</strong><br />
hemicelluloses.<br />
76
Diff log Mw<br />
1,1<br />
1,0<br />
0,9<br />
0,8<br />
0,7<br />
0,6<br />
0,5<br />
0,4<br />
0,3<br />
0,2<br />
0,1<br />
0,0<br />
-0,1<br />
EUK1<br />
EUK2<br />
EUK3<br />
COST Action E54 Book<br />
3 4 5 6 7 8<br />
log Mw<br />
Figure 3. Distribution <strong>of</strong> carbonyl groups relative to the molecular weight in unbleached eucalyptus<br />
samples<br />
In Table 2 the analytical data for the bleached samples are compiled. In general it can be<br />
observed that due to the bleaching sequence the Mw decreased while the total carbonyl group<br />
content increased considerably as expected (Table 2). The impact <strong>of</strong> bleaching was most<br />
pronounced in the fraction obtained from the surface layers. The carbonyl group content in the<br />
surface layer P-S1 increased 3 times compared to only 2 times in the S2-S3 part or in the whole<br />
fibre (cf. Table 1).<br />
When it comes to the oxidized cellulose functionalities, e.g. carbonyl and carboxyl groups, most<br />
similarity can be found between the data <strong>of</strong> the entire fibre and those <strong>of</strong> the secondary wall<br />
layers S2-S3 <strong>of</strong> the sample. These values are virtually the same. Also, Mn is very similar<br />
between these two samples. For the Mw this observation is not entirely true.<br />
Table 2. Overview <strong>of</strong> the main analytical characteristics <strong>of</strong> the bleached samples<br />
Abbreviation Description<br />
Mw<br />
[kg/mol]<br />
Mn<br />
[kg/mol]<br />
Carboxyl<br />
groups<br />
[µmol/g]<br />
0,035<br />
0,030<br />
0,025<br />
0,020<br />
0,015<br />
0,010<br />
0,005<br />
0,000<br />
REG theor.<br />
[µmol/g]<br />
DS carbonyl<br />
Carbonyl<br />
groups<br />
[µmol/g]<br />
EUK1-bleached Kraft Pulp 426 54 60.2 2.4 16.1<br />
EUK2-bleached Kraft Pulp, P-S1 260 39 30.1 3.9 28.4<br />
EUK3-bleached Kraft Pulp, S2-S3 283 55 63.8 3.5 16.9<br />
The differences in the Mw are also reflected in the molecular weight distribution (Figure 4).<br />
Unlike the unbleached samples, the MWD <strong>of</strong> the bleached samples differed between the three <strong>of</strong><br />
them.<br />
77
Diff log Mw<br />
0,8<br />
0,7<br />
0,6<br />
0,5<br />
0,4<br />
0,3<br />
0,2<br />
0,1<br />
0,0<br />
EUK 1 bleached<br />
EUK 2 bleached<br />
EUK 3 bleached<br />
COST Action E54 Book<br />
3 4 5 6 7<br />
log Mw<br />
Figure 4. Differential molecular weight distribution <strong>of</strong> bleached samples<br />
The differences impaired to the single fraction and the entire fibre can be studied more in detail<br />
when comparing the two samples, bleached and unbleached, directly to each other. In Figure 5<br />
the molecular weight distribution <strong>of</strong> the entire fibre shifted rather parallel to lower molecular<br />
weight fractions with largest impact in the low molecular weight regions.<br />
Diff log Mw<br />
0,8 EUK 1<br />
EUK 1 bleached<br />
0,7<br />
0,6<br />
0,5<br />
0,4<br />
0,3<br />
0,2<br />
0,1<br />
0,0<br />
3 4 5 6 7<br />
log Mw<br />
Figure 5. Comparison <strong>of</strong> differential molecular weight distribution <strong>of</strong> untreated and bleached sample<br />
eucalyptus kraft pulp<br />
Figure 6 shows the impact on the surface layer fraction <strong>of</strong> the sample before and after bleaching.<br />
As new hemicelluloses cannot be generated due to the bleaching treatment it has to be assumed<br />
that the increase in the low molecular weight should be caused by cellulose degradation products<br />
that accumulate in this area.<br />
78
Diff log Mw<br />
1,0<br />
0,9<br />
0,8<br />
0,7<br />
0,6<br />
0,5<br />
0,4<br />
0,3<br />
0,2<br />
0,1<br />
0,0<br />
EUK 2<br />
EUK 2 bleached<br />
COST Action E54 Book<br />
3 4 5 6 7<br />
log Mw<br />
Figure 6. Comparison <strong>of</strong> differential molecular weight distribution <strong>of</strong> untreated and bleached eucalyptus<br />
kraft pulp surface layers (P- S1)<br />
The changes that occur in the outer layer fraction <strong>of</strong> the sample caused by bleaching again<br />
resemble the changes observed for the entire fibre. However, the high molecular weight fraction<br />
was more severely affected in this sample fraction than in the entire fibre (Figure 7).<br />
Diff log Mw<br />
0,8 EUK 3<br />
EUK 3 bleached<br />
0,7<br />
0,6<br />
0,5<br />
0,4<br />
0,3<br />
0,2<br />
0,1<br />
0,0<br />
3 4 5 6 7<br />
log Mw<br />
Figure 7. Comparison <strong>of</strong> differential molecular weight distribution <strong>of</strong> untreated and bleached eucalyptus<br />
pulp fibre wall main layers S2-S3<br />
In spite <strong>of</strong> the rather exhaustive changes in the chemical composition during the fibre wall<br />
fractions, the ISO brightness <strong>of</strong> the isolated surface layers P-S1 remained much lower as<br />
compared to the main part <strong>of</strong> the fibre wall. P-S1 provided 50% ISO brightness as compared to<br />
67% ISO brightness for the main part <strong>of</strong> the fibres.<br />
79
COST Action E54 Book<br />
In order to elucidate the distinctions in the chemical composition <strong>of</strong> the fractions before the<br />
bleaching, the UV-spectra (Figure 8) and the 1 st derivative <strong>of</strong> the spectra were analysed. With<br />
0.5% NaOH solution, the absorbance values at 218, 290, 330, 350, 386, and 390 nm are<br />
attributed to lignin. Strong absorbance <strong>of</strong> the alkaline extract from fibre surface layers at 245 nm<br />
and weaker UV-absorbance at 244, 254, 266, and 276 nm for the alkaline extract <strong>of</strong> the fraction<br />
enriched in S2 and S3 layers indicate the presence <strong>of</strong> heteroaromatic compounds <strong>of</strong> the furanoid<br />
(pyranoid) type.<br />
Absorbance<br />
1.4<br />
1.2<br />
1<br />
0.8<br />
0.6<br />
0.4<br />
0.2<br />
A<br />
Whole fibre<br />
P-S1<br />
S2-S3<br />
0.8<br />
0.6<br />
0.4<br />
0.2<br />
0<br />
0<br />
200 220 240 260 280 300 320 340 360 380 400 200 220 240 260 280 300 320 340 360 380 400<br />
Wavelength, nm<br />
1.4<br />
1.2<br />
1<br />
Whole fibre<br />
Figure 8. The UV-spectra <strong>of</strong> the alkaline extracts from unbleached P-S1 (upper curves) and S2-S3<br />
fractions (lower curves); A – 0.5% NaOH; B – 10.0% NaOH<br />
In 10% NaOH extracts, the absorbance at 235 nm is attributed to hexenuronic acids (HexA).<br />
From UV-spectra analysis we conclude that the content <strong>of</strong> lignin and hexenuronic acids are 3-4<br />
times higher in the fibre surface layers as compared to whole pulp values. The content <strong>of</strong><br />
heteroaromatic compounds (furanoids / furan resins) and oxypolysaccharides was also estimated<br />
to be much higher in the surface fraction.<br />
For the bleached fractions the total NaOH solubility decreased and was 25% by mass for the<br />
fibre surface layers and 15% for the main part <strong>of</strong> fibre wall. The decrease <strong>of</strong> the absorbance <strong>of</strong><br />
the components from surface fractions occurred over the whole spectral range. The absorbance<br />
drop at 218 nm and 250 nm by 45% and 63%, respectively, in the 10% NaOH extract <strong>of</strong> the<br />
surface P-S1 layers indicates the degradation <strong>of</strong> the heteroaromatic compounds possibly<br />
incorporated in the furan resins. The decrease <strong>of</strong> absorbance at 280-300 nm and around 340-360<br />
nm indicates the elimination <strong>of</strong> both carbonyl groups and double bond conjugated structures in<br />
the fibre walls. The main part <strong>of</strong> the fibre wall, the S2-S3 layers, had lost most <strong>of</strong> the easily<br />
accessible fractions <strong>of</strong> hemicelluloses and HexA during the bleaching procedure as indicated by<br />
the decrease <strong>of</strong> the absorbance around 235 nm. At the same time an increase <strong>of</strong> the absorbance at<br />
235 nm in the case <strong>of</strong> the polyoses from S2-S3 layers soluble in strong alkali points to some<br />
increase <strong>of</strong> HexA at the bleaching conditions used (no acidic stage applied).<br />
80<br />
B<br />
P-S1<br />
S2-S3<br />
Wavelength, nm
Conclusions<br />
COST Action E54 Book<br />
The analysis <strong>of</strong> the samples shows clearly that the composition <strong>of</strong> the papermaking fibres<br />
(eucalyptus kraft pulp) surface layers differs from that <strong>of</strong> the main part <strong>of</strong> the fibre wall. It was<br />
shown that in spite <strong>of</strong> rather exhaustive changes during bleaching, ISO brightness <strong>of</strong> the isolated<br />
surface layers remains much lower.<br />
The molecular data <strong>of</strong> the entire fibre wall are strongly influenced by the characteristics <strong>of</strong> the<br />
outer layer. This means that in technological processes, for example, during the bleaching, one<br />
has to consider not only the composition <strong>of</strong> the bulk fibre wall but also the properties <strong>of</strong> the<br />
comparatively tiny surface layers.<br />
It is concluded that the upgraded hydromechanical peeling method can provide pulp fibre wall<br />
fractions both for analytical procedures and for further treatment and conversion.<br />
Acknowledgements<br />
Authors from Riga would like to thank Latvian Science Council for financing the experimental<br />
work as a part <strong>of</strong> the Project Nr. 09.1547. Thanks go also to Sonja Schiehser for practical<br />
assistance with the preparation <strong>of</strong> samples for GPC-analysis.<br />
References<br />
Bohrn R., Potthast A., Schiehser S., Rosenau T., Sixta H. and Kosma P. (2006): The FDAM method:<br />
Determination <strong>of</strong> carboxyl pr<strong>of</strong>iles in cellulosic materials by combining group-selective fluorescence<br />
labeling with GPC. Biomacromolecules 7 (6), 1743-1750<br />
Gromov V.S., Purina L.T., Treimanis A., Konstantinova L.M. and Kampuse A. (1976): Distribution <strong>of</strong><br />
hemicelluloses and lignin in fiber walls <strong>of</strong> birch sulphite pulp. Khimiya Drevesini 5, 3-12<br />
Krause T. (1967): Änderung der morphologischen Struktur und chemischen Zusammensetzung von<br />
Zellst<strong>of</strong>f-Fasern bei mechanischer Abschälung der äusseren Wandschichten. Das Papier 21(7), 385-393<br />
Purina L., Treimanis A. and Timermane G. (1994): Distribution <strong>of</strong> residual lignin and hemicelluloses in<br />
the outer and central layers <strong>of</strong> organosolv pulp fiber walls. Nordic Pulp Paper Res. J. 9(2), 101-105, 119<br />
Röhrling J., Potthast A., Rosenau T., Lange T., Ebner G., Sixta H. and Kosma P. (2002): A novel method<br />
for the determination <strong>of</strong> carbonyl groups in cellulosics by fluorescence labeling. 1. Method development.<br />
Biomacromolecules 3 (5), 959-968<br />
Treimanis A. (2006): Advanced traditional methods <strong>of</strong> analysis <strong>of</strong> fiber surface layers – a powerful tool<br />
in research <strong>of</strong> lignocellulosics. La Chimica e l’Industria 88(2), 72-75<br />
Treimanis A., Potthast A., Henniges U., Rosenau T., Grinfelds U., Bikova T. and Skute M. (2008):<br />
Analysis <strong>of</strong> mechanically peeled kraft pulp fibres surface layers. Papíripar 2008, 52, 225-230<br />
Treimanis A., Grinfelds U. and Skute M. (2009): Are the pulp fiber surface layers the most resistant ones<br />
toward bleaching. Bioresources 4(2), 554-565<br />
81
COST Action E54 Book<br />
82
COST Action E54 Book<br />
COMPARISON OF TWO DIFFERENT METHODS FOR FIBER-FIBER<br />
BONDED AREA MEASUREMENT<br />
1 Lisbeth Kappel, 1 Ulrich Hirn, 1 Wolfgang Bauer and 2 Robert Schennach<br />
1 Graz University <strong>of</strong> Technology, Institute <strong>of</strong> Paper, Pulp and Fiber Technology,<br />
Kopernikusgasse 24/II, 8010 Graz, Austria<br />
2 Graz University <strong>of</strong> Technology, Institute <strong>of</strong> Solid State Physics, Petersgasse 16/II, 8010 Graz,<br />
Austria<br />
Abstract<br />
1,2 CD-Laboratory for Surface Chemical and Physical Fundamentals <strong>of</strong> Paper Strength<br />
ulrich.hirn@tugraz.at<br />
A method for measuring the bonded area <strong>of</strong> individual fiber-fiber bonds is presented. It is based<br />
on microtome serial sectioning and image analysis. The size and the three-dimensional structure<br />
<strong>of</strong> the bonded area are assessed together with the cross sectional fiber morphology. Additionally<br />
holes and unbonded fiber regions can be measured.<br />
Based on the above, polarized light microscopy was used as a non-destructive reference method.<br />
Both methods were compared and the results show that the bonded area is over- or<br />
underestimated using polarized light microscopy depending on the refining state <strong>of</strong> the pulp that<br />
is used. A factor for this over- and underestimation was determined for unrefined and refined<br />
pulp, respectively. The methods presented in this article lead to a deeper understanding <strong>of</strong> fiberfiber<br />
bonds and provide a basis for specific bonding strength measurements.<br />
Introduction<br />
Paper strength is developed from the strength <strong>of</strong> single fibers and the strength <strong>of</strong> the fiber-fiber<br />
bonds. Furthermore, the strength <strong>of</strong> the fiber-fiber bonds depends on the size <strong>of</strong> the bonded area<br />
as well as on the specific bonding strength. Non-destructive measurement <strong>of</strong> the bonded area in a<br />
fiber-fiber bond is a key goal to determine the specific bonding strength (bonding force per unit<br />
area) between fibers.<br />
In this study we will demonstrate that polarized light microscopy is a suitable tool for measuring<br />
the bonded area <strong>of</strong> individual fiber-fiber bonds. Polarized light microscopy, as developed by<br />
Page (1960), was applied for fiber-fiber bonded area measurement. Page states that under<br />
polarized vertical illumination bonded areas appear dark while unbonded areas are bright. In<br />
earlier studies it has already been shown that polarized light microscopy shows the bonded area<br />
correctly, if one <strong>of</strong> the fibers in the fiber-fiber bond is dyed black (Kappel et al. 2010b). Still, it<br />
is not applicable for undyed fibers (Kappel et al. 2010a). We compare the results from polarized<br />
light microscopy to a measurement where the bonded area is determined using a 3Drepresentation<br />
<strong>of</strong> the fiber-fiber bond obtained with a microtome serial sectioning technique<br />
(Kappel et al. 2009).<br />
Materials and Methods<br />
Used Pulp<br />
All experiments were performed with an unbleached Kraft pulp from spruce and pine wood.<br />
This pulp is usually used for the production <strong>of</strong> sack paper. Fiber-fiber bonds were prepared from<br />
unbeaten pulp as well as from pulp that was beaten during 9000 revolutions in a PFI mill. Half<br />
83
COST Action E54 Book<br />
<strong>of</strong> the fibers were dyed with Chlorazol Black and then dyed and undyed fibers were mixed<br />
creating bonds between the two types <strong>of</strong> fibers as given by Forsström and Torgnysdotter (2005).<br />
Measuring the three-dimensional bonded area<br />
The method for measuring the bonded area is based on microtome serial sectioning and image<br />
analysis. The size <strong>of</strong> the bonded area together with the three-dimensional structure <strong>of</strong> the bonded<br />
area and morphological parameters can be obtained from this method. The major steps <strong>of</strong> the<br />
method are shown in Figure 1.<br />
Figure 1. The same fiber-fiber bond under polarized light microscopy (a), in serial sectioning (b-d), after<br />
image analysis <strong>of</strong> one slice (e) and visualization <strong>of</strong> the 3D bonded area (f)<br />
A single fiber-fiber bond (Figure 1a) is prepared according to Forsström and Torgnysdotter<br />
(2005), embedded in resin and clamped in a microtome. Slices with a thickness <strong>of</strong> 3 µm are cut<br />
<strong>of</strong>f the embedded sample and the cutting area is imaged using an automated light microscope<br />
with an optical resolution <strong>of</strong> 0.16 µm/ pixel (Wiltsche et al. 2005). Figure 1b, c and d show<br />
images <strong>of</strong> the bond cross sections at different cutting positions. Fiber-fiber contact was<br />
determined by image analysis, yielding a bonding line for every cut, as indicated by the white<br />
line in Figure 1e. We are aware that the resolution <strong>of</strong> the optical microscope is too low to<br />
quantify whether the fibers really are in contact on a nanometer scale, we measure optically<br />
bonded area. Bonded area is calculated from bond line length and the cut thickness (3 µm). A<br />
three dimensional visualization <strong>of</strong> the bonding region was obtained by plotting these consecutive<br />
bonding lines (Figure 1f).<br />
The size and 3-dimensional structure <strong>of</strong> the optically bonded area is assessed together with cross<br />
sectional fiber morphology (fiber cross sectional area, fiber perimeter, fiber wall thickness, fiber<br />
collapse and fiber width). Holes and overlapping but unbonded regions <strong>of</strong> the fiber edges are<br />
also identified.<br />
Measuring the bonded area with polarized light<br />
Page (1960) introduced polarized light microscopy for bonded area measurement <strong>of</strong> fiber-fiber<br />
bonds. The phenomenology <strong>of</strong> the method can be described as follows. Light is linearly<br />
polarized, so waves with only one plane <strong>of</strong> oscillation are directed through the objective and to<br />
the surface <strong>of</strong> the sample, where it is reflected. The second polarizing filter is rotated 90°<br />
towards the first one, so that only optically modified light is able to pass it. Light that is reflected<br />
at surfaces under vertical illumination does not change its state <strong>of</strong> polarization. Therefore<br />
reflexes at surfaces are <strong>of</strong> negligible intensity. The geometry <strong>of</strong> the optical system at the fiber-<br />
84
COST Action E54 Book<br />
fiber bond yields very small reflected over-all intensities, so that the fiber-fiber bonds appear<br />
dark, while the inner reflection at the back surface <strong>of</strong> a single fiber yields reflected light with<br />
quite a high intensity and a changed polarization direction. Thus single fibers appear bright.<br />
The polarized light microscopy investigations were performed with a Leica Leitz DMRX<br />
microscope, which was equipped with crossed polarizing filters. A 20-fold objective with an<br />
optical resolution <strong>of</strong> 0.25 µm/Pixel was used. The images were taken with a Leica DFC290<br />
camera. The fiber-fiber bonds were imaged in eight different rotary positions, the image with the<br />
highest contrast was chosen for further analysis (Kappel et al. 2010b). The bonded area, which<br />
appears dark under polarized light microscopy, was drawn manually and the amount <strong>of</strong> pixels in<br />
the dark region was determined using image analysis. Bonded area was calculated by<br />
multiplying number <strong>of</strong> pixels times area per pixel.<br />
The bonded area was measured with polarized light microscopy and with microtomy. The size<br />
and shape <strong>of</strong> the bonded area were compared for the beaten and for the unbeaten pulp.<br />
Explaining the deviations between the methods<br />
Based on the measured morphological parameters several factors that may explain the deviations<br />
between the bonded areas measured with the two different methods were investigated. Multiple<br />
linear regression was performed to quantify the significance (F*-statistics) and impact<br />
(ANOVA) <strong>of</strong> the predictor variables (Neter et al.1996). The deviation between the measurement<br />
results was the response variable, all morphological parameters and the degree <strong>of</strong> bonding (holes<br />
and overlapping but unbonded regions <strong>of</strong> the fiber edges) were the predictor variables.<br />
Results and Discussion<br />
Comparison <strong>of</strong> bonded area for unbeaten pulp<br />
Bonded area <strong>of</strong> 73 fiber-fiber bonds was measured with polarized light microscopy and with the<br />
microtome serial sectioning method, the results are compared in Figure 2. The diagonal indicates<br />
equal values. In general the values show quite good agreement, although bonded area is<br />
overestimated more <strong>of</strong>ten by polarized light microscopy. On average the values measured with<br />
polarized light microscopy were 12.5 % higher for the investigated bonds.<br />
To explain this overestimation <strong>of</strong> bonded area a multiple linear regression model was built.<br />
Table 1 shows the significance (p-value <strong>of</strong> the F*-statistics) and the impact (ANOVA) <strong>of</strong> the<br />
variables. The results <strong>of</strong> the model are interpreted on basis <strong>of</strong> the stepwise R² values, i.e. the<br />
ANOVA. Because <strong>of</strong> redundancies and interactions the R² values alone are not really<br />
meaningful and are not used for interpretation <strong>of</strong> the results. The p-value shows the significance<br />
on a 95 % confidence level, this is the case if p is smaller than 0.05. Only the significant<br />
parameters are given in Table 1. It can be shown that unbonded fiber edges account for 56.7 %<br />
<strong>of</strong> the deviations (the R² value is 0.567). By adding the fraction <strong>of</strong> holes in the bond to the<br />
model, the stepwise R² value increased from 0.567 to 0.590, indicating that the holes in the bond<br />
explain further 2.3 % <strong>of</strong> the deviations. All other morphological parameters are not significant<br />
on a 95 % confidence level (i.e. p>0.05).<br />
85
COST Action E54 Book<br />
Figure 2. Comparison <strong>of</strong> bonded area measured with polarized light microscopy and with microtomy –<br />
unbeaten pulp<br />
Table 1. Results <strong>of</strong> multiple linear regression and ANOVA with the deviation <strong>of</strong> bonded area between<br />
microtomy and polarized light microscopy as the response variable<br />
Variable R² stepwise R² alone p-Value Sign <strong>of</strong> Coeff.<br />
Unbonded fiber edges 0.567 0.567
COST Action E54 Book<br />
Figure 3. Overestimation <strong>of</strong> bonded area with polarized light microscopy: the fold appears dark under<br />
polarized light, although the fibers are unbonded in this region (marked with white arrow)<br />
Comparison <strong>of</strong> bonded area for beaten pulp<br />
Fiber-fiber bonds <strong>of</strong> a highly beaten pulp were analyzed first with the polarized light microscope<br />
and then with the microtome. The size and the shape <strong>of</strong> bonded area <strong>of</strong> 68 fiber-fiber bonds were<br />
compared. In Figure 4 bonded area measured with polarized light microscopy is plotted versus<br />
bonded area measured with the microtome. The diagonal indicates equal values. In contrast to<br />
the unbeaten case, now bonded area is underestimated by polarized light microscopy in most<br />
cases (on average by 15.9 %).<br />
Figure 4. Comparison <strong>of</strong> bonded area measured with polarized light microscopy and with microtomy –<br />
beaten pulp<br />
87
COST Action E54 Book<br />
To explain the deviations between the measurement results again multiple linear regression<br />
modeling was performed. The mathematical model showed that none <strong>of</strong> the morphological<br />
parameters has a statistically significant influence on the deviations on a 95 % confidence level.<br />
It seems as if most <strong>of</strong> the deviations between the measurement results can be explained only with<br />
the fibrils on the beaten pulp fiber surfaces, which cannot be reproduced with any <strong>of</strong> the applied<br />
measurement methods. The fibrils cause additional reflections, so that the polarized light<br />
microscope images are brighter in total. In the crossing region these bright reflections are<br />
evaluated as unbonded fiber edges and holes in the bond.<br />
As an example, comparison <strong>of</strong> a polarized light microscope image with the fiber-fiber bond<br />
cross section is shown in Figure 5. The center <strong>of</strong> the bond appears brighter under the polarized<br />
light microscope (right), suggesting that the fibers are unbonded in this area. Also the fiber edges<br />
appear as unbonded under the polarized light. However, the microtome image on the left shows<br />
that the fibers are optically bonded over the entire length. This comparison confirms the<br />
assumption that additional reflections caused by fibrils are the origin <strong>of</strong> underestimation <strong>of</strong> the<br />
bonded area in the case <strong>of</strong> beaten pulp.<br />
Figure 5. Underestimation <strong>of</strong> bonded area with polarized light microscopy: fibrils on the fiber surface<br />
are evaluated as holes in the bond and as unbonded fiber edges<br />
Conclusions<br />
The comparison <strong>of</strong> the two different methods showed that polarized light microscopy is an<br />
appropriate tool for fiber-fiber bonded area measurement. However, for unbeaten pulp the<br />
bonded area is overestimated while it is underestimated for beaten pulp. If these deviations are<br />
considered polarized light microscopy provides a non-destructive method for bonded area<br />
measurement. It can be applied in combination with micro tensile testing <strong>of</strong> fiber-fiber bonds in<br />
order to determine the specific bonding strength.<br />
Acknowledgement<br />
The authors want to acknowledge Mondi and the Christian Doppler Society for funding this<br />
work. The financial support by the Federal Ministry <strong>of</strong> Economy, Family and Youth and the<br />
National Foundation for Research, Technology and Development is gratefully acknowledged.<br />
88
References<br />
COST Action E54 Book<br />
Forsström J. and Torgnysdotter A. (2005): Influence <strong>of</strong> fibre/ fibre joint strength and fibre flexibility on<br />
the strength <strong>of</strong> papers from unbleached kraft fibers. Nordic Pulp Paper Res. J. 20(2), 186-191<br />
Kappel L., Hirn U., Bauer W. and Schennach R. (2009): A novel method for the determination <strong>of</strong> bonded<br />
area <strong>of</strong> individual fiber-fiber bonds. Nordic Pulp Paper Res. J. 24(2), 199-205<br />
Kappel L., Hirn U., Gilli E., Bauer W. and Schennach R. (2010a): Revisiting polarized light microscopy<br />
for fiber-fiber bond area measurement - Part I: Theoretical Fundamentals. Nordic Pulp Paper Res. J.<br />
25(1), 71-75<br />
Kappel L., Hirn U., Gilli E., Bauer W. and Schennach R. (2010b): Revisiting polarized light microscopy<br />
for fiber-fiber bond area measurement - Part II: Proving the applicability. Nordic Pulp Paper Res. J.<br />
25(1), 65-70<br />
Neter J., Kutner M.H., Nachtsheim C.J. and Wassermann W. (1996): Applied Linear Statistical Models,<br />
Fourth Edition, Richard D. Irwin. Illinois (USA)<br />
Page D.H. (1960): Fibre-to-fibre bonds Part 1 – A method for their direct observation. Paper Technology<br />
1(4), 407-411<br />
Wiltsche M., Donoser M., Bauer W. and Bisch<strong>of</strong> H. (2005): A New Slice-Based Concept for 3D Paper<br />
<strong>Structure</strong> Analysis Applied to Spatial Coating Layer Formation. In Advances in Paper Science and<br />
Technology, Fund. Res. Symp., Cambridge, 853-899<br />
89
COST Action E54 Book<br />
90
COST Action E54 Book<br />
PULP DEWATERING AND REFINING EFFICIENCY IMPROVEMENT BY<br />
CELLULASE TREATMENT<br />
Abstract<br />
Ivo V. Valchev, Petar Y. Bikov<br />
University <strong>of</strong> Chemical Technology and Metallurgy<br />
8 Kl. Ohridski, 1756 S<strong>of</strong>ia, Bulgaria<br />
ivoval@uctm.edu<br />
Refining and pulp drying are the most energy-intensive processes in the production <strong>of</strong> paper and<br />
boards. The usage <strong>of</strong> cellulases products is one <strong>of</strong> the modern methods to improve dewatering<br />
and refining efficiency.<br />
The enzyme treatment was performed with the Novozymes AS cellulase product FiberCare ® D.<br />
The carried out investigation shows the positive effect <strong>of</strong> enzyme treatment on the secondary<br />
fiber dewatering. The obtained results <strong>of</strong> enzyme action can be interpreted by partial destruction<br />
<strong>of</strong> colloidal substances <strong>of</strong> secondary fibers.<br />
The effect <strong>of</strong> enzyme treatment on the pulp strength properties shows insignificant increasing <strong>of</strong><br />
breaking length, while the tear index and the burst index decrease. Probably the FiberCare ® D<br />
action at low enzyme charge contributes to an improvement <strong>of</strong> the paper structure independent<br />
<strong>of</strong> fiber degradation processes. Optimal balance between paper qualities and pulp dewatering is<br />
reached at low level enzyme charge.<br />
The pre-refining cellulase treatment <strong>of</strong> Svilocell and eucalyptus bleached pulp significant<br />
improves beating efficiency without pulp strength properties loss. The influence <strong>of</strong> enzyme<br />
treatment on the pulp yield and waste water pollution are not significant.<br />
FiberCare ® D is able to waste paper dewatering improvement and is a prerequisite for dryer<br />
steam consumption decreasing, refining energy costs saving and paper machine capacity<br />
increasing.<br />
Introduction<br />
Cellulase pulp treatment has been investigated for several years, with the goal <strong>of</strong> achieving<br />
improved refining efficiency and fiber dewatering. There are two methods for enzyme treatment.<br />
Addition <strong>of</strong> enzyme prior to refining has a very different effect compared with a post-refining<br />
treatment. Pre-refining application results in improved refining efficiency, while a post-refining<br />
treatment results in increased furnish freeness. A combination <strong>of</strong> the two can provide optimized<br />
strength and drainage benefits. This has been reported earlier (Moran 1996). Beating and<br />
refining are mechanical processes that enhance fibrillation and inter-fiber bonding. Properly<br />
applied, cellulases can enhance or restore fiber strength, reduce beating times, and increase interfiber<br />
bonding through fibrillation. A correctly applied enzyme treatment provides a tool that can<br />
improve recycled paperboard operations. This is accomplished by treating the refined stock with<br />
an enzyme blend to recover a portion <strong>of</strong> the freeness typically lost through refining. A prerefining<br />
enzyme treatment can help the papermaker meet strength tests more readily through<br />
improved refining efficiency. Mill experience has shown that a combination <strong>of</strong> these two<br />
methods can provide strength and drainage benefits.<br />
91
COST Action E54 Book<br />
Distinguishing feature <strong>of</strong> secondary fibers is the breaking down <strong>of</strong> cell walls, causing liberating<br />
fine particles, which grow swollen and change in gel form. They retain water, slow down the<br />
dewatering, impede drying, and causing over-consumption <strong>of</strong> chemicals in the paper production.<br />
It is a known fact reported by Moran (1996) and Skartaunm et al. (1995) that cellulase lead to<br />
breaking down the gel form structures. They can be applied to improve the drainage by<br />
hydrolyzing the most accessible parts <strong>of</strong> cellulose and hemicellulose present in the fibers, fines<br />
and dissolved colloidal substances. This has been reported earlier by Valtschev et al. (2001).<br />
Jackson et al. (1993) suggest that enzymes can either flocculate or hydrolysis fines and remove<br />
fibrils from the surface <strong>of</strong> large fibers. According to these authors, enzyme-aided flocculation<br />
occurred when a low enzyme dosage was used. In this case, fines and small fiber particles can<br />
aggregate with each other or with the larger fibers, decreasing the amount <strong>of</strong> small particles in<br />
the pulp and consequently improving pulp drainage. For higher enzyme concentration,<br />
flocculation became less significant, and fragmentation <strong>of</strong> the fibers began to predominate.<br />
Several authors (Miletzky 1996; Stock et al. 1995) have however observed a decrease in pulp<br />
strength properties by increase in enzyme quantities and reaction time.<br />
Surface properties may be modified, not only because <strong>of</strong> enzymatic hydrolysis <strong>of</strong> the outer<br />
layers <strong>of</strong> the fiber, but also because <strong>of</strong> adsorption <strong>of</strong> enzyme molecules onto the fiber surface. It<br />
could be speculated by Pala et al. (2006) that changes in fiber–water interaction, induced by the<br />
presence <strong>of</strong> enzyme molecules, might be the factor responsible for drainage and strength<br />
modification.<br />
The purpose <strong>of</strong> this work was to investigate the effect <strong>of</strong> the cellulase on refining and dewatering<br />
improvement and on pulp strength properties.<br />
Materials and Methods<br />
The investigations were performed with OCC pulp suplied by "Duropak - Trakia-Papir” AD –<br />
Pazardjik, deinking pulp provided by “Mayr-Melnh<strong>of</strong>” AD – Nikopol, bleached pulp supplied by<br />
Svilocell AD - Bulgaria and with bleached Brazilian eucalyptus pulp.<br />
The enzyme treatment was performed with the Novozymes AS cellulase product FiberCare ® D,<br />
which is designed to be effective, yet gentle on fibers. This is accomplished because FiberCare ®<br />
D takes advantage <strong>of</strong> Novozymes’ proprietary mono-component cellulase technology, resulting<br />
in a product that is highly specific and targeted in its action.<br />
The enzyme treatmant conditions were as follows: pulp consistency 6 and 10 %, temperature<br />
60 о С, reaction time 60 min., enzyme charge 0.025 – 0.5 %, and pH 4 – 7.<br />
The reducing sugars were determined according to a DNS method by Miller (1959).<br />
Pulp beating was performed with Jokro mill according to DIN 54360 at duration from 10 to 50<br />
min.<br />
Degree <strong>of</strong> refining was determined in a Schopper Riegler apparatus according to ISO 5267. Rate<br />
<strong>of</strong> dewatering was determined on the same apparatus.<br />
Pulp strength properties: breaking length, tear index and burst index were determined according<br />
to the ISO 1924, ISO 1974 and ISO 2758 respectively.<br />
92
Results and discussion<br />
COST Action E54 Book<br />
The effect <strong>of</strong> FiberCare ® D treatment on the dewatering time and refining degree <strong>of</strong> Duropak -<br />
Trakia-Papir OCC pulp is shown in Figure 1 & 2. The enzyme charge 0.05 – 0.2 % improved<br />
pulp dewatering by 20 - 45 % and refining degree up to 25% respectively. In paper production,<br />
dryer steam consumption could be reduced by over 4%. The obtained results <strong>of</strong> enzyme action<br />
can be interpreted to be due to partial degradation <strong>of</strong> colloidal substances <strong>of</strong> secondary fibers.<br />
That gel fraction retains water causing slower dewatering <strong>of</strong> secondary fibers.<br />
time, sec<br />
50<br />
45<br />
40<br />
35<br />
30<br />
25<br />
20<br />
0 %<br />
15<br />
10<br />
0.05%<br />
0.1 %<br />
5<br />
0<br />
0.2 %<br />
30 40 50 60 70<br />
Dewatering, %<br />
Figure 1. Influence <strong>of</strong> enzyme charge on the refining<br />
pulp dewatering rate, (pH 5, T=60°C and t =<br />
60 min)<br />
Figure 2. Effect <strong>of</strong> enzyme charge on the pulp<br />
degree (pH 5, T=60°C and t = 60 min)<br />
A similar study <strong>of</strong> cellulase action on the pulp dewatering was conducted with deinking pulp<br />
supplied by “Mayr-Melnh<strong>of</strong>” AD. Typical feature <strong>of</strong> that pulp is the present <strong>of</strong> fillers (basic<br />
CaCO3), pulp additives and mechanical fibers. A lower enzyme activity was found for this pulp,<br />
which makes it possible to charge a higher amount <strong>of</strong> FiberCare ® D and still obtain the same<br />
dewatering.<br />
The effect <strong>of</strong> enzyme treatment on the pulp strength properties is shown in Table 1. Breaking<br />
length slowly increased by the enzyme charge, while tear index and burst index decreased.<br />
Probably the FiberCare ® D action at low enzyme charge contributed to an improvement in paper<br />
structure independent <strong>of</strong> fiber destruction processes.<br />
Table 1. Effect <strong>of</strong> FiberCare ® D charge on the recovered paper strength properties<br />
Enzyme Duropak - Trakia-Papir OCC pulp Mayr-Melnh<strong>of</strong> – Nikopol deinking pulp<br />
charge, Breaking Tear index,<br />
% length, m mN.m 2 Burst index,<br />
/g kPa.m 2 Breaking Tear index,<br />
/g length, m mN.m 2 Burst index,<br />
/g kPa.m 2 /g<br />
0 2720 4.5 2.7<br />
0.05 2740 4.4 2.7<br />
0.1 3040 3.7 2.5 2790 4.0 2.5<br />
0.2 3000 3.3 2.2 3130 3.6 2.3<br />
0.5 2970 3.2 2.1<br />
Analysis <strong>of</strong> reduced sugars in the solution showed fiber losses <strong>of</strong> about 0.4 – 0.5 % which are<br />
connected with dissolving <strong>of</strong> colloidal substances. Optimal balance between paper qualities and<br />
pulp dewatering was reached at a low level <strong>of</strong> enzyme charge.<br />
The effect <strong>of</strong> cellulase charge in pre-refining <strong>of</strong> chemical pulp treatment on the pulp beating<br />
efficiency was studied. The results obtained for the two types <strong>of</strong> bleached pulp, presented in<br />
Figure 3, show a total refining degree increase with 14 SR and 24 SR for eucalyptus and<br />
93<br />
50<br />
45<br />
40<br />
35<br />
SR<br />
30<br />
25<br />
20<br />
15<br />
10<br />
5<br />
0<br />
0 0,05 0,1 0,2<br />
Enzyme charge, %
COST Action E54 Book<br />
Svilocell pulps respectively. The performed investigation on the effect <strong>of</strong> enzyme charge on the<br />
strength properties <strong>of</strong> the two types <strong>of</strong> pulp show improvement in the breaking length, while the<br />
tear index was not adversely affected by FiberCare ® D at low dosage (Table 2).<br />
Degree <strong>of</strong> refining, SR<br />
70<br />
60<br />
50<br />
40<br />
30<br />
20<br />
10<br />
0<br />
0 0.02 0.04 0.06 0.08 0.1 0.12<br />
Enzyme charge, %<br />
Svilocell<br />
pulp<br />
Figure 3. Influence <strong>of</strong> enzyme charge on the<br />
refining efficiency<br />
eucalyptus<br />
pulp<br />
Degreee <strong>of</strong> refining, SR<br />
60<br />
50<br />
40<br />
30<br />
20<br />
10<br />
0<br />
0.05%<br />
enzyme<br />
0 10 20 30 40 50 60<br />
time, min<br />
w ithout<br />
enzyme<br />
Figure 4. Effect <strong>of</strong> enzyme treatment (pH 4.5,<br />
T=60°C, t=60 min) on the rate <strong>of</strong> eucalyptus pulp<br />
beating<br />
Table 2. Influence <strong>of</strong> pre-refining cellulase charge on the pulp strength properties<br />
Enzyme Svilocell pulp, pH 6.5, T=60°C,<br />
Eucalyptus pulp, pH 4.5, T=60°C,<br />
charge,<br />
t = 60min<br />
t = 60min<br />
% Breaking Tear index,<br />
length, m mN.m 2 Burst index,<br />
/g kPa.m 2 Breaking Tear index,<br />
/g length, m mN.m 2 Burst index,<br />
/g kPa.m 2 /g<br />
0 5200 5.0 4.2 7800 5.2 5.6<br />
0.025 5300 5.1 4.2 7900 5.2 5.7<br />
0.050 5400 4.9 4.3 8200 5.3 6.4<br />
0.075 5450 4.7 4.3 8200 4.8 6.1<br />
0.1 5600 4.4 4.4 8100 4.6 6.0<br />
The influence <strong>of</strong> enzyme action on the rate <strong>of</strong> eucalyptus pulp beating can be seen in Figure 4. It<br />
can be observed that pulp refining degree 40 SR was reached 20 min. less in the case <strong>of</strong><br />
FiberCare ® D treatment. In the same time the pulp strength properties dependence between tear<br />
index and breaking length is common (Figure 5).<br />
Tear index, mN.m 2 /g<br />
5.5<br />
5.45<br />
5.4<br />
5.35<br />
5.3<br />
5.25<br />
5.2<br />
w ithout<br />
5.15<br />
enzyme<br />
5.1<br />
0.05%<br />
5.05<br />
5<br />
enzyme<br />
7000 7500 8000<br />
Breaking length, m<br />
8500 9000<br />
Figure 5. Influence <strong>of</strong> enzyme treatment on the<br />
eucalyptus pulp breaking length - tear index<br />
dependence<br />
Reducing sugars, %<br />
0.5<br />
0.4<br />
0.3<br />
0.2<br />
0.1<br />
0<br />
0 0.02 0.04 0.06 0.08 0.1 0.12<br />
Enzyme charge, %<br />
Svilocell pulp<br />
eucalyptus pulp<br />
Figure 6. Effect <strong>of</strong> enzyme charge on reducing<br />
sugar formation<br />
94
COST Action E54 Book<br />
Therefore the obtained significant beating improvement to a given refining degree by FiberCare ®<br />
D treatment at low enzyme dosage up to 0.05% did not affect on pulp strength properties, which<br />
can be developed with less refining energy requirements.<br />
The obtained reducing sugars as a result <strong>of</strong> enzyme treatment were in the range up to 0.4 %<br />
oven-dry pulp in relation to enzyme charge and type <strong>of</strong> pulp (Figure 6). At optimal dosage <strong>of</strong><br />
FiberCare ® D (0.025% for Svilocell pulp and 0.05% for eucalyptus pulp) the generated sugars<br />
were less than 0.2%. Therefore, after enzyme treatment the yield loss and waste water pollution<br />
were not significant.<br />
Conclusions<br />
The carried out investigations on cellulase treatment <strong>of</strong> secondary fiber materials by FiberCare ®<br />
D show an opportunity for significant improvement <strong>of</strong> pulp dewatering. Breaking length<br />
improvement at an optimum enzyme dosage was obtained, and the cellulase affected mainly<br />
dissolved colloidal substances and slightly reduced the pulp yield. FiberCare ® D efficiency<br />
depends on the type <strong>of</strong> secondary fibers and enzyme activity decreases on the presence <strong>of</strong> fillers<br />
and pulp additives. The pre-refining enzyme treatment significantly improved beating efficiency<br />
without pulp strength properties deterioration. At optimal FiberCare ® D dosages 0.025% -<br />
0.05%, the yield loss and waste water pollution were not significant.<br />
The established effect <strong>of</strong> the enzyme treatment on pulp beating or waste paper dewatering is a<br />
prerequisite for decreasing dryer steam consumption, for refining energy cost saving and for<br />
paper machine capacity increase.<br />
References<br />
Jackson L., Heitmann J. and Joyce T. (1993): Enzymatic modifications <strong>of</strong> secondary fibre. Tappi J. 76(3),<br />
147–154<br />
Miletzky F. (1996): Biotechnology in the pulp and paper industry. In: Biotechnol. Pulp Paper Ind. Recent<br />
Advances in Applied and Fundamental Research. Eds: Srebotnik, E. and Messner, K. Facultas-<br />
Universitätsverlag, Wien, 1996, pp. 9-15<br />
Miller G. (1959): Use <strong>of</strong> Dinitrosalicylic Acid Reagent for Determination <strong>of</strong> Reducing Sugar. Anal.<br />
Chem. 31, 426 -/428<br />
Moran B. (1996): Enzyme treatment improves refining efficiency, recycled fiber freeness. Pulp and Paper<br />
70(9), 119-121<br />
Pala H., Mota M. and Gama F. (2002): Enzymatic Modification <strong>of</strong> Paper <strong>Fibres</strong>. Biocatalysis and<br />
Biotransformation 20 (5), 353–361<br />
Skartaunm P., Reinhardt B. and Trasser G. (1995): Einfluss der Enzyme als Entwässerungs - und<br />
Hilfsmittel bei der Mahlung in der Papierindustrie, PTS - VB 02/95 - PTS-TUD-Symposium<br />
"Zellst<strong>of</strong>ftechnik für Papier", 1995, 5, Dresden<br />
Stock G., Pereira H., Wood T. and Dusterh<strong>of</strong>t E. (1995): Upgrading recycled pulps using enzymatic<br />
treatment. Tappi J. 78(2), 79<br />
Valtschev I., Bentscheva S. and Christova E. (2001): Einfluss der Enzyme bei der Veredlung von<br />
Sekundärfaserst<strong>of</strong>fen. Wochenblatt für Papierfabrikation 20, 1348-1351<br />
95
COST Action E54 Book<br />
96
COST Action E54 Book<br />
INFLUENCE OF CELLULASE TREATMENT ON THE INDIVIDUAL<br />
FIBER STRUCTURE AND THE PAPERMAKING PROPERTIES<br />
Abstract<br />
Ivo V. Valchev 1 , Ventsislav N. Blyahovski 1 , Petar Y. Bikov 1 , Sanchi K. Nenkova 1 and<br />
Harald Grossmann 2<br />
1 UCTM, S<strong>of</strong>ia, Bulgaria, e-mail: ivoval@uctm.edu<br />
2 TU, Dresden, Germany, e-mail: harald.grossmann@tu-dresden.de<br />
Traditionally, chemical and mechanical treatments have been used in fiber processing. Such<br />
treatments affect the morphology <strong>of</strong> the fiber-wall structure at micro and nano level. The use <strong>of</strong><br />
enzyme to modify the fiber surfaces and properties <strong>of</strong> paper fibres has received increasing<br />
interest. Cellulase treatment was observed to give internal fibrillation <strong>of</strong> the fibres and resulted<br />
in defects <strong>of</strong> the fiber surfaces. The defects were more prevalent at higher enzyme dosage. These<br />
results indicate that the enzyme action is local. The existing fiber defect might be the starting<br />
point <strong>of</strong> the enzyme action.<br />
Beating and refining are mechanical processes that enhance fibrillation and inter-fiber bonding.<br />
Properly applied, cellulases can enhance or restore fiber strength, reduce beating time, and<br />
increase inter-fiber bonding through fibrillation. A pre-refining enzyme treatment can help the<br />
papermaker to meet strength tests more readily through improved refining efficiency.<br />
The purpose <strong>of</strong> this work was to investigate the impact <strong>of</strong> cellulase treatment on the structure <strong>of</strong><br />
the individual fibers, as well as on the beating efficiency, the pulp strength properties and the<br />
correlations between them.<br />
The research was made with hardwood pulp provided by "Svilocell” AD, Svishov, and Brazilian<br />
eucalyptus pulp.<br />
It has been established that the pre-refining cellulase treatment at optimal FiberCare® B dosage<br />
significantly improves the beating efficiency. Enzyme treatment reduced Svilocell fiber length<br />
and fiber volume and increased the fines fraction, compared to the eucalyptus pulp. In spite <strong>of</strong><br />
some reduction in the length <strong>of</strong> individual fibers, the strength properties <strong>of</strong> the hand-made pulp<br />
sheets were not much affected.<br />
The established FiberCare® B effects on the pulp beating is a precondition for refining energy<br />
cost saving and for reduced use <strong>of</strong> paper chemicals.<br />
Introduction<br />
The pulp and paper industry processes large quantities <strong>of</strong> lignocellulosic biomass every year.<br />
The technology for pulp manufacture is highly diverse, and numerous opportunities exist for the<br />
application <strong>of</strong> microbial enzymes. Historically, enzymes have found some uses in the paper<br />
industry, but these have been mainly confined to areas such as modifications <strong>of</strong> raw starch.<br />
However, a wide range <strong>of</strong> applications in the pulp and paper industry have now been identified.<br />
The use <strong>of</strong> enzymes in the pulp and paper industry has grown rapidly since the mid 1980s. While<br />
many applications <strong>of</strong> enzymes in the pulp and paper industry are still in the research and<br />
development stage, several applications have found their way into the mills in an unprecedented<br />
short period <strong>of</strong> time. This has been reported earlier (Bajpai 1999).<br />
97
COST Action E54 Book<br />
Jackson et al. (1993) suggested that enzymes can either flocculate or hydrolysis fines and<br />
remove fibrils from the surface <strong>of</strong> large fibers. According to these authors, the enzyme-aided<br />
flocculation occurs when a low enzyme dosage is used. In this case, fines and small fiber<br />
particles aggregate with each other or with the larger fibers, decreasing the amount <strong>of</strong> small<br />
particles in the pulp and consequently improving pulp drainage. For higher enzyme<br />
concentration, flocculation becomes less significant, and fragmentation <strong>of</strong> the fibers begins to<br />
predominate. A numbers <strong>of</strong> authors (Miletzky 1996; Stock et al. 1995) have observed that pulp<br />
strength properties decrease at increase <strong>of</strong> enzyme quantities and by increased reaction time.<br />
A related strategy is to add cellulase enzymes to papermaking furnish after the refining. The<br />
object then is to remove very fine, fibrillar material from the suspension and from fiber surfaces<br />
so that water can drain more easily. In principle, better dewatering means that less water has to<br />
be evaporated in the dryer section <strong>of</strong> a paper machine - a major area <strong>of</strong> energy consumption.<br />
More <strong>of</strong>ten, however, the faster dewatering rates mean increased machine speeds and higher<br />
production rates. The same thing was reported by (King et al. 1998).<br />
The extent <strong>of</strong> the modification <strong>of</strong> fiber morphology by the action <strong>of</strong> cellulases remains unclear.<br />
However, if the enzymes could selectively alter the outermost surfaces <strong>of</strong> pulp fibers, it is<br />
possible that inherent characteristics, such as stiffness and collapsibility, could be modified to<br />
enhance conformability and inter-fiber bonding. This is given by (Blanco et al. 1998; Mansfield<br />
et al.1997). Drying <strong>of</strong> the fibers results in a hornification phenomenon whose consequences can<br />
clearly be observed by the deterioration <strong>of</strong> fiber properties as reported by Jayme (1994) and<br />
Weise (1998).<br />
Our previous investigations on cellulase treatment <strong>of</strong> secondary fiber materials by FiberCare ® D<br />
indicated an opportunity for significant improvement <strong>of</strong> pulp dewatering. The pre-refining<br />
cellulase treatment significantly improved beating efficiency, without deterioration <strong>of</strong> pulp<br />
strength properties. At optimal dosages, the yield loss and waste-water pollution were low.<br />
The purpose <strong>of</strong> this work was to investigate the impact <strong>of</strong> cellulase treatment on the structure <strong>of</strong><br />
the individual fibers, as well as on beating efficiency, pulp strength properties and correlations<br />
between them.<br />
Materials and Methods<br />
The research was made with mixture hardwood kraft pulp provided by "Svilocell” AD, Svishov,<br />
and Brazilian eucalyptus pulp.<br />
The cellulase product FiberCare® B by Novozymes AS Denmark was used in the selected<br />
conditions; pulp consistence 6 %, temperature 60 °С, reaction time 60 min., enzyme charge<br />
0,0125 % - 0,05 % and pH 5 - 6.<br />
Pulp beating was performed with a Jokro mill according to ISO 5264-3. The degree <strong>of</strong> refining<br />
was determined in a Schopper-Riegler apparatus, according to ISO 5267-1. Pulp strength<br />
properties were determined according to ISO 1924-2 and ISO 1974.<br />
The fiber structure was measured on kajaani FiberLab, according to ISO 16065-1 and SEM on<br />
JEOL JSM-5510.<br />
98
Results and Discussion<br />
COST Action E54 Book<br />
Cellulase pre-refining treatment shows that beating efficiency increased by 15 SR and 17 SR for<br />
eucalyptus and Svilocell pulp respectively (Figure 1). Higher SR was due to the production <strong>of</strong><br />
more fines after pulp treatment by FiberCare B. It seems as if the effect <strong>of</strong> the treatment was<br />
more visible in the Svilocell pulp than in the eucalyptus pulp. Enzyme treatment <strong>of</strong> eucalyptus<br />
pulp improved beating efficiency without fiber length reduction at 0.05% dosage (Figure 2).<br />
SR<br />
80<br />
70<br />
60<br />
50<br />
40<br />
30<br />
20<br />
10<br />
0<br />
without<br />
enzyme<br />
enzyme<br />
charge,<br />
0,0125%<br />
0 10 20 30 40 50 60<br />
Time, min<br />
Figure 1. Effect <strong>of</strong> enzyme treatment on the rate <strong>of</strong><br />
Svilocell hardwood pulp beating<br />
Fiber length, mm L(l)<br />
1<br />
0.9<br />
0.8<br />
0.7<br />
0.6<br />
0.5<br />
0.4<br />
0.3<br />
0.2<br />
without enzyme<br />
0.1<br />
0<br />
enzyme charge,0,05%<br />
10 20 30 40 50 60<br />
Figure 2. Effect <strong>of</strong> enzyme treatment on<br />
eucalyptus pulp fiber length during beating<br />
Different dosage <strong>of</strong> FiberCare® B treatment lead to a larger Svilocell fiber length reduction as<br />
compared with eucalyptus pulp (Figure 3), giving effects on the pulp strength properties. For the<br />
Svilocell pulp it is recommended that the enzyme is dosed at a low amount, in order not to<br />
decrease the strength properties. The morphology <strong>of</strong> Svilocell pulp required lower enzyme<br />
dosage (0.0125 %).<br />
Fiber length, mm L(l)<br />
1<br />
0.9<br />
0.8<br />
0.7<br />
0.6<br />
0.5<br />
0.4<br />
without enzyme<br />
0.3<br />
enzyme charge, 0,05%<br />
0.2 enzyme charge, 0,025%<br />
0.1<br />
0<br />
enzyme charge, 0,0125%<br />
10 30 50<br />
SR<br />
70 90<br />
Figure 3. Influence <strong>of</strong> enzyme treatment on the<br />
Svilocell fiber length during beating<br />
Tear index, mN.m 2 /g<br />
8<br />
7<br />
6<br />
5<br />
4<br />
3<br />
SR<br />
2<br />
enzyme<br />
1<br />
0<br />
charge<br />
0,0125%<br />
2000 4000 6000 8000 10000<br />
Breaking length, m<br />
without<br />
enzyme<br />
Figure 4. Svilocell pulp breaking length – tear<br />
index dependence<br />
FiberCare® B pre-refining treatment reduced the tear index <strong>of</strong> Svilocell pulp while the<br />
eucalyptus pulp was not affected at low dosage (Figure 4 and 5).<br />
99
Tear index, mN.m 2 /g<br />
6<br />
5,5<br />
5<br />
4,5<br />
4<br />
7000 7500 8000 8500 9000<br />
Breaking length, m<br />
COST Action E54 Book<br />
without<br />
enzyme<br />
enzyme<br />
charge,<br />
0,05%<br />
Figure 5. Eucalyptus pulp breaking length tear<br />
index dependence<br />
Viscosity, ml/g<br />
1000<br />
900<br />
800<br />
700<br />
600<br />
500<br />
400<br />
300<br />
200<br />
svilocell pulp<br />
100<br />
0<br />
eucalyptus<br />
pulp<br />
0 0,01 0,02 0,03 0,04 0,05 0,06<br />
Enzyme charge, %<br />
Figure 6. Influence <strong>of</strong> enzyme charge on<br />
Svilocell and eucalyptus pulp viscosity<br />
With increasing <strong>of</strong> FiberCare® B charge, the pulp viscosity slightly dropped and a correlation<br />
between fiber length and viscosity was observed (Figure 6 and 7).<br />
Fiber length, mm L(l)<br />
1<br />
0.95<br />
0.9<br />
0.85<br />
svilocell pulp<br />
0.8<br />
620 640 660<br />
Viscosity, ml/g<br />
680 700<br />
Figure 7. Svilocell pulp fiber length – viscosity dependence as a result <strong>of</strong> enzyme dosage<br />
FiberCare® B treatment lead to a larger Svilocell fiber volume reduction as compared with the<br />
eucalyptus pulp (Figure 8 and 9). With increasing enzyme dosage and SR the fiber volume was<br />
reduced with about 50%. This can positively affect paper printing properties. The effect on the<br />
eucalyptus pulp was minimal (Figure 9).<br />
The fines fraction <strong>of</strong> FiberCare® B treated Svilocell pulp was a few times higher as compared<br />
with the eucalyptus hardwood pulp. This is probably due to differences in fiber morphology,<br />
which varied more in the Svilocell hardwood pulp. The cellulase reacts dominantly on the fiber<br />
surface and increased fines, which reflects on the beating efficiency. In the Svilocell pulp the<br />
fines fraction increased strongly with about 15 % (Figure 10), while fines fraction in the<br />
eucalyptus pulp increased insignificantly at the same enzyme dosage (Figure 11). For both types<br />
<strong>of</strong> pulps, FiberCare® B did not affect the fibrillation index (Figure 12 and 13).<br />
FiberCare® B did not affect cell wall thickness and cross section area (CSA), because the<br />
enzyme reacts mostly on the fiber surface for both cellulose pulp types (Figure 14 and 15).<br />
100
Fiber Volume (l).10 -6 ,µm 3<br />
0.2<br />
0.18<br />
0.16<br />
0.14<br />
0.12<br />
0.1<br />
0.08<br />
0.06<br />
0.04<br />
0.02<br />
0<br />
0 20 40 60 80 100<br />
SR<br />
COST Action E54 Book<br />
without enzyme<br />
enzyme 0,05%<br />
enzyme 0,025%<br />
enzyme 0,0125%<br />
Figure 8. Influence <strong>of</strong> enzyme treatment on<br />
Svilocell fiber volume during beating<br />
<strong>Fine</strong>s, %<br />
30<br />
25<br />
20<br />
15<br />
10<br />
5<br />
0<br />
without enzyme<br />
enzyme 0,05%<br />
enzyme 0,025%<br />
enzyme 0,0125%<br />
10 30 50 70 90<br />
SR<br />
Figure 10. Influence <strong>of</strong> enzyme treatment on the<br />
Svilocell pulp fines fraction during beating<br />
Fibrillation Index, %<br />
5<br />
4.5<br />
4<br />
3.5<br />
3<br />
2.5<br />
2<br />
1.5<br />
1<br />
without enzyme enzyme 0,05%<br />
0.5<br />
0<br />
enzyme 0,025% enzyme 0,0125%<br />
0 20 40 60 80 100<br />
SR<br />
Figure 12. Influence <strong>of</strong> enzyme treatment on the<br />
Svilocell pulp fibrillation index during beating<br />
101<br />
Fiber Volume (l).10 -6 ,µm 3<br />
0.2<br />
0.18<br />
0.16<br />
0.14<br />
0.12<br />
0.1<br />
0.08<br />
0.06<br />
0.04<br />
0.02<br />
0<br />
0 10 20 30 40 50 60<br />
Figure 9. Influence <strong>of</strong> enzyme treatment on<br />
eucalyptus fiber volume during beating<br />
<strong>Fine</strong>s, %<br />
5<br />
4.5<br />
4<br />
3.5<br />
3<br />
2.5<br />
2<br />
1.5<br />
1<br />
0.5<br />
SR<br />
without<br />
enzyme<br />
enzyme 0,05%<br />
0<br />
10 30 50 70 90<br />
SR<br />
without<br />
enzyme<br />
enzyme<br />
0,05%<br />
Figure 11. Influence <strong>of</strong> enzyme treatment on the<br />
eucalyptus fines fraction during beating<br />
Fibrillation Index, %<br />
4.5<br />
4<br />
3.5<br />
3<br />
2.5<br />
2<br />
1.5<br />
1<br />
without enzyme<br />
0.5<br />
0<br />
enzyme 0,05%<br />
0 10 20 30 40 50 60<br />
Figure 13. Influence <strong>of</strong> enzyme treatment on the<br />
eucalyptus pulp fibrillation index during beating<br />
SR
Cross Section Area, µm 2<br />
200<br />
180<br />
160<br />
140<br />
120<br />
100<br />
80<br />
60<br />
40<br />
without enzyme enzyme 0,05%<br />
20<br />
0<br />
enzyme 0.025% enzyme 0,0125%<br />
0 20 40 60 80 100<br />
Figure 14. Influence <strong>of</strong> enzyme treatment on<br />
Svilocell CSA during beating<br />
Scanning electron microscopy, SEM<br />
SR<br />
COST Action E54 Book<br />
Cross Section Area, µm 2<br />
200<br />
180<br />
160<br />
140<br />
120<br />
100<br />
80<br />
60<br />
40<br />
20<br />
0<br />
without enzyme<br />
enzyme 0,05%<br />
0 20 40 60 80<br />
SR<br />
Figure 15. Influence <strong>of</strong> enzyme treatment on the<br />
eucalyptus pulp CSA during beating<br />
SEM was applied to make certain fiber wall characteristics visible. The SEM images <strong>of</strong> the<br />
Svilocell hardwood and the eucalyptus pulps reveal that the enzyme-modified fibers have a<br />
cleaner surface (Figures 16-20). That can give reduced chemicals consumption in paper<br />
production and open up new possibilities for further fiber processing. Some fibrillation which is<br />
due to the enzyme action was observed.<br />
Figure 16. Svilocell pulp without enzyme Figure 17. Svilocell pulp treated with 0.0125%<br />
FiberCare® B<br />
102
COST Action E54 Book<br />
Figure 18. Svilocell pulp treated with 0.05% FiberCare® B<br />
Figure 19. Eucalyptus pulp without enzyme Figure 20. Eucalyptus pulp treated with 0.05%<br />
FiberCare® B<br />
Conclusions<br />
The pre-refining cellulase treatment at optimal enzyme dosage significantly improved the<br />
beating efficiency and increased the amount <strong>of</strong> fines. For the Svilocell pulp it was found that the<br />
optimal cellulase dosage is 0.0125%, while for the eucalyptus pulp that dosage is 0.05%.<br />
FiberCare® B treatment more significantly reduced Svilocell fiber length and fiber volume and<br />
increased the fines fraction, as compared with eucalyptus pulp.<br />
Cellulase did neither affect the fibrillation index, nor the cell wall thickness nor cross section<br />
area.<br />
SEM imaging <strong>of</strong> the pulps showed that the enzyme action modified the fiber surfaces which<br />
<strong>of</strong>fer new possibilities in fiber processing.<br />
The established FiberCare® B effects on pulp beating may be considered as a pre-condition for<br />
saving <strong>of</strong> refining energy costs and reduction in paper chemicals. Further investigations will be<br />
carried out to find the effects <strong>of</strong> cellulase treatment on chemical consumption in papermaking<br />
and on properties <strong>of</strong> different paper types.<br />
103
References<br />
COST Action E54 Book<br />
Bajpai P. (1999): Application <strong>of</strong> Enzymes in the Pulp and Paper Industry. Biotechnol. Prog. 15, 147-157<br />
Blanco A., Díaz P., Martínez J., Vidal T., Torres A. and Pastor F. (1998): Cloning <strong>of</strong> a new<br />
endoglucanase gene from Bacillus sp. BP-23 and characterisation <strong>of</strong> the enzyme. Performance in paper<br />
manufacture from cereal straw. Appl. Microbiol. Biotechnol. 50, 48- 54<br />
Jackson L., Heitmann J. and Joyce T. (1993): Enzymatic modifications <strong>of</strong> secondary fibre. Tappi J. 76(3),<br />
147–154<br />
Jayme G. (1994): Mikro-Quellungsmessungen an Zellst<strong>of</strong>fen. Wochenbl. Papierfabr. 6, 187–194<br />
King V., Dykstra G. and Glover D. (1998): Chemistry holds key to maintaining speed in today's paper<br />
machines. Tappi J. 81(7), 58-61<br />
Mansfield S. and Saddler J. (1997): The use <strong>of</strong> enzymes to enhance Douglas-fir pulp characteristics. In:<br />
Biol. Sci. Symp. Tappi Press, San Francisco, California, pp. 279 – 282<br />
Miletzky F. (1996): Biotechnology in the pulp and paper industry. In: Biotechnol. Pulp Paper Ind. Recent<br />
Advances in Applied and Fundamental Research. Eds: Srebotnik, E. and Messner, K. Facultas-<br />
Universitätsverlag, Wien, 1996, pp. 9-15<br />
Stock G., Pereira H., Wood T. and Dusterh<strong>of</strong>t E. (1995): Upgrading recycled pulps using enzymatic<br />
treatment. Tappi J. 78(2), 79-88<br />
Weise U. (1998): Hornification. Mechanisms and Terminology. Paperi ja Puu. Paper and Timber 80,<br />
110–115<br />
104
COST Action E54 Book<br />
CHARACTERIZATION OF INITIAL AND MODIFIED SAMPLES OF<br />
BLEACHED KRAFT PULP AND COTTON CELLULOSE<br />
Abstract<br />
Michael Ioelovich<br />
Designer Energy Ltd, Rehovot, Israel<br />
E-mail: bd895892@zahav.net.il<br />
Morphology, chemical composition, supermolecular structure and properties <strong>of</strong> initial and<br />
modified samples <strong>of</strong> bleached Kraft pulp and cotton cellulose have been studied. The initial<br />
cellulose samples were characterized by increased content <strong>of</strong> α-cellulose, absence <strong>of</strong> lignin and<br />
high brightness. The lower ordered pulp had a higher reactivity at acid hydrolysis and<br />
alkalization than the more ordered cotton cellulose. Treatment with boiling acid to prepare<br />
microcrystalline cellulose lead to increased crystallinity and lateral size <strong>of</strong> crystallites, while<br />
mercerization <strong>of</strong> the initial cellulose samples caused formation <strong>of</strong> CII crystalline polymorph,<br />
decreasing <strong>of</strong> crystallinity, lateral size, and length <strong>of</strong> crystallites. Cellulose properties such as<br />
specific volume, accessibility at deuteration, wetting enthalpy and sorption <strong>of</strong> water vapor,<br />
correlated with the content <strong>of</strong> non-crystalline domains and crystallinity. This permits forecast <strong>of</strong><br />
some essential properties <strong>of</strong> the cellulose on the base <strong>of</strong> its crystallinity degree. And vice versa,<br />
testing <strong>of</strong> sample properties, e.g. sorption <strong>of</strong> water vapor, permitted estimation <strong>of</strong> crystallinity<br />
and content <strong>of</strong> non-crystalline domains in cellulose.<br />
Keywords: Cellulose, <strong>Structure</strong>, Properties, Correlations<br />
Introduction<br />
Various physical, physico-chemical, chemical and biological methods have been used to study<br />
structure and properties <strong>of</strong> cellulose samples. Along with standard, also advanced methods are<br />
applied for the characterization <strong>of</strong> celluloses. One problem is that various companies, institutions<br />
and researches have different equipments and investigation methods giving different testing<br />
results. Therefore COST Action E54 in 2007-2008 decided to use common pulp samples to be<br />
analyzed by the Action members by standard and advanced techniques. A bleached Kraft pulp<br />
produced by Södra Cell in Sweden, was a second Common Pulp produced for this purpose.<br />
Along with wood pulps, also cotton celluloses take a significant place in papermaking. Cotton<br />
can be used for production high-quality and specialty paper types, such as tissue paper, technical<br />
papers, albums, drawing, and some printing papers, banknote and document papers, etc. In<br />
addition, cellulose is a base material for production <strong>of</strong> some derivatives such as modified<br />
celluloses, e.g. microcrystalline, mercerized and regenerated cellulose, as well as cellulose esters<br />
and ethers. In this case reactivity <strong>of</strong> cellulose plays a vital part.<br />
The purpose <strong>of</strong> this paper was to characterize original and modified samples <strong>of</strong> the bleached<br />
Kraft pulp and cotton cellulose using standard and advanced methods.<br />
Materials and Methods<br />
Bleached Kraft pulp (Common Pulp II) was received in July 2008. The pulp (Södra Cell,<br />
Sweden) contained a mixture spruce (Picea abies) and pine (Pinus sylvestris) in a weight ratio <strong>of</strong><br />
about 80:20, and 0.1% Klason lignin, 83.8% cellulose and 14.3% hemicelluloses as analyzed by<br />
Stora Enso, Karlstad, Sweden (cf. Table 4c in Heinemann and Ander 2011).<br />
105
COST Action E54 Book<br />
The middle-length fibers “Acala” was used as initial cotton material. Cotton cellulose was<br />
prepared by soda cooking <strong>of</strong> the initial cotton fibers. Cooking solution contained 1% NaOH,<br />
0.5% H2O2 and 0.5% non-ionic surfactant Tergitol NP-9. Cooking was carried out at temperature<br />
150 °C for 3 h.<br />
Samples <strong>of</strong> microcrystalline cellulose (MCC) were obtained by treatment <strong>of</strong> initial cellulose<br />
materials with boiling 2 N HCl for 1h; then the acidic product was washed up to neutral pH,<br />
dispersed in water by Waring-blender, and spray-dried. Mercerization <strong>of</strong> the initial celluloses<br />
was carried out by treatment with 20% NaOH at ratio 1:20, room temperature for 24 h with the<br />
following washing and drying at 105 o C up to constant weight.<br />
X-ray Diffraction<br />
Supermolecular structure (Krässig 1993) <strong>of</strong> the cellulose samples was tested by improved X-ray<br />
diffraction (Ioelovich 1992). Rigaku-Ultima Plus diffractometer (CuK� – radiation, �=0.15418<br />
nm) was used for X-ray investigations. Diffractograms were recorded in the φ=2� angle range<br />
from 5 to 80°. After recording <strong>of</strong> the diffractograms, the background was separated, corrections<br />
for Lorentz factor, polarization, and intensity <strong>of</strong> primary beam were made, and X-ray patterns<br />
were normalized. Then, diffraction intensities from crystalline and non-crystalline regions were<br />
separated by computerized method (Vonk 1973). The procedures allowed calculation <strong>of</strong> degree<br />
<strong>of</strong> crystallinity (X) according to equation<br />
X = ∫ Jc dφ / ∫ Jo dφ (1)<br />
where Jc and Jo are corrected and normalized diffraction intensities for crystalline regions and<br />
sample respectively. The part <strong>of</strong> non-crystalline domains (Y) in cellulose sample was calculated<br />
as:<br />
Y = 1-X (2)<br />
Improved lateral size <strong>of</strong> crystallites (L) was determined by the modified method. The reflection<br />
(200) was isolated, its integral width (B) in radians was measured and corrections for<br />
instrumental factor (�i) and lattice’s distortion factor (�d) were introduced. The value <strong>of</strong> L was<br />
calculated according to equation:<br />
L = �/[(cos �o (B 2 - �i 2 ) 0.5 ) 2 – (2 �d sin �o ) 2 ] 0.5<br />
where �o – diffraction angle <strong>of</strong> the reflection (200).<br />
Optical microscopy<br />
Microphotographs <strong>of</strong> cellulose fibers were made by means <strong>of</strong> optical microscope “Axioplan” <strong>of</strong><br />
Zeiss Co.<br />
Deuterium Exchange<br />
Cellulose samples were treated with heavy water (D2O) at 25 °C and D2O – cellulose mass ratio<br />
10:1 for 5 h. Excess <strong>of</strong> heavy water was removed. The samples were dried in P2O5 – desiccator<br />
at 25 °C for 24 h, and then in a dryer at 105 °C up to constant weight. Amplitude <strong>of</strong> proton’s<br />
induction for non-deuterated (Io) and deuterated (I) cellulose samples was measured on a MNRrelaxometer<br />
operating at 42 MHz, with 2.5 �s interval <strong>of</strong> the �/2 – pulse (Ioelovich and Gorgeev<br />
1994). Accessibility <strong>of</strong> cellulose samples at deuteration was calculated by equation:<br />
106<br />
(3)
COST Action E54 Book<br />
A = [1 – (I/Io)]/0.3 (4)<br />
Vapor sorption<br />
Sorption <strong>of</strong> water vapor by cellulose samples was measured at 25 °C and relative vapor pressure<br />
p/po from 0 to 0.9 using a vacuum Mac-Ben apparatus having helical spring quartz scales.<br />
Wetting enthalpy<br />
Enthalpy <strong>of</strong> cellulose wetting with water (ΔH) was studied by method <strong>of</strong> isothermal microcalorimetry<br />
at 25 °C using calorimeter TAM III (Wadső and Goldberg 2001).<br />
Specific volume<br />
Specific weight (Vsp.) <strong>of</strong> the dry sample was tested by pycnometry method in hexane medium<br />
(Kalinowski and Urbanczyk 1966)<br />
Chemical composition<br />
Analysis <strong>of</strong> chemical composition <strong>of</strong> the pulp was carried out according to standard procedures<br />
(Fengel and Wegener 1984; Obolenskaya et al. 1991).<br />
LODP<br />
Level-<strong>of</strong>f DP (Laka et al. 2000) was obtained from testing <strong>of</strong> characteristic viscosity <strong>of</strong> diluted<br />
solutions <strong>of</strong> the cellulose samples in Cadoxen after hydrolysis <strong>of</strong> the samples with 2.5N<br />
hydrochloric acid for 1h (Ioelovich and Leykin 2006). Then, an average length <strong>of</strong> crystallites<br />
was calculated:<br />
l = lo LODP (5)<br />
where lo =0.517 nm is length <strong>of</strong> glucopyranose link <strong>of</strong> cellulose.<br />
Reactivity<br />
The reactivity <strong>of</strong> cellulose was investigated by treatment with boiling 2.5N hydrochloric acid for<br />
1h and alkalization with solutions <strong>of</strong> sodium hydroxide at room temperature for 24 h (Ioelovich<br />
et al. 1999; 2010).<br />
Results and Discussion<br />
As can be seen from the microphotography, fibers <strong>of</strong> the bleached Kraft pulp are straight and<br />
flat, while fibers <strong>of</strong> the cotton cellulose have the appearance <strong>of</strong> twisted bands (Figure 1 and 2).<br />
Analysis <strong>of</strong> the chemical composition showed that bleached Kraft pulp contains 91.8% αcellulose<br />
and about 14% hemicelluloses. In contrast to the pulp, the cotton cellulose almost did<br />
not contain hemicelluloses, while the amount <strong>of</strong> α-cellulose reached 98.5% (Table 1).<br />
107
COST Action E54 Book<br />
Figure 1. Microphotograph <strong>of</strong> the Kraft pulp fibers Figure 2. Microphotograph <strong>of</strong> twisted middle-<br />
length cotton cellulose fibers<br />
Scale bars 100 µm<br />
Table 1. Chemical composition <strong>of</strong> cellulose fibers<br />
Characteristics Kraft pulp Cotton cellulose<br />
α-Cellulose, % 91.8 98.5<br />
Hemicelluloses, % 14.3*
COST Action E54 Book<br />
X-ray diffractograms <strong>of</strong> the initial cellulose samples are typical for C1β – crystalline polymorph<br />
(Figure 5 and 6). After acid treatment crystallinity and sizes <strong>of</strong> crystallites increased and<br />
therefore the samples <strong>of</strong> MCC acquired well resolved peaks related to C1β polymorph (Figure 7,<br />
Table 2). X-ray diffractograms <strong>of</strong> mercerized celluloses are related to CIIβ polymorph; they have<br />
less resolved peaks due to decreased crystallinity and sizes <strong>of</strong> crystallites (Figure 8 and Table 2).<br />
Figure 5. X-ray diffractogram <strong>of</strong> the bleached Kraft<br />
pulp<br />
Figure 7. X-ray diffractogram <strong>of</strong> cotton MCC<br />
109<br />
Figure 6. X-ray diffractogram <strong>of</strong> the cotton cellulose<br />
2 Theta
COST Action E54 Book<br />
Figure 8. X-ray diffractogram <strong>of</strong> mercerized cotton cellulose<br />
Values <strong>of</strong> lateral size (L) and length (l) <strong>of</strong> crystallites, crystallinity degree (X) and part <strong>of</strong> noncrystalline<br />
domains (Y) in cellulose samples are shown in Table 2. Cotton cellulose had a more<br />
ordered crystalline structure than the bleached Kraft pulp. Treatment with boiling acid lead to<br />
partial hydrolysis <strong>of</strong> non-crystalline domains, and lateral co-crystallization <strong>of</strong> crystallites gave an<br />
increased crystallinity and lateral size <strong>of</strong> crystallites. Mercerization <strong>of</strong> the initial cellulose<br />
samples caused transformation <strong>of</strong> C1 to CII crystalline polymorph – CP (O’Sullivan 1997) that<br />
was accompanied by decreased crystallinity, lateral size and length <strong>of</strong> crystallites.<br />
Table 2. Characteristics <strong>of</strong> crystalline structure <strong>of</strong> cellulose samples*<br />
Sample CP X Y L, nm l, nm<br />
IP C1β 0.63 0.37 6.7 78<br />
PMCC C1β 0.73 0.27 8.0 78<br />
MP CIIβ 0.53 0.47 5.4 40<br />
IC C1β 0.70 0.30 7.5 110<br />
CMCC C1β 0.78 0.22 11.0 110<br />
MC CIIβ 0.55 0.45 6.0 45<br />
*Note: IP - initial pulp; IC - initial cotton cellulose; PMCC – MCC prepared from pulp; CMCC – MCC prepared<br />
from cotton cellulose; MP – mercerized pulp; MC – mercerized cotton cellulose.<br />
Some physical and physico-chemical properties <strong>of</strong> the samples were studied (Table 3). As<br />
follows from the results, specific volume (Vsp.) was higher for the samples having increased<br />
content <strong>of</strong> non-crystalline domains (Y). Hydrophilic properties <strong>of</strong> the samples, e.g. wetting<br />
enthalpy (ΔH) and sorption <strong>of</strong> water vapor (S) at p/po = 0.6, decreased after treatment with<br />
boiling acid, but increased after mercerization. Accessibility at deuteration (A) was more than<br />
content <strong>of</strong> non-crystalline domains; this indicates that also paracrystalline surface layers <strong>of</strong><br />
crystallites are accessible to deuterium exchange:<br />
A=Y + α X (6)<br />
where α – accessibility degree <strong>of</strong> paracrystalline surface layers <strong>of</strong> crystallites.<br />
110
Table 3. Properties <strong>of</strong> cellulose samples<br />
COST Action E54 Book<br />
Sample Y Vsp., cm 3 /g -ΔH, kJ/kg S, % A<br />
IP 0.37 0.645 63 7.9 0.46<br />
PMCC 0.27 0.635 46 5.7 0.38<br />
MP 0.47 0.651 80 10.0 0.55<br />
IC 0.30 0.638 51 6.4 0.40<br />
CMCC 0.22 0.630 37 4.7 0.34<br />
MC 0.45 0.649 77 9.7 0.53<br />
Isotherms <strong>of</strong> water vapor sorption by cellulose samples have a sigma-shaped form that can be<br />
described by the following equation:<br />
S = SoY/[1-k log (p/po)] (7)<br />
where So = 50 % and coefficient k = 6.<br />
As seen from equation 7, increasing content <strong>of</strong> non-crystalline domains (Y) in the sample leads<br />
to rise <strong>of</strong> the sorption value. This is confirmed with experimental isotherms (Figure 9).<br />
S, %<br />
20<br />
15<br />
10<br />
5<br />
0<br />
0 0.2 0.4 0.6 0.8 1<br />
p/po<br />
Figure 9. Isotherms <strong>of</strong> water vapor sorption at 25 °C for samples <strong>of</strong> PMCC (1), IP (2) and MP (3). Points<br />
calculated by Equation 7<br />
Some physical and physico-chemical properties (Z) correlate with part <strong>of</strong> non-crystalline<br />
domains (Y) in cellulose samples. This correlation can be described by means <strong>of</strong> the linear<br />
regression equation:<br />
Z = n Y + C (8)<br />
Coefficients <strong>of</strong> the regression - n and C, are shown in Table 4.<br />
The Equation 8 makes it possible to predict various properties <strong>of</strong> the cellulose sample based on<br />
its Y-value or crystallinity.<br />
111<br />
3<br />
2<br />
1
COST Action E54 Book<br />
Table 4. Coefficients <strong>of</strong> the linear regression as in Equation 8<br />
Property: Z n C R*<br />
Sp. volume, Vsp, cm 3 /g 0.074 0.615 0.98<br />
Wetting enthalpy, ΔH, kJ/kg -170 0 0.95<br />
Sorption <strong>of</strong> water vapor S, % at p/po = 0.6 21.45 0 0.96<br />
Accessibility at deuteration, A 0.85 0.15 0.93<br />
Solubility at acid hydrolysis, P,% 65 -10 0.90<br />
*Note: R – correlation coefficient<br />
Conclusions<br />
The bleached Kraft pulp is characterized by an increased α-cellulose content that is close to<br />
92%. The presence hemicelluloses in the pulp sample can promote fibrillation and forming<br />
strong interfiber contacts in the papermaking process. Cotton cellulose has a very high purity<br />
degree: the content <strong>of</strong> α-Cellulose was 98.5% and almost zero hemicelluloses content. Increased<br />
content <strong>of</strong> α-cellulose and high brightness make these cellulose materials useful for papermaking<br />
and production <strong>of</strong> modified celluloses such as microcrystalline cellulose, mercerized cellulose,<br />
etc. The lower ordered pulp has higher reactivity at acid treatment and alkalization than the more<br />
ordered cotton cellulose. Treatment with boiling acid to obtain MCC leads to increased<br />
crystallinity and lateral size <strong>of</strong> crystallites, while mercerization <strong>of</strong> the initial cellulose samples<br />
caused formation <strong>of</strong> CII crystalline polymorph, decrease in crystallinity, lateral size and length<br />
<strong>of</strong> crystallites.<br />
The studied physical and physico-chemical properties <strong>of</strong> the samples, e.g. specific volume,<br />
accessibility at deuteration, wetting enthalpy and sorption <strong>of</strong> water vapor, correlate with part <strong>of</strong><br />
non-crystalline domains and crystallinity. This permits forecast <strong>of</strong> some important properties <strong>of</strong><br />
the cellulose on the base <strong>of</strong> its crystallinity degree. And vice versa, when testing properties <strong>of</strong> the<br />
samples, such as sorption <strong>of</strong> water vapor at certain relative pressure or relative humidity, the<br />
crystallinity and part <strong>of</strong> non-crystalline domains in the cellulose can be determined.<br />
References<br />
Fengel D. and Wegener G. (1984): Wood: Chemistry, Ultrastructure, Reactions. Berlin, New York: W. de<br />
Gruyter Inc.<br />
Heinemann S. and Ander P. (2011): Standard pulp and paper tests. In COST Action E54<br />
“Characterisation <strong>of</strong> the fine structure and properties <strong>of</strong> papermaking fibres using new technologies”.<br />
Eds: Ander P., Bauer W., Heinemann S., Kallio P., Passas R. and Treimanis A. Swedish University <strong>of</strong><br />
Agricultural Sciences. p. 211-232. ISBN 978-91-576-9007-4<br />
Ioelovich M. (1992): Supermolecular structure <strong>of</strong> native and isolated celluloses. Acta Polymerica. 43:<br />
110-113<br />
Ioelovich M. and Gordeev M. (1994): Crystallinity <strong>of</strong> cellulose and its accessibility during deuteration.<br />
Acta Polymerica 45: 121-123<br />
Ioelovich M. and Larina E. (1999): Parameters <strong>of</strong> Crystalline <strong>Structure</strong> and their influence on the<br />
Reactivity <strong>of</strong> Cellulose 1. Cell. Chem. Technol. 33: 3-12<br />
Ioelovich M. and Leykin A. (2006): Microcrystalline Cellulose: Nano-<strong>Structure</strong> Formation. Cell. Chem.<br />
Technol. 40 (5), 313-317<br />
112
COST Action E54 Book<br />
Ioelovich M., Leykin A. and Figovsky O. (2010): Study <strong>of</strong> cellulose paracrystallinity. BioResources 5(3):<br />
1393-1407<br />
Kalinowski J. and Urbanczyk G. W. (1966): Synthetic Fibers: Analysis and Properties. Moscow: Light<br />
Ind.<br />
Krässig H. (1993): Cellulose: <strong>Structure</strong>, Accessibility and Reactivity, Polymer Monographs, Vol. 11. M.<br />
B. Huglin (ed.), Amsterdam: Gordon and Breach Publ.<br />
Laka M., Chernyavslaya S., Treimanis A. and Faitelson L. (2000): Preparation and properties <strong>of</strong><br />
microcrystalline cellulose gels. Cellul. Chem. Technol. 34: 217-227<br />
Obolenskaya A. V., Elnitzkaya Z.P. and Leonowich A.A. (1991): Practical Works in Wood and Cellulose<br />
Chemistry. Moscow: Ecology.<br />
O’Sullivan A.C. (1997): Cellulose: the structure slowly unravels. Cellulose 4: 173-207<br />
Vonk C. G. (1973): Computerization <strong>of</strong> Ruland s X-ray method for determination <strong>of</strong> the crystallinity in<br />
polymers. J. Appl. Crystallography 6: 148-152<br />
Wadső I. and Goldberg R. (2001): Standards in isothermal microcalorimetry. Pure Appl. Chem. 73(10):<br />
1625-1639<br />
113
COST Action E54 Book<br />
114
Abstract<br />
COST Action E54 Book<br />
A METHOD CAPABLE TO DETERMINE DAMAGE OF THE<br />
OUTER FIBER WALL LAYERS<br />
Rene Eckhart, Ulrich Hirn, Wolfgang Bauer<br />
Institute for Paper, Pulp and Fiber Technology, Graz University <strong>of</strong> Technology<br />
Kopernikusgasse 24/II, 8010 Graz, Austria<br />
rene.eckhart@tugraz.at<br />
Cupri(II)ethylendiamine is normally used to dissolve chemical pulp fibers. If used in a defined<br />
concentration and for restricted reaction time it provokes heavy fiber swelling. In areas where<br />
the outer layers <strong>of</strong> the fiber are too weak due to mechanical or chemical damage, they can no<br />
longer restrict this swelling process - they break and characteristic swelling reactions can be<br />
observed under the microscope.<br />
Images <strong>of</strong> the swollen fibers were acquired and digital image analysis was used for evaluation <strong>of</strong><br />
the swelling intensity. For each individual fiber a so called “degree <strong>of</strong> swelling”, representing the<br />
swollen proportion <strong>of</strong> total fiber length, was evaluated. This degree <strong>of</strong> swelling corresponds to<br />
the damage <strong>of</strong> the outer fiber wall layers. The applicability <strong>of</strong> the method will be discussed using<br />
several results in different fields <strong>of</strong> interest.<br />
Introduction<br />
This paper presents a novel method capable <strong>of</strong> delivering information regarding the condition <strong>of</strong><br />
the outer fiber wall layers <strong>of</strong> chemical pulp fibers.<br />
The cell wall is composed <strong>of</strong> two layers, the thin primary wall (P) and the thick secondary wall.<br />
The secondary wall is divided into the three sublayers S1, S2 and S3. The orientation <strong>of</strong> the<br />
micr<strong>of</strong>ibrils differs between these layers. The fibrils in P are aggregated in a rather stochastic<br />
way, the S1 layer has a crossed fibrillar structure and the fibrils within the S2 are highly aligned<br />
along the fiber axis. Therefore the S2 layer shows the highest swelling ability. As already<br />
mentioned our method is based on chemically induced swelling <strong>of</strong> chemical pulp fibers. In areas<br />
where the more complex structured S1 layer is weakened or damaged during the pulping or<br />
stock preparation process, it cannot restrict the chemically induced swelling <strong>of</strong> the S2 layer and<br />
characteristic swelling reactions can be observed (Figure 1). The quantity <strong>of</strong> such swelling<br />
reactions reflects the condition <strong>of</strong> the outer fiber wall layers. Several methods described in the<br />
literature are based on this principle.<br />
Nisser and Brecht (1963) used cupri(II)ethylenediamine to assess fiber wall damage. Hortling et<br />
al. (2000) used iron-sodium-tartrate (EWNN) and Unger et al. (1995) quantitatively evaluated<br />
swelling and dissolving <strong>of</strong> pulp fibers in EWNN and LiCl/DiMAc (lithiumchloride/<br />
dimethylacetamide). Ander and Daniel (2004) indicated that polarized light microscopy, electron<br />
microscopy and fiber swelling induced by chemicals indeed all indicate cracks in the S1 fiber<br />
wall.<br />
Experimental<br />
At our institute we adapted the method <strong>of</strong> Nisser and Brecht (1963) where<br />
cupri(II)ethylendiamine is used as the swelling chemical. Unlike other methods based on<br />
chemically induced swelling <strong>of</strong> pulp fibers that are mentioned in the literature, we did not<br />
115
COST Action E54 Book<br />
observe the swelling reaction itself under the microscope, by means <strong>of</strong> photographs or video,<br />
instead we evaluated the swelling intensity <strong>of</strong> fibers after controlled treatment with the swelling<br />
chemical.<br />
The comparison <strong>of</strong> pulp samples is restricted to similar samples in terms <strong>of</strong> raw material<br />
(hardwood/s<strong>of</strong>twood) and cooking process (kraft/sulphite). It is impossible to compare for<br />
example sulphite and kraft pulp samples on the basis <strong>of</strong> the same concentration <strong>of</strong> swelling<br />
chemical, as the condition <strong>of</strong> the outer fiber wall layers is different due to the different<br />
characteristics <strong>of</strong> the cooking liquor (Page 1983). Therefore sulphite fibers already start to<br />
dissolve when kraft fibers show the first swelling reactions.<br />
After treatment, the fibers show typical swelling reactions, their quantity depending on the<br />
condition <strong>of</strong> the S1-layer. Images <strong>of</strong> the treated fiber samples are taken by means <strong>of</strong> transmitted<br />
light microscopy in a prototype. The highly diluted (consistency 0.02 g/l) suspension is pumped<br />
through a transparent flow cell made <strong>of</strong> Plexi glass and CMOS-cameras acquire images in<br />
format jpg. For the evaluation <strong>of</strong> one pulp sample 1500 images are taken. These images contain<br />
on average 2500 objects with a minimum length <strong>of</strong> 250 µm.<br />
As an example, Figure 1 shows seven kraft pulp fibers. Five <strong>of</strong> the fibers show the typical<br />
swelling reactions, two <strong>of</strong> them were completely unswollen. Swelling type I, called volume<br />
swelling, occurs when the S1 layer is already cracked along parts <strong>of</strong> the fiber and these parts can<br />
easily swell during treatment. If the S1, especially <strong>of</strong> fiber fragments is missing completely and<br />
the swelling reaction is not restricted at all, the swelling reaction disintegrates the fiber very fast<br />
and swelling type II, so called gel swelling, appears. Swelling type III, called balloon swelling<br />
(see also Figure 2), appears when the S1 layer is still intact but weakened or slightly damaged.<br />
The S1 layer is cracked in weaker points due to the swelling forces <strong>of</strong> the S2 and forms<br />
constrictions between or aside the occurring balloons.<br />
1 mm<br />
Figure 1(left). Characteristic types <strong>of</strong> swelling: Volume<br />
swelling (I), gel swelling (II), balloon swelling (III)<br />
Figure 2 (above). Fiber with a degree <strong>of</strong> swelling <strong>of</strong><br />
36.4 %, which means that 36.4 % <strong>of</strong> total fiber length<br />
are rated as swollen by image analysis<br />
Image analysis algorithms developed at our institute by Hirn (2006) were used to determine the<br />
degree <strong>of</strong> swelling for each individual fiber. Figure 2 shows an example <strong>of</strong> a partly swollen fiber,<br />
with 36.4 % <strong>of</strong> the total fiber length rated as swollen, therefore 36.4 % <strong>of</strong> the fiber’s S1 wall is<br />
considered damaged. In addition, the degree <strong>of</strong> swelling, fiber length, fiber width, fiber curl and<br />
kink index are evaluated for each acquired fiber. A detailed description <strong>of</strong> the method can be<br />
found from the appendix.<br />
116
COST Action E54 Book<br />
The repeatability <strong>of</strong> the method was tested on the basis <strong>of</strong> three measurements on a s<strong>of</strong>twood<br />
kraft pulp sample. Sampling, treatment with the chemical, image acquisition and analysis were<br />
performed three times independently.<br />
Relative Frequency [%]<br />
50<br />
40<br />
30<br />
20<br />
10<br />
0<br />
0 - 20 20 - 40 40 - 60 60 - 80 80 - 100<br />
Degree <strong>of</strong> Fiber Swelling [%]<br />
Figure 3. Repeatability on the basis <strong>of</strong> three fiber swelling measurements. The error bars represent a<br />
95 % confidence interval for the specific class<br />
The average degree <strong>of</strong> swelling was 30.3 % (swollen fiber length), the standard deviation on the<br />
basis <strong>of</strong> the three measurements was 0.3 %. Figure 3 shows the repeatability <strong>of</strong> the method in<br />
form <strong>of</strong> 95 % confidence intervals for the frequency distribution <strong>of</strong> the degree <strong>of</strong> swelling over<br />
five classes. 46 % <strong>of</strong> the fibers show hardly any damage (0 % - 20 % swollen fiber length)<br />
whereas for 7 % <strong>of</strong> the fibers nearly the whole fiber length was identified as swollen by image<br />
analysis (80 % - 100 % swollen fiber length).<br />
Results<br />
In this section we will show the applicability <strong>of</strong> our newly developed method on the basis <strong>of</strong><br />
some results in different fields <strong>of</strong> interest.<br />
1 - Bleaching - Chemical Damage<br />
As fiber damage and degradation <strong>of</strong> cellulose molecules is always an issue along the fiber<br />
production line, we did some investigations on laboratory and industrial bleaching processes, to<br />
see if our method can indicate where the damage is done to the fiber in a number <strong>of</strong> bleaching<br />
stages.<br />
Laboratory<br />
As a first experiment and to evaluate if our method has the potential to indicate chemical damage<br />
as it occurs in a bleaching stage, a sulphite pulp sample with Kappa number 12 and brightness<br />
55% was bleached in our laboratory in one stage to a brightness <strong>of</strong> 85.7 %. We used a laboratory<br />
cooking vessel. The concentration <strong>of</strong> the bleaching chemicals and the bleaching parameters were<br />
as follows: 3 % NaOH, 5 % H2O2, O2 (at 8 kPa), 95 °C and 90 min.<br />
Figure 4 shows the result <strong>of</strong> the swelling analysis in form <strong>of</strong> the frequency distribution <strong>of</strong> the<br />
degree <strong>of</strong> swelling over five classes for the unbleached and the bleached pulp sample.<br />
117
frequency [%]<br />
45<br />
40<br />
35<br />
30<br />
25<br />
20<br />
15<br />
10<br />
5<br />
COST Action E54 Book<br />
0<br />
0 20 40 60 80 100 120<br />
class limit [%]<br />
laboratory bleached<br />
unbleached<br />
Figure 4. Fiber frequency distribution <strong>of</strong> the degree <strong>of</strong> swelling over five classes (0-20, 20-40, 40-60, 60-<br />
80 and 80-100% swollen fiber length) for unbleached and laboratory bleached pulp samples<br />
The graph for the bleached pulp sample shows more objects in the classes <strong>of</strong> high degrees <strong>of</strong><br />
swelling. The bleaching process leads to a higher proportion <strong>of</strong> swollen fiber length. Therefore<br />
the method is considered capable to indicate chemical damage as it occurred in the laboratory<br />
bleaching process under the described parameters.<br />
Industrial scale<br />
In cooperation with our industrial partners, we investigated 5 industrial bleaching sequences, 3<br />
<strong>of</strong> them sulphite, 2 <strong>of</strong> them kraft producers to evaluate the method in an industrial application.<br />
Figure 5 shows an exemplary result for one <strong>of</strong> the sulphite producing fiber lines in form <strong>of</strong> the<br />
frequency distributions <strong>of</strong> the degree <strong>of</strong> swelling for samples from the consecutive bleaching<br />
stages. As is evident in this diagram, there are only very small differences between the frequency<br />
distributions <strong>of</strong> the samples. It seems that no significant damage is done to the S1 layer in the<br />
industrial bleaching process. In fact, if we take a closer look on the classes 0-20% and 80-100%<br />
swollen fiber length in Figure 5, it seems that we have a decrease in damage. The unbleached<br />
sample shows the highest proportion in the class <strong>of</strong> high damage and the lowest in the class <strong>of</strong><br />
the undamaged fibers whereas we see the exact opposite for the sample after the last bleaching<br />
stage.<br />
frequency [%]<br />
70<br />
60<br />
50<br />
40<br />
30<br />
20<br />
10<br />
0<br />
0 20 40 60 80 100 120<br />
class limit [%]<br />
unbleached<br />
stage 1<br />
stage 2<br />
stage 3<br />
Figure 5. Frequency distribution <strong>of</strong> the degree <strong>of</strong> swelling for samples from consecutive bleaching stages<br />
118
COST Action E54 Book<br />
Considering the development <strong>of</strong> the average degree <strong>of</strong> swelling over the bleaching sequences,<br />
we can see this decrease in swelling reaction for all five investigated fiber lines (Figure 6). This<br />
decrease cannot be based on some kind <strong>of</strong> fiber “healing” during bleaching. We interpret it as a<br />
result <strong>of</strong> the changing amount <strong>of</strong> negatively charged groups within the fiber during the bleaching<br />
process. As the swelling chemical is a positively charged ion, the negatively charged groups<br />
within the fiber support the intrusion <strong>of</strong> its molecules and therefore might accelerate the swelling<br />
process. Due to the reduction <strong>of</strong> the Kappa number the amount <strong>of</strong> acidic groups within the fiber<br />
decreases. The result is a slight decrease <strong>of</strong> swelling reactions over the bleaching sequence.<br />
Maybe this effect superposes eventual detectable damage done to the S1 layer.<br />
swollen fiber length [%]<br />
55<br />
50<br />
45<br />
40<br />
35<br />
30<br />
25<br />
20<br />
15<br />
unbleached<br />
Average Degree <strong>of</strong> Swelling<br />
stage 1<br />
stage 2<br />
stage 3<br />
sulphite 1<br />
sulphite 2<br />
sulphite 3<br />
Figure 6. Average degree <strong>of</strong> swelling <strong>of</strong> the pulp samples taken after the consecutive bleaching stages<br />
Summary 1<br />
The laboratory experiment shows that the method can detect chemical damage <strong>of</strong> the S1 layer as<br />
it occurs during the bleaching process. Still, the method is unsuited for the evaluation <strong>of</strong><br />
industrial bleaching sequences, as it cannot describe the fiber damage and the degradation <strong>of</strong><br />
cellulose molecules in state <strong>of</strong> the art fiber lines. Furthermore changes in the chemical<br />
composition <strong>of</strong> the fiber wall during bleaching seem to influence the swelling behavior besides<br />
the damage <strong>of</strong> the S1 layer and therefore might lead to misinterpretation <strong>of</strong> results.<br />
2 - Refining - Mechanical Damage<br />
Investigations were done in laboratory scale (Jokro-mill, PFI-mill, pilot-disc refiner) as well as<br />
on industrial aggregates and refining processes.<br />
If we look at the refining process, damage <strong>of</strong> the S1 layer occurs due to friction on the fiber<br />
surface. It may be torn open or even detached due to mechanical stresses. Besides fibrillation,<br />
flexibilization and shortening play a major role in the refining process. Flexibilization is not<br />
accessible in our method but shortening can be determined on the basis <strong>of</strong> fiber length<br />
development. Therefore the combination <strong>of</strong> the data on the swelling behavior with data on fiber<br />
length <strong>of</strong> each acquired fiber should allow an extended characterization <strong>of</strong> refining processes. A<br />
s<strong>of</strong>twood kraft pulp sample was refined to an identical breaking length <strong>of</strong> 7 km with three<br />
different laboratory aggregates to determine differences concerning the treatment <strong>of</strong> the pulp.<br />
The investigated aggregates were the Jokro-mill, the PFI-mill and a pilot scale disc refiner. The<br />
degree <strong>of</strong> beating for the two laboratory mill-treated samples was similar at 15.5 SR for the<br />
Jokro-mill and 16 SR for the PFI-mill. The disc refined sample had a SR value <strong>of</strong> 35.<br />
119<br />
kraft 1<br />
kraft 2
COST Action E54 Book<br />
Figure 7 shows the contour plot <strong>of</strong> the degree <strong>of</strong> swelling versus fiber length. The twodimensional<br />
frequency distribution <strong>of</strong> fibers is visualized by gray value. Bright areas represent<br />
numerous fibers, dark ones represent only few or no fibers at all. Damage <strong>of</strong> the fiber wall is<br />
indicated by a shift <strong>of</strong> the high fiber concentrations to the classes <strong>of</strong> high degrees <strong>of</strong> swelling,<br />
whereas a shift to the left, to shorter length classes corresponds to shortening.<br />
Only little difference can be observed between the plots corresponding to the Jokro and the PFI<br />
mill. Comparing the plot corresponding to the disc refiner with those <strong>of</strong> the two laboratory mills,<br />
a high fiber concentration in the region <strong>of</strong> high degrees <strong>of</strong> swelling is evident. Another high fiber<br />
concentration is still observable at low degrees <strong>of</strong> swelling. Fewer fibers are situated in between.<br />
This shows a rather inhomogeneous treatment in the disc refiner. Those fibers that are reached in<br />
the refining zone are mostly heavily damaged, whereas others are not reached and receive no<br />
damage at all. Furthermore a shift <strong>of</strong> the high fiber concentrations to the left – to shorter fiber<br />
classes – can be observed due to increased shortening <strong>of</strong> fibers in the disc refiner.<br />
Jokro-mill PFI-mill disc refiner<br />
Figure 7. Contour plots <strong>of</strong> the degree <strong>of</strong> swelling versus fiber length<br />
shortening<br />
If we look at the same results visualized as frequency distributions <strong>of</strong> the degree <strong>of</strong> swelling<br />
(Figure 8), a difference between the Jokro- and the PFI-mill becomes obvious. Although it can<br />
be assumed that all fibers pass the refining zone several times in such laboratory mills, a<br />
considerable amount <strong>of</strong> fibers shows rather no damage <strong>of</strong> the fiber wall. The laboratory mills<br />
develop breaking length more through flexibilization than through fibrillation, shortening or<br />
production <strong>of</strong> fines.<br />
Relative Frequency [%]<br />
60<br />
50<br />
40<br />
30<br />
20<br />
10<br />
0<br />
0 - 20 20 - 40 40 - 60 60 - 80 80 - 100<br />
Degree <strong>of</strong> Fiber Swelling [%]<br />
Figure 8. Frequency distributions <strong>of</strong> the degree <strong>of</strong> swelling<br />
120<br />
Jokro-mill<br />
PFI-mill<br />
discrefiner<br />
damage damage damage
elative frequency [%]<br />
relative frequency [%]<br />
40<br />
30<br />
20<br />
10<br />
0<br />
40<br />
30<br />
20<br />
10<br />
0<br />
84 kWh/t<br />
0 - 20 20 - 40 40 - 60 60 - 80 80 - 100<br />
degree <strong>of</strong> swelling [%]<br />
120 kWh/t<br />
COST Action E54 Book<br />
double cone refiner<br />
double disc refiner<br />
cylindrical refiner<br />
0 - 20 20 - 40 40 - 60 60 - 80 80 - 100<br />
degree <strong>of</strong> swelling [%]<br />
double cone refiner<br />
double disc refiner<br />
cylindrical refiner<br />
Figure 9. Frequency distributions <strong>of</strong> the degree <strong>of</strong> swelling<br />
relative frequency [%]<br />
relative frequency [%]<br />
40<br />
30<br />
20<br />
10<br />
0<br />
40<br />
30<br />
20<br />
10<br />
0<br />
105 kWh/t<br />
0 - 20 20 - 40 40 - 60 60 - 80 80 - 100<br />
degree <strong>of</strong> swelling [%]<br />
139 kWh/t<br />
double cone refiner<br />
double disc refiner<br />
cylindrical refiner<br />
0 - 20 20 - 40 40 - 60 60 - 80 80 - 100<br />
degree <strong>of</strong> swelling [%]<br />
double cone refiner<br />
double disc refiner<br />
cylindrical refiner<br />
Still, the PFI-mill treated pulp sample shows less fibers in the class <strong>of</strong> undamaged fibers<br />
(0 - 20 % swollen fiber length) than the Jokro-mill. That is due to higher friction between rotor<br />
and housing in the PFI-mill and therefore a more fibrillating effect. In the Jokro-mill, where the<br />
rotor rolls more or less in the housing, breaking length descends to an even higher extent from<br />
fiber flexibilization. It is developed smoother and more time consuming. Therefore less damage<br />
is imposed on the fiber wall.<br />
As damage data is available on every single fiber the method is potentially capable <strong>of</strong> giving<br />
information on the homogeneity <strong>of</strong> the treatment in a refining process. As an example, Figure 9<br />
shows the fiber damage distributions <strong>of</strong> a s<strong>of</strong>twood kraft pulp sample, refined with three<br />
different industrial aggregates at four points <strong>of</strong> specific energy consumption. The aggregates<br />
were a double cone refiner, a double disc refiner and a cylindrical refiner. The parameters<br />
refining consistency and specific edge load were identical for these trials.<br />
The mean calculated damage <strong>of</strong> the fibers was similar for the double cone and the double disc<br />
refiner at all four points <strong>of</strong> specific refining energy. The pulp sample refined with the cylindrical<br />
aggregate showed a slightly higher average degree <strong>of</strong> fiber swelling. As is shown in Figure 9, the<br />
sample refined in the cylindrical aggregate exhibits less objects in the class <strong>of</strong> rather undamaged<br />
fibers <strong>of</strong> 0 % - 20 % swollen fiber length in all four trials, whereas the distribution over the four<br />
remaining classes is quite similar to those <strong>of</strong> the other aggregates. This result indicates that the<br />
higher average fiber damage after treatment with the cylindrical aggregate is not due to higher<br />
damage <strong>of</strong> the fibers that have been treated in the refining zone, which would have resulted in<br />
more fibers especially in the classes <strong>of</strong> 60-80 and 80-100 % swollen fiber length, but due to a<br />
higher percentage <strong>of</strong> damaged fibers. Our conclusion is that in these specific trials, the<br />
121
COST Action E54 Book<br />
cylindrical refiner treated the pulp suspension in a more homogeneous way, as less fibers remain<br />
undamaged compared to the other industrial aggregates.<br />
Summary 2<br />
The measurements deliver additional information on the refining process that is not accessible<br />
through the degree <strong>of</strong> beating or breaking length. The method evaluates the refining process<br />
directly through single fiber measurement. Each fiber is assessed concerning its wall damage<br />
level. Therefore the method is capable to evaluate the homogeneity <strong>of</strong> fiber treatment. Refining<br />
and mechanical damage seems to be the field with the highest applicability <strong>of</strong> this method.<br />
3 - Comparison <strong>of</strong> Pulp Samples<br />
Another possible field <strong>of</strong> application we investigated is the comparison <strong>of</strong> different pulp samples<br />
concerning the fiber damage level and the beatability <strong>of</strong> these samples. The beatability should be<br />
highly correlated to the condition <strong>of</strong> the fiber wall: weaker fiber wall layers result in a higher<br />
degree <strong>of</strong> swelling; weaker fiber wall layers also cause lower refining resistance; a higher degree<br />
<strong>of</strong> swelling is expected to indicate lower refining resistance. As already mentioned, a<br />
comparison with our method is reasonable only in a range <strong>of</strong> similar pulp samples concerning<br />
raw material (hardwood - s<strong>of</strong>twood) and cooking process (sulphite-kraft) as the concentration <strong>of</strong><br />
the swelling chemical has to be varied based on these properties, to receive meaningful results.<br />
Furthermore, as already mentioned earlier, the amount <strong>of</strong> negatively charged groups within the<br />
fiber, which correlates to Kappa number, might contribute to the result.<br />
Therefore six s<strong>of</strong>twood kraft pulp samples with similar brightness (between 85 and 90%) were<br />
compared concerning their swelling behavior. The arithmetic mean <strong>of</strong> the degree <strong>of</strong> swelling <strong>of</strong><br />
these pulp samples varied between 23 and 51 %. A difference <strong>of</strong> 28 % is comparable to the<br />
difference we get between an unbeaten sample and the same sample after 250kWh/t in an<br />
industrial refiner. This instance demonstrates the major difference due to origin <strong>of</strong> the pulp,<br />
cooking and bleaching parameters and kappa number even among similar pulp samples. As<br />
expected, a clear correlation was found between the average degree <strong>of</strong> swelling and the refining<br />
resistance (represented by the number <strong>of</strong> revolutions in the PFI-mill needed to reach a degree <strong>of</strong><br />
beating <strong>of</strong> 23 SR). Figure 10 shows the specific correlation.<br />
revolutions PFI-mill to<br />
reach 23SR<br />
refining resistency - degree <strong>of</strong> swelling<br />
7000<br />
6000<br />
5000<br />
4000<br />
3000<br />
2000<br />
1000<br />
0<br />
0 10 20 30 40 50 60<br />
average degree <strong>of</strong> swelling<br />
Figure 10. Correlation between degree <strong>of</strong> swelling and refining resistance<br />
122
COST Action E54 Book<br />
Summary 3<br />
As we expected, the degree <strong>of</strong> swelling <strong>of</strong> unrefined pulp samples, is an indicator for the<br />
damage-level <strong>of</strong> the S1 layer, and shows a good correlation to the refining resistance <strong>of</strong> the<br />
specific samples.<br />
Conclusions<br />
The described method is capable to determine the condition <strong>of</strong> the S1 layer. The highest<br />
applicability lies in the field <strong>of</strong> refining characterization. Combined with data on fiber length<br />
development, the method is capable to determine the character <strong>of</strong> a refining process concerning<br />
shortening and fibrillation. Furthermore, as data is available on a single fiber basis, the method<br />
can be used to investigate the homogeneity <strong>of</strong> the refining process. Comparison <strong>of</strong> different pulp<br />
samples is possible within equivalent cooking process type, raw material and similar bleaching<br />
level and delivers information concerning the refining resistance.<br />
Acknowledgement<br />
The authors gratefully acknowledge the funding by the FFG - Austrian Research Promotion<br />
Agency - under the program line “Research Studios Austria”.<br />
References<br />
Ander P. and Daniel G. (2004): Morphology <strong>of</strong> spruce fibre dislocations as studied by balloon swelling<br />
and acid cleavage - light and electrone microscope observations, In: U. Schmitt, P. Ander, J.R. Barnett,<br />
A.M.C. Emons, G. Jeronimidis, P. Saranpää, S. Tschegg, (Eds). COST Action E20, “Wood Fibre Cell<br />
Walls: Methods to Study Their Formation, <strong>Structure</strong> and Properties”. Swedish University <strong>of</strong> Agricultural<br />
Sciences, Uppsala, Sweden. ISBN 91-576-6803-5, pp. 203-215<br />
Hirn U. (2006): New Methods in Paper Physics Based on Image Analysis, PhD Thesis, Graz University<br />
<strong>of</strong> Technology, Austria<br />
Hortling B., Jousimaa T. and Hyvärinen H.-K. (2000): Investigation <strong>of</strong> spruce pulp fibres by swelling<br />
experiments and light microscopy, in Proc. 10th Int. Conf. CELLUCON 1998, Woodhead Publishing<br />
Ltd., pp. 205–208<br />
Nisser H. and Brecht W. (1963): Zwei neue Messkriterien von aufgeschwemmten Fasern zur Beurteilung<br />
der Blattfestigkeit. Svensk Papperstidning 66(2), 37–41<br />
Page D.H. (1983): The origin <strong>of</strong> the differences between sulphite and kraft pulps. J. Pulp Paper Sci.<br />
March 1983, TR15-TR20<br />
Unger E., Fink H. and Philipp B. (1995): Morphometrische Untersuchungen des Quell- und<br />
Lösevorgangs von Cellulosefasern in EWNN und LiCl/Dimethylacetamid. Das Papier 49(6), 297–307<br />
123
Appendix<br />
COST Action E54 Book<br />
Swelling procedure and analysis<br />
A beaker is filled with 20 g <strong>of</strong> suspension (consistency 1 g/l) and put on a magnetic stirrer. The<br />
swelling reaction is started by adding the swelling chemical to the suspension.<br />
We use commercially available cupri(II)ethylendiamine solution which has to be diluted before<br />
use in the swelling reaction as the pure solution would lead to almost immediate dissolution <strong>of</strong><br />
the fibers. The final concentration <strong>of</strong> cupri(II)ethylendiamine in the suspension is chosen<br />
depending on the pulp sample to be evaluated (sulphite/kraft, hardwood/s<strong>of</strong>twood).<br />
As an example, for a s<strong>of</strong>twood kraft pulp sample the concentration <strong>of</strong> the chemical in the<br />
suspension after addition to the solution has to be 16 % whereas 14 % is convenient for a<br />
s<strong>of</strong>twood sulphite pulp sample. The amount <strong>of</strong> dilution water added to the chemical is calculated<br />
on the basis <strong>of</strong> the chosen final concentration, the amount <strong>of</strong> fiber suspension (~20 g) and the<br />
amount <strong>of</strong> pure cupri(II)ethylendiamine solution (~ 7 g). The reaction is stopped 20 sec after<br />
addition <strong>of</strong> the diluted swelling chemical, by dilution with deionized water up to an ineffective<br />
concentration <strong>of</strong> about 1.5 %.<br />
Images <strong>of</strong> the treated fiber samples are taken. The optical resolution is 6.25 µm/Pixel at an<br />
image size <strong>of</strong> 6.25 x 14.5 mm. Swelling detection is based on following four criteria given<br />
below. The image analysis decides for each criterion if the specific fiber section is swollen, not<br />
swollen or not determinable (see also Figure 1).<br />
Swelling criteria<br />
1. The absolute width, since the width <strong>of</strong> swollen fibers is significantly higher than those <strong>of</strong><br />
unswollen ones.<br />
2. The width-gradient over the length <strong>of</strong> the fiber.<br />
3. Luminance pr<strong>of</strong>ile perpendicular to the fiber centerline<br />
4. The gradient <strong>of</strong> the luminance pr<strong>of</strong>ile over the length <strong>of</strong> the fiber.<br />
As a result, every evaluated fiber is assigned a degree <strong>of</strong> swelling in %.<br />
124
COST Action E54 Book<br />
SOLID STATE NMR CHARACTERISATION OF CELLULOSE ACETATE<br />
AND LIME WOOD CELLULOSE<br />
1 Carmen-Mihaela Popescu, 2 Per Tomas Larsson<br />
1 Romanian Academy “P.Poni” Institute <strong>of</strong> Macromolecular Chemistry, 41A Gr. Ghica Voda<br />
Alley, Ro.700487, IASI, Romania<br />
Abstract<br />
2 Innventia AB, Box 5604, SE-114 86 Stockholm, Sweden<br />
E-mail: mihapop@icmpp.ro<br />
This Short Term Scientific Mission (STSM) work performed on the solid state NMR equipment<br />
at Innventia AB consisted <strong>of</strong> determining if and to what extent the fiber fine structure influence<br />
the chemical reactivity when cellulose acetate is made from wood fibers. Cellulose acetate is an<br />
important commercial product, made from renewable resources at numerous sites around the<br />
world, a possible replacement for oil based plastic materials. The changes induced by two<br />
important s<strong>of</strong>t-rot fungi Trichoderma viride Pers. and Chaetomium globosum on lime wood cell<br />
wall were also studied by solid state CP/MAS 13 C NMR spectroscopy.<br />
Introduction<br />
Solid state CP/MAS 13 C NMR spectroscopy is a versatile tool for morphology studies <strong>of</strong><br />
cellulosic materials. The resolution <strong>of</strong> CP/MAS 13 C NMR spectra is adequate enough to allow<br />
chemically equivalent carbons from different magnetic environments to be separated. Cellulose<br />
fibers exhibit specific properties that focused the interest toward their use as reinforcing fillers in<br />
polymeric composites (Czarnecki et al. 1980, Hermann et al. 1998, Glasser et al. 1999).<br />
The acetylation <strong>of</strong> cellulose is a typical heterogeneous reaction. On one hand it depends on the<br />
accessibility <strong>of</strong> cellulose elements within the starting cellulosic fibers and on the other hand on<br />
the susceptibility <strong>of</strong> individual cellulose crystallites towards acetylation. The rate and perfection<br />
<strong>of</strong> acetylation is therefore greatly influenced by macro and micro morphology <strong>of</strong> initial cellulose<br />
fibrils (Sassi et al. 1995). Heterogenous acetylation is one suitable way to reduce high polarity,<br />
to modify surface properties, to increase the hydrophobic character, and also to control the<br />
enzymatic degradation <strong>of</strong> cellulose fibers.<br />
Wood as a biodegradable natural material (Eriksson et al. 1990) is permanently exposed to<br />
degradation processes <strong>of</strong> environmental, chemical (You et al. 2010) or microbial nature. The<br />
extent <strong>of</strong> deterioration depends on the environmental conditions in which the wood is usually<br />
found. Even if wood is considered a durable material there are a number <strong>of</strong> biological factors<br />
that contribute significantly to the degradation <strong>of</strong> wood. The aim <strong>of</strong> the STSM project “Cellulose<br />
and wood characterisation by CP/MAS 13 C NMR spectroscopy” was to obtain information about<br />
the supra-molecular structure in order to establish differences which appear after acetylation and<br />
after biodegradation by microorganisms. This kind <strong>of</strong> analysis allowed us to detect small<br />
differences appearing after biodegradation <strong>of</strong> a lime wood species mainly used in art works. The<br />
meaning was to find correlations between the degree <strong>of</strong> structure deterioration and some spectral<br />
characteristics, in order to establish new methodology to assess the age <strong>of</strong> art works.<br />
125
Materials and methods<br />
COST Action E54 Book<br />
Three sets <strong>of</strong> samples were used: acetylated unbleached and bleached pulp samples, lime wood<br />
biodegraded by Chaetomium globosum and by Trichoderma viride.<br />
Unbleached and bleached kraft pulp fibers (Popescu et al. 2011) were wet-defibrated and airdried<br />
at room temperature several days and then oven-dried at 80 °C for 24h. 1.5 g <strong>of</strong> each<br />
sample were suspended in a mixture <strong>of</strong> 7.5 mL acetic anhydride and 0.015 mL sulphuric acid as<br />
a catalyst and vigorously stirred. Acetylation was performed at 30 °C for different reaction<br />
times: 1, 3, 5 and 24 h. After the desired reaction time, each sample was separated by filtration,<br />
and washed several times with distilled water and air-dried at room temperature.<br />
The wood samples used were lime wood (Tilia cordata Mill). Exposure time for Chaetomium<br />
globosum was 0, 28 days, 56 days, 91 days and 133 days, and by Trichoderma viride 0, 56 days,<br />
and 84 days.<br />
The method <strong>of</strong> investigation was Cross-Polarization Magic Angle Spinning Carbon-13 Nuclear<br />
Magnetic Resonance (CP/MAS 13 C-NMR) spectroscopy as described by Larsson et al. (1997;<br />
1999) and Wickholm et al. (1998).<br />
High-resolution solid state 13 C-NMR spectra were recorded at 7.04 T with cross-polarization<br />
/magic angle spinning (CP/MAS) in a Bruker Avance AQS 300 WB spectrometer. All powdered<br />
samples were packed uniformly in a zirconium oxide rotor. All measurements were performed at<br />
289 � 1 K. The MAS rate was 5 kHz. A double air-bearing probe was used. Acquisition was<br />
performed with a CP pulse sequence, using a 4.5 µs proton 90 o pulse, 800 µs ramped (100 –<br />
50%) falling contact pulse and a 2.5 s delay between repetitions. A TPPM15 pulse sequence was<br />
used for 1 H decoupling. Glycine was used for Hartman-Hahn matching procedure and as<br />
external standard for the calibration <strong>of</strong> chemical shift scale tetramethylsilane ((CH3)4Si) was<br />
used. The data point <strong>of</strong> maximum intensity in glycine carbonyl line was assigned a chemical<br />
shift <strong>of</strong> 176.03 ppm. Deconvolution <strong>of</strong> the spectra was done by means <strong>of</strong> Grams/32 program<br />
(Galactic Industry Corp.).<br />
Results and Discussion<br />
CP/MAS 13 C NMR spectroscopy for cellulose samples<br />
Natural cellulose fibers have a molecular architecture with a high degree <strong>of</strong> individuality,<br />
depending on their biological origin. Typical CP/MAS 13 C NMR spectra from cellulose I are<br />
made up <strong>of</strong> six signals from the anhydroglucose unit split into fine structure <strong>of</strong> the cellulose I<br />
fibril. The information in this fine structure is high, but the accessibility <strong>of</strong> the information is<br />
hampered by a severe overlap <strong>of</strong> the signals (Larsson et al. 1999). The spectra <strong>of</strong> unbleached and<br />
bleached pulp samples, non-acetylated and acetylated showed characteristic signals which are<br />
given in Table 1, the assignments being in accord with known literature (Larsson et al. 1997,<br />
1999; Wickholm et al. 1998).<br />
Signals at 171.4 and 20.6 ppm assigned to COO- and CH3, respectively, in acetyl groups<br />
demonstrate that acetylation took place in both unbleached and bleached pulp samples. For a<br />
better characterization <strong>of</strong> the cellulose non-acetylated and acetylated samples, normalization <strong>of</strong><br />
the C-4 signal from 88.7 ppm was done. This signal is assigned to C-43 carbons situated in<br />
crystalline cellulose Iα and Iβ domains together with paracrystalline cellulose and is considered<br />
less influenced by the acetylation medium. After normalization the following differences in the<br />
spectra <strong>of</strong> non-acetylated and acetylated unbleached pulp samples were observed.<br />
126
COST Action E54 Book<br />
Table 1. Resonance assignment <strong>of</strong> CP/MAS 13 C NMR spectrum <strong>of</strong> acetylated pulp samples<br />
Chemical shift<br />
(ppm)<br />
Assignments<br />
171.4 COO- in acetyl groups<br />
104.8 C-1 in cellulose Iα, Iβ and less-ordered cellulose<br />
101.4 C-1 in cellulose acetate<br />
88.7 C-4 in crystalline cellulose Iα, Iβ and paracrystalline cellulose<br />
83.7 C4 in amorphous cellulose or less ordered surface cellulose molecules<br />
74.8 C2,3,5 in cellulose and hemicelluloses<br />
72.1 C2,3,5 in cellulose and hemicelluloses<br />
71.4 C2,3,5 in cellulose and hemicelluloses<br />
64.8 C6 in crystalline cellulose Iα, Iβ and paracrystalline cellulose<br />
62.6 C6 in amorphous cellulose or less ordered surface cellulose molecules<br />
20.6 CH3- in acetyl groups<br />
Unbleached pulp<br />
The signal at 104.8 ppm shows a decrease after 1h acetylation and increase with increasing<br />
reaction time. The shoulder at 101.4 ppm increased with increasing acetylation time. The C-1<br />
carbon from cellulose acetate remaining in the cellulose samples gave rise to a broad signal,<br />
which partly overlaps the C-1 carbon from the cellulose (Sassi et al. 2000). The signal at 83.7<br />
ppm assigned to amorphous cellulose or less ordered surface cellulose molecules increased in<br />
intensity. This correlates with a decrease in fibril diameter, maybe acetylation removed layers <strong>of</strong><br />
fibril surfaces. Also the signals at 74.8, 72.1 and 71.4 ppm, which are assigned to C-2,3,5<br />
carbons from cellulose and hemicelluloses, decreased in intensity after 1h and 3h <strong>of</strong> acetylation.<br />
At longer reaction times these intensities started to increase. This may also be due to acetylation<br />
<strong>of</strong> some xylans, because in these regions signals from both cellulose and hemicelluloses are<br />
found. When comparing the region assigned to C-6 a decrease in intensity was observed for the<br />
signal at 62.6 ppm with samples acetylated for 1h, 3h and 5h. After 24h an increase in intensity<br />
for the acetylated sample was obtained.<br />
Bleached pulp<br />
The same acetylation effect was observed in the case <strong>of</strong> bleached pulp. However, differences in<br />
signal intensities were stronger than for unbleached pulp. This means that the acetylation was<br />
more pronounced in the case <strong>of</strong> bleached pulp sample. After integration <strong>of</strong> the regions between<br />
30 and 11 ppm, assigned to CH3 from acetyl groups, and 115 and 50 ppm, assigned to C1-6<br />
carbons from cellulose, it was possible to evaluate the acetylation degree (Table 2). Thus, after<br />
5h the acetylation degree was slightly lower for unbleached pulp while it was clearly higher after<br />
24h as compared with the bleached pulp. The unbleached pulp having a less ordered structure<br />
than bleached one is more susceptible to acetylation.<br />
Table 2. Acetylation degree against reaction time <strong>of</strong> unbleached (UB) and bleached (B) pulps<br />
Sample Acetylation degree Sample Acetylation degree<br />
UB – 1h 0.06 B – 1h 0.05<br />
UB – 3h 0.12<br />
UB – 5h 0.34 B – 5h 0.39<br />
UB – 24h 1.08 B – 24h 0.82<br />
127
COST Action E54 Book<br />
CP/MAS 13 C NMR spectroscopy <strong>of</strong> wood samples<br />
Wood is a complex natural composite material, which contains three major components:<br />
cellulose, a poly-β(1-4)-D-glucopyranosyl linear polymer; hemicelluloses in which, the polyβ(1-4)-D-xylopyranosyl<br />
polymer substituted by O-acetyl groups, is the major compound; and<br />
lignin a polyaromatic three-dimensional amorphous polymer made <strong>of</strong> phenylpropane units<br />
linked through ether bonds. The phenyl rings usually have methoxy substituents. Cellulose<br />
represents the crystalline part (fibrils) <strong>of</strong> wood, which is held together by the hemicelluloses and<br />
the lignins. The main function <strong>of</strong> hemicelluloses and lignins is to support the fibrils. Degradation<br />
<strong>of</strong> any <strong>of</strong> these wood constituents results in a decrease in the strength <strong>of</strong> the material.<br />
Microorganisms capable <strong>of</strong> degrading cellulose produce a battery <strong>of</strong> enzymes with different<br />
specificities, working together. Cellulases hydrolyze the β-1,4-glycosidic linkages <strong>of</strong> cellulose.<br />
Traditionally, they are divided into two classes referred to as endoglucanases and<br />
cellobiohydrolases. Endoglucanases (endo-1,4-β-glucanases, EGs) can hydrolyse internal bonds<br />
(preferably in cellulose amorphous regions) releasing new terminal ends. Cellobiohydrolases<br />
(exo-1,4-β-glucanases, CBHs) acts on the existing endoglucanase-generated chain ends. Both<br />
enzymes can degrade amorphous cellulose but, with some exceptions, CBHs are the only<br />
enzymes that efficiently degrade crystalline cellulose. CBHs and EGs release cellobiose<br />
molecules. An effective hydrolysis <strong>of</strong> cellulose also requires β-glucosidases, which break down<br />
cellobiose releasing two glucose molecules (Eriksson et al. 1990; Leschine 1995, Pérez et al.<br />
2002).<br />
Solid state CP/MAS 13 C NMR spectroscopy has been extensively applied to structural studies <strong>of</strong><br />
natural wood. In native wood the main structural components, cellulose, hemicelluloses, lignin<br />
and, to some extent, extractives, give their characteristic shifts to the spectrum. A characteristic<br />
<strong>of</strong> CP/MAS 13 C NMR <strong>of</strong> wood is the broadening <strong>of</strong> most signals due to the unordered molecular<br />
structure <strong>of</strong> lignin and hemicelluloses and partly cellulose. Relatively sharp signals are assigned<br />
to ordered cellulose or hemicelluloses. Conventional CP/MAS 13 C NMR measurements followed<br />
by signal integration <strong>of</strong> the reference and decayed wood samples was carried out to obtain<br />
information <strong>of</strong> the chemical changes due to the fungal decay.<br />
In the aliphatic region <strong>of</strong> spectra, the intensities <strong>of</strong> the signal at 105 and 89 ppm corresponding to<br />
cellulose resonances are altered by the biodegradation.<br />
However, by observing the shoulder at 101.6 ppm assigned to C1 carbons <strong>of</strong> hemicelluloses, it<br />
could be noted that its intensity was reduced. The biodegradation <strong>of</strong> hemicelluloses reduced the<br />
broad background contribution to the aliphatic part <strong>of</strong> the spectrum, and it may have been<br />
responsible for the apparent sharpening <strong>of</strong> some signals in this region.<br />
After integrating the area <strong>of</strong> the 112-93 ppm region, it decreased with increased exposure time<br />
(Table 1). This is consistent the removal <strong>of</strong> hemicelluloses and also the transformation <strong>of</strong><br />
crystalline cellulose in non-crystalline cellulose during exposure to the two s<strong>of</strong>t rot fungi.<br />
Reference and decayed lime wood gave distinct signals at 55.8 ppm from aryl methoxyl carbons<br />
<strong>of</strong> lignin, the percentage contribution <strong>of</strong> methoxyl C to the total pool <strong>of</strong> carbons from the NMR<br />
spectra increased 5.6% in reference wood to 7.2% upon fungal decay by C. globosum, but was<br />
constant upon decay by T. viride. The resonances between 158-112 ppm are from carbon in<br />
aromatic rings from lignin. These are increasing with the increasing time <strong>of</strong> exposure. One<br />
plausible explanation is that there has been an overall increase in lignin content, which could<br />
elevate the amount <strong>of</strong> aromatic rings and methoxyl groups relative to polysaccharides in the<br />
altered wood.<br />
128
COST Action E54 Book<br />
Table 3. Composition <strong>of</strong> lignocellulosic substrates in reference and decayed lime wood as obtained from<br />
integration <strong>of</strong> CP/MAS 13 C NMR spectra after exposure to s<strong>of</strong>t-rot fungi<br />
Area Sample<br />
C. globosum<br />
0 days 133 days<br />
T viride<br />
0 days 84 days<br />
COO- (177-165 ppm) 3.4 4.8 2.8 4.0<br />
C-3/C-5 <strong>of</strong> S (158-145 ppm) 3.2 4.1 2.8 4.8<br />
C-1/C-4 <strong>of</strong> S (145-125 ppm) 3.3 4.2 3.8 5.0<br />
aromatic C 6.5 8.3 6.6 9.8<br />
C-1 (112-93 ppm) 13.7 12.5 15.2 14.0<br />
C-4 (93-80 ppm) 10.9 10.4 11.3 11.2<br />
C-2, 3, 5 (80-67.5 ppm) 41.1 38.8 40.2 40.0<br />
C-6 (67.5-58.5 ppm) 14.1 13.3 - -<br />
O-alkyl-C 79.8 75.5 66.7 65.2<br />
-OCH3 in lignin (58.5-48 ppm) 5.6 7.2 5.5 5.5<br />
alkyl-C (30.3-29.7 ppm) 1.1 1.1 - -<br />
CH3 (25-16 ppm) 3.5 3.5 3.6 1.7<br />
In addition, the signals <strong>of</strong> the methyl and carboxylic carbons <strong>of</strong> acetyl groups attached to<br />
hemicelluloses resonate at 20.6 and 171.4 ppm, respectively as given in Table 1. The signal at<br />
20.6 ppm was well detected in all wood samples, but became broader and had low intensity in<br />
wood deacayed by T. viride. The integral area <strong>of</strong> the signal at 171.4 ppm increased up to 4.8%<br />
and 4% after 133 and 84 days <strong>of</strong> exposure (COO- in Table 3), suggesting the generation <strong>of</strong> new<br />
carbonyl moieties by the s<strong>of</strong>t rot fungi.<br />
It appears that the main chemical change in wood during decay by the s<strong>of</strong>t-rot fungus C.<br />
globosum, was loss <strong>of</strong> hemicelluloses and cellulose simultaneously with small changes in lignin<br />
structure, mainly loss <strong>of</strong> methoxyl groups, Cα-Cβ bond and β-O-4 bond cleavage. Changes in<br />
wood during decay by T. viride were due to enzymatic removal <strong>of</strong> non-crystalline carbohydrates<br />
with no distinct increase in lignin signals (Table 3).<br />
Conclusions<br />
All signals assigned to carbons from cellulose were observed by NMR spectroscopy. The signals<br />
at 171.4 and 20.6 ppm assigned to COO- and CH3, respectively, in acetyl groups demonstrate<br />
that acetylation took place in both unbleached and bleached pulp samples. The degree <strong>of</strong><br />
acetylation was higher for unbleached pulp than for bleached pulp.<br />
After wood decay a partial removal <strong>of</strong> carbohydrates was observed for both fungi. T. viride<br />
degrades the wood by erosion <strong>of</strong> the fibril surface, while C. globosum degrades carbohydrates<br />
simultaneously with small changes in lignin structure, mainly small loss <strong>of</strong> methoxyl groups and<br />
Cα-Cβ bond cleavage and loss <strong>of</strong> β-O-4 linkages.<br />
Acknowledgements<br />
The EU COST Action E54 “Characterisation <strong>of</strong> the fine structure and properties <strong>of</strong><br />
papermaking fibres using new technologies” is acknowledged for financial support <strong>of</strong> the<br />
STSM.<br />
129
References<br />
COST Action E54 Book<br />
Czarnecki L. and White J.L. (1980): Shear flow rheological properties, fiber damage, and mastication<br />
characteristics <strong>of</strong> aramid-, glass-, and cellulose-fiber-reinforced polystyrene melts. J. Appl. Polym. Sci.<br />
25, 1217-1244<br />
Eriksson K.-E. L., Blanchette R.A. and Ander P. (1990): Microbial and Enzymatic Degradation <strong>of</strong> Wood<br />
and Wood Components. Springer-Verlag, Berlin Heidelberg, 407 pp<br />
Glasser W.G., Tai R., Jain R.K. and Kander R. (1999): Fiber-reinforced cellulosic thermoplastic<br />
composites. J. Appl. Polym. Sci. 73, 1329-1340<br />
Hermann A.S., Nickel J. and Riedel U. (1998): Construction materials based upon biologically renewable<br />
resources—from components to finished parts. Polym. Degrad. Stab. 59, 251-261<br />
Larsson P.T., Wickholm K. and Iversen T. (1997): A CP/MAS13C NMR investigation <strong>of</strong> molecular<br />
ordering in celluloses. Carbohydr. Res. 302, 19-25<br />
Larsson P.T., Hult E.L., Wickholm K., Pettersson E. and Iversen T. (1999): CP/MAS13C NMR<br />
spectroscopy applied to structure and interaction studies on cellulose I. Solid State NMR 15, 31-40<br />
Leschine S.B. (1995): Cellulose degradation in anaerobic environments. Annu. Rev. Microbiol 49, 399-<br />
426<br />
Pérez J., Muñoz-Dorado J., de la Rubia T. and Martínez J. (2002): Biodegradation and biological<br />
treatments <strong>of</strong> cellulose, hemicellulose and lignin: an overview. Int. Microbiol. 5, 53-63<br />
Popescu C.-M., Totolin M., Tibirna C.M., Popescu M.-C., Ander P. and Vasile C. (2011): Structural and<br />
morphological characterization <strong>of</strong> unmodified and grafted unbleached and bleached s<strong>of</strong>twood kraft pulp<br />
fibers. In COST Action E54 “Characterisation <strong>of</strong> the fine structure and properties <strong>of</strong> papermaking fibres<br />
using new technologies”. Eds: Ander P., Bauer W., Heinemann S., Kallio P., Passas R. and Treimanis, A.<br />
Swedish University <strong>of</strong> Agricultural Sciences. p. 253-266. ISBN 978-91-576-9007-4<br />
Sassi J.F. and Chanzy H. (1995): Ultrastructural aspects <strong>of</strong> the acetylation <strong>of</strong> cellulose. Cellulose 2, 111-<br />
127<br />
Sassi J.F., Tekely P. and Chanzy H. (2000): Relative susceptibility <strong>of</strong> the Iα and Iβ phases <strong>of</strong> cellulose<br />
towards acetylation. Cellulose 7, 119-132<br />
You B.R. and Oh S.C. (2010): Nonisothermal kinetics <strong>of</strong> wood degradation in supercritical methanol.<br />
Korean J. Chem. Eng. 27, 1159-1163<br />
Wickholm K., Larsson P.T. and Iversen T. (1998): Assignment <strong>of</strong> non-crystalline forms in cellulose I by<br />
CP/MAS 13C NMR spectroscopy. Carbohydr. Res. 312, 123-129<br />
130
COST Action E54 Book<br />
Chapter 2. New and emerging methods such as microrobotics and<br />
microscopic techniques 131-208<br />
Saketi P. and Kallio P. ”Microrobotic platform for manipulation and<br />
mechanical characterization <strong>of</strong> individual paper fibres” 133-146<br />
Adusumalli R.-B., Kombaiah B., Mook W., Passas R., Raghavan R. and<br />
Michler J. ”Nano- and micro-mechanics <strong>of</strong> single wood pulp fibres” 147-162<br />
Mikczinski M., Bartenwerfer M., Saketi P., Heinemann S., Passas R., Kallio P.,<br />
Fatikow S. “Towards automated manipulation and characterisation <strong>of</strong> papermaking<br />
fibres and its components” 163-178<br />
Kritzinger J., Donoser M., Hirn U. and Bauer W. “Fiber cross section<br />
properties estimated with an automated serial sectioning technique” 179-190<br />
Batchelor W., Kritzinger J., Bauer W., Kuntzsch T. and Meinl G. “Improved<br />
characterization <strong>of</strong> changes in fibre cross section during sheet forming and<br />
drying using optical fibre analyzer data and a serial sectioning technique“ 191-196<br />
Heinemann S., Wang S., Peltonen J. and Kleen M. “Characterization <strong>of</strong> TMP<br />
fiber wall structures by microscopic techniques“ 197-208<br />
131
COST Action E54 Book<br />
132
COST Action E54 Book<br />
MICROROBOTIC PLATFORM FOR MANIPULATION AND<br />
MECHANICAL CHARACTERIZATION OF INDIVIDUAL PAPER FIBERS<br />
Abstract<br />
Pooya Saketi and Pasi Kallio<br />
Micro-and Nanosystems Research Group <strong>of</strong> Tampere University <strong>of</strong> Technology,<br />
Korkeakoulunkatu 3, 33720 Tampere, Finland<br />
pooya.saketi@tut.fi and pasi.kallio@tut.fi<br />
Mechanical characterization <strong>of</strong> individual paper fibers (IPF)s determines the key parameters<br />
which affect the quality <strong>of</strong> paper sheets. Many <strong>of</strong> the current laboratory tests are based on bulk<br />
paper fiber measurements. This paper introduces a microrobotic platform to manipulate and to<br />
characterize paper fibers and fiber bonds at an individual cell level. The platform is able to<br />
characterize paper fibers and bonds directly, not in bulk amount or by using indirect estimations.<br />
In addition, it provides an infrastructure for fully automated IPF characterization with sufficient<br />
amount <strong>of</strong> data to be used by paper and wood scientists for statistical analysis.<br />
This paper focuses on fiber flexibility, an inverse <strong>of</strong> bending stiffness. In the IPF flexibility<br />
measurement, the platform treats a fiber as a both-ends-fixed beam by using two microgrippers<br />
to grasp an IPF from its ends, and to determine the force required to bend the IPF by using a<br />
micro force sensor. A machine vision system provides information about the length <strong>of</strong> the IPFs<br />
and the place where the force is applied, which is always in the middle <strong>of</strong> the IPF. The deflection<br />
<strong>of</strong> the IPF is measured by using a position sensor attached to the force sensor.<br />
Two sets <strong>of</strong> flexibility tests have been completed with the microrobotic platform. The first set<br />
was to determine the effect <strong>of</strong> tensile stress on bending stiffness, carried out by performing tests<br />
while the IPFs were under tension and while they were not under tension. The second set <strong>of</strong> tests<br />
was to compare the flexibility <strong>of</strong> two different samples, a hardwood and a s<strong>of</strong>twood sample.<br />
Finally, the flexibility <strong>of</strong> a chemically-treated s<strong>of</strong>twood sample was measured as an additional<br />
challenge. In addition to the flexibility measurement, this paper discusses manipulating and<br />
breaking <strong>of</strong> individual paper fiber bonds using the platform. Measuring the strength <strong>of</strong> individual<br />
paper fiber bonds requires further development.<br />
Introduction<br />
The development <strong>of</strong> micro-and nanorobotic technologies and systems and their demonstration in<br />
different application sectors has been very active in the recent years (Kim et al. 2008; Krohs et<br />
al. 2007; Matsuokaa et al. 2005; Sakaki et al. 2007; Wang et al. 2007). Micro- and nanorobotics<br />
have provided significant added value to the research <strong>of</strong> living cells such as oocytes and<br />
embryos manipulated in liquid suspension (Desai et al. 2007; Jager et al. 2000; Park et al. 2004),<br />
various adherent eukaryotic cells which need a substrate to grow in, bacterial cells and even subcellular<br />
components and structures (Arai et al. 2002; Georgiev et al. 2004; Hirvonen et al. 2008;<br />
Inoue et al. 2005; Kallio and Kuncova 2006; Kallio et al. 2007; Sun et al. 2004). Other important<br />
application areas <strong>of</strong> micro- and nanorobotic systems are microassembly (Eichhorn et al. 2007;<br />
Sardan et al. 2008), manipulation <strong>of</strong> nanoparticles such as carbon nanotubes (Carlson et al.<br />
2007), and material characterization using nanoindentation methods (Tze et al. 2007), for<br />
example. Even though micro- and nanorobotics have been extensively studied in many<br />
application areas, the potential <strong>of</strong> micro- and nanorobotic technologies has been very<br />
inadequately utilized in pulp and paper research.<br />
133
COST Action E54 Book<br />
Understanding the properties <strong>of</strong> papermaking fibers will contribute to the understanding <strong>of</strong> paper<br />
properties as well. For example, researchers and engineers are using mathematical and physical<br />
models to estimate the microscale properties <strong>of</strong> pulp and paper (H<strong>of</strong>stetter et al. 2009). The<br />
mechanical properties and the chemical composition <strong>of</strong> papermaking fibers are normally<br />
determined by bulk (i.e. average) parameters using sample portions <strong>of</strong> the papermaking fibers<br />
under study. The average bulk parameters, however, do not provide a real possibility for<br />
predicting relevant fiber properties and chemical composition. The interest in and the necessity<br />
<strong>of</strong> getting new information and data on papermaking fibers, fiber wall fine structures, and fiberfiber<br />
bonds have increased during the recent years.<br />
In addition to the new measurement data, controlled mechanical treatment and chemical<br />
functionalization <strong>of</strong> individual paper fibers (IPFs) could lead to dramatic improvements in the<br />
properties <strong>of</strong> fiber products. The aforementioned controlled functionalization, treatment and<br />
characterization <strong>of</strong> individual fibers request new tools. The methods currently available in<br />
industrial and academic fiber research laboratories are typically very laborious to use, require<br />
extensive manual preparation and provide a very low yield. Currently available mechanical fiber<br />
characterization methods include flexibility and tensile strength measurements. Tensile tests are<br />
typically made using micro-tensile testing (Burgert et al. 2003; Eder et al. 2008; Hinterstoisser et<br />
al. 2003; Salmén et al. 2004), even though a microrobotic method <strong>of</strong> nanoindentation has already<br />
been reported in the study <strong>of</strong> the tensile strength properties <strong>of</strong> single paper fibers (Tze et al.<br />
2007).<br />
Different methods are available to estimate the flexibility <strong>of</strong> the IPFs. CyberFlex is a commercial<br />
product from Papertech, Inc. which measures the flexibility <strong>of</strong> IPFs by using regular optics and<br />
image processing algorithms. The weakness <strong>of</strong> CyberFlex is its low throughput and a timeconsuming<br />
procedure for sample preparation. Measurement <strong>of</strong> wet fiber flexibility by confocal<br />
laser scanning microscopy based on the fiber conformability method was reported recently (Yan<br />
and Li 2008). In this method, the free span length was measured directly from the transverse<br />
view <strong>of</strong> the fiber span. The collapsibility and the moment <strong>of</strong> inertia can also be measured from<br />
the fiber’s cross-section which enables the measurement <strong>of</strong> the elastic modulus <strong>of</strong> the IPFs.<br />
Measurement <strong>of</strong> IPF flexibility in a flow cell based device has also been reported (Eckhart et al.<br />
2009). Considering the current fiber flexibility methods to measure the flexibility <strong>of</strong> individual<br />
paper fibers, they all measure the flexibility <strong>of</strong> the IPFs indirectly.<br />
Micro- and Nanosystems Research Group <strong>of</strong> the Department <strong>of</strong> Automation Science and<br />
Engineering foresees that micro- and nanorobotic technology facilitates the development <strong>of</strong> a<br />
novel research platform which will allow the required versatile fiber studies at a sufficiently high<br />
throughput at an individual cell level in a single instrument.<br />
This paper presents such a versatile microrobotic platform and illustrates fiber manipulation,<br />
flexibility measurement and breaking individual paper fiber bonds (IPFB)s as examples <strong>of</strong> the<br />
operations which will be performed with the platform. The most important advantage <strong>of</strong> the<br />
approach used in the platform is the ability to measure the flexibility <strong>of</strong> the IPFs directly. The<br />
platform is also able to manipulate and break individual paper fiber bonds, which is the first step<br />
towards individual bond strength measurement. In addition, it provides an infrastructure for a<br />
fully automated paper fiber manipulation and mechanical characterization platform.<br />
The rest <strong>of</strong> this paper is organized as follows. Firstly, it explains the theory and the principles <strong>of</strong><br />
flexibility measurement, the architecture and conceptual design <strong>of</strong> the platform, and the technical<br />
requirements <strong>of</strong> the platform. Next, it describes the design and implementation, and the<br />
134
COST Action E54 Book<br />
experiments performed by using the platform. Finally, it elucidates the results and conclusions,<br />
and the actions to be taken in continuation <strong>of</strong> this research.<br />
Theory<br />
The first goal in developing the platform is to measure the flexibility <strong>of</strong> the IPFs. The principle<br />
<strong>of</strong> the measurement is to utilize the "Beam Theory" (Young and Budynas 2002) in a case, where<br />
both ends <strong>of</strong> the beam are fixed. Figure 1 illustrates a beam with both-ends-fixed boundary<br />
condition.<br />
Figure 1. Both-ends-fixed boundary conditions under transverse loading<br />
The maximum deflection, ymax, <strong>of</strong> a both-ends-fixed beam with length L, under a concentrated<br />
intermediate load, F, applied on distance, a, from the origin is<br />
y max<br />
2<br />
� 2F(<br />
L � a ) a<br />
� 2<br />
3EI(<br />
L � 2a<br />
)<br />
3<br />
2aL L<br />
at x � if a �<br />
L � 2a 2<br />
where E is young’s modulus and I is moment <strong>of</strong> inertia <strong>of</strong> the beam. Therefore, if the force is<br />
applied in the center <strong>of</strong> the beam, the maximum deflection value is as follows:<br />
y max<br />
3<br />
� FL L<br />
� at x � a �<br />
192EI<br />
2<br />
Flexibility is the compliance <strong>of</strong> an elastic body to deformation by an applied force; or in the<br />
other words, it is the inverse <strong>of</strong> bending stiffness,<br />
Flexibility<br />
1 192 y<br />
�<br />
EI � FL<br />
� (3)<br />
max<br />
3<br />
In the aforementioned analysis, axial loading <strong>of</strong> the beam was not considered. Figure 2 illustrates<br />
a beam with both-ends-fixed boundary conditions under simultaneous axial, Pt , and transverse<br />
loading, F.<br />
Figure 2. Both-ends-fixed boundary conditions under simultaneous axial tension and transverse loading<br />
135<br />
(1)<br />
(2)
Conceptual Design<br />
COST Action E54 Book<br />
The architecture <strong>of</strong> the platform is illustrated in Figure 3. It includes six main functions: sample<br />
storage, micromanipulation, force sensing, visualization, dispensing and control.<br />
Figure 3 shows these six functions and their interaction to each other. Each function is divided to<br />
sub-functions which are explained in this section in details.<br />
Figure 3. Main functions<br />
Sample storage (F1) consists <strong>of</strong> three sub-functions: suspension storage, dry storage and frame<br />
fixture. To pick up and separate IPFs, it is necessary to disintegrate the dry pulp and make the<br />
paper fibers float in the water. Fibers are dried and stored in a paper fiber bank. The individual<br />
paper fiber bank (IPF-bank) is a place to store the IPFs sorted based on their type, length and<br />
treatment for example. The coordinates <strong>of</strong> the sorted and stored IPFs and their properties are<br />
saved for a later use. The platform also prepares samples for other instruments, such as Atomic<br />
Force Microscope (AFM) or Scanning Electron Microscope (SEM).<br />
Micromanipulation function (F2) enables micropositioning, micro-orienting and microgripping<br />
<strong>of</strong> the IPFs. The micropositioning sub-function is used for placing the area <strong>of</strong> interest – an IPFbank,<br />
a rotary table, a force sensor – in the working space <strong>of</strong> microgrippers. Micro-orienting<br />
facilitates the change <strong>of</strong> fiber orientation; and microgripping performs the grasping and handling<br />
<strong>of</strong> IPFs. Micromanipulation is also used for moving the dispenser and aligning the dispenser tip<br />
on the required targets to shoot droplets for chemical treatment.<br />
Force Sensing function (F3) encompasses two sub-functions, flexibility measurement and bond<br />
strength measurement. This function measures the magnitude <strong>of</strong> force, F, which is applied to the<br />
IPFs to bend them and uses information from the other functions such as the length <strong>of</strong> IPFs, L,<br />
from the visualization function (F4) in the control system, to measure the flexibility <strong>of</strong> IPFs. It<br />
also measures the bond strength between two IPFs.<br />
Visualization function (F4) is composed <strong>of</strong> four sub-functions: imaging, magnification,<br />
illumination and signal analysis. Imaging sub-functions acquire visual information to be used as<br />
visual feedback in the control function (F6). Considering the IPFs dimensions, a sufficient<br />
136
COST Action E54 Book<br />
magnification and high quality illumination are essential. To accomplish pattern recognition and<br />
image analysis as quickly as possible, an independent signal analysis sub-function is required.<br />
Dispensing (F5) encompasses two sub-functions, preparatory-chemical treatment which is<br />
required in the sample storage function (F1); and instant chemical treatment which is useful<br />
when chemical treatment is needed before the flexibility measurement test.<br />
The most important sub-function <strong>of</strong> the control function (F6) is the micromanipulation control<br />
which controls micropositioning, micro-orienting and microgripping devices. Visualization<br />
control sub-function regulates zooming and fine focusing. A user interface sub-function connects<br />
all the control sub-functions to the human operator. Force feedback sub-function supplies a<br />
sensible force feedback to the human operator. Dispensing control sub-function triggers the<br />
dispenser and provides the required droplet size for chemical treatment. The required<br />
calculations to measure the flexibility <strong>of</strong> the IPFs are performed in the measurement algorithm<br />
sub-function.<br />
Technical Requirements<br />
This section encompasses technical requirements <strong>of</strong> the platform to manipulate IPFs, to measure<br />
the flexibility <strong>of</strong> the IPFs and to break individual paper fiber bonds without measuring the bond<br />
strength. The major technical requirements for micromanipulation, visualization and force<br />
sensing functions stem from the IPF’s dimensions and throughput objectives.<br />
Micromanipulation<br />
Whereas characterizing few IPFs is not sufficient to provide valuable statistical information<br />
about paper fibers, it is necessary to perform these characterization tests automatically. Based on<br />
wood scientists’ requirements, five thousand tests per day, 24 hours, provides adequate amount<br />
<strong>of</strong> data for statistical analysis. Six hours calibration and maintenance break for a day is reserved;<br />
this leaves 13s for each experiments. Six tasks are identified in a flexibility measurement<br />
procedure: IPF recognition and coordinate calculation, IPF orientation and pick up, IPF length<br />
measurement, IPF transport to force sensing place, chemical treatment and force sensing and<br />
calculation; providing an average <strong>of</strong> 2.16s for each task.<br />
The micropositioning, micro-orienting and microgripping sub-functions are implemented by<br />
using a two degrees-<strong>of</strong>-freedom (DOF) micropositioner, a rotary table and three microgrippers<br />
mounted on XYZ-micropositioners, respectively. The technical requirements <strong>of</strong> the<br />
aforementioned sub-functions are shown in Table 1 which are derived based on the average time<br />
<strong>of</strong> each task, minimum and maximum diameter <strong>of</strong> IPFs, accessibility <strong>of</strong> micropositioner to all<br />
sections <strong>of</strong> the platform, the required travel directions, the required resolution and speed, and the<br />
accessibility <strong>of</strong> microgrippers to the rotary table, the IPF-bank and the force sensor.<br />
Table 1. Technical requirements <strong>of</strong> micromanipulation<br />
Resolution Direction Speed Travel<br />
Micropositioning Sub-µm XY 9 mm/s 4 cm<br />
Micro-orienting 1 10 µ° CW-CCW 3 30°/s 90°<br />
Microgripping 2 Sub-µm XYZ-Gripping 9 mm/s 2 cm<br />
1) Diameter: Min.1 cm<br />
2) Gripper Tip Opening: Min. 70µm, Max. 1 mm<br />
3) CW – CCW: Clock Wise – Counter Clock Wise<br />
137
Visualization<br />
COST Action E54 Book<br />
In paper fiber studies, a high optical resolution is necessary to achieve detailed images. Based on<br />
the IPF dimensions, the required Field <strong>of</strong> View (FOV) is around 4.5×2 mm 2 . In another hand, a<br />
broad image <strong>of</strong> the test bench and microgrippers is also needed which requires a larger FOV<br />
such as 20×8 mm 2 . To have a proper image <strong>of</strong> the paper fibers 3X magnification is required. To<br />
have the broad image <strong>of</strong> the working space 0.25X magnification is required leading to a<br />
magnification range <strong>of</strong> 0.25X - 3.0X. Since a wide range <strong>of</strong> magnification is needed, a zooming<br />
tube microscope is preferred to a constant magnification tube microscope. To know the<br />
magnitude <strong>of</strong> the zoom to estimate the length <strong>of</strong> paper fiber, a computer controlled motorized<br />
zooming system is needed. Considering the size <strong>of</strong> XYZ-micropositioners, the required working<br />
distance <strong>of</strong> the tube microscope is minimum 5 cm. In flexibility measurement application where<br />
only the length <strong>of</strong> the IPF is measured from the image, the required spatial resolution for the<br />
camera is calculated to be 5.0 µm or better.<br />
Force measurement<br />
In order to select a suitable micro force sensor, it is necessary to estimate the amount <strong>of</strong> force<br />
required to measure the flexibility <strong>of</strong> the IPFs. When two microgrippers are used to grasp the<br />
IPFs, the both-ends-fixed boundary conditions <strong>of</strong> the beam theory are applicable in this case.<br />
The formula for calculating bending stiffness and flexibility <strong>of</strong> IPFs under both-ends-fixed<br />
boundary conditions is explained in the Section: Theory. Regarding to the fact that cellulose is<br />
the main material in a paper fiber cell wall, it is possible to use the Young’s modulus <strong>of</strong><br />
microcrystalline cellulose, 25±4 GPa (Eichhorn and Young 2001), the geometry <strong>of</strong> hardwood and<br />
s<strong>of</strong>twood and Equation 3 to simulate the required forces to bend an IPF. The simulation shows<br />
that the maximum required forces for hardwood and s<strong>of</strong>twood are 206 µN and 29 µN,<br />
respectively. Table 2 shows the flexibility values simulated based on the Young’s modulus <strong>of</strong><br />
microcrystalline cellulose and typical average IPF dimensions. In this simulation, it is assumed<br />
that the IPF is a symmetrical tube, made <strong>of</strong> only homogeneous cellulose and the maximum<br />
deflection, ymax, is 2% <strong>of</strong> the length <strong>of</strong> the IPFs. The hardwood/s<strong>of</strong>twood flexibility ratio based<br />
on this simulation is 23.<br />
Table 2. Flexibility values based on the Young’s modulus <strong>of</strong> microcrystalline cellulose. Assumption:<br />
Maximum deflection is 2% <strong>of</strong> the length <strong>of</strong> the IPFs<br />
Design and Implementation<br />
Bending Stiffness<br />
(Nm 2 )×10 -9<br />
Flexibility<br />
(N -1 m -2 )×10 9<br />
S<strong>of</strong>twood 29.7 0.34<br />
Hardwood 12.8 7.82<br />
This section explains design and implementation <strong>of</strong> the platform. It includes a survey and<br />
selection <strong>of</strong> the devices used to implement the micromanipulation, visualization and force<br />
sensing functions in the platform. Considering the technical requirements <strong>of</strong> the visualization<br />
function, a motorized zoom system providing 0.29X-3.50X magnification and LED coaxial<br />
illumination are chosen (Navitar Co.). The camera (XCD-U100 Sony) selected has a 1=1.8"<br />
CCD cell chip, a resolution <strong>of</strong> 1600×1200 pixel and a pixel size <strong>of</strong> 4.4 µm. After several design<br />
iterations, a Stacked Gantry Crane configuration, shown in Figure 4, is used in the platform. It<br />
provides several benefits, such as having the most compact design without coordinate mapping<br />
and with fixed camera.<br />
138
COST Action E54 Book<br />
Table 3 shows the components <strong>of</strong> platform based on numbering <strong>of</strong> Figure 4. In this<br />
configuration, there are two tailored 4DOF (1, 2), and one 5DOF (3) micromanipulator from<br />
SmarAct Co. In addition to the XYZ-positioners and the microgripper, the 5DOF unit includes a<br />
positioner for a dispenser (4). The platform includes also a XY-Table (6) <strong>of</strong> SmarAct on top <strong>of</strong><br />
which the following equipment are mounted: force sensor (FT-S540 by Femto Tools) (8), a<br />
micro-rotary table (SR-1908 by SmarAct) (5), and the IPF-bank (7) to perform the designed<br />
tasks. The IPF-bank is made <strong>of</strong> SU-8, a common epoxy-based negative photoresistant polymer<br />
used in lithography, with the height <strong>of</strong> 200 µm and placed on XY-Table to store the sorted IPFs.<br />
Figure 5 shows the top and side view <strong>of</strong> the current implementation <strong>of</strong> the platform.<br />
1<br />
Figure 4. 3D Design <strong>of</strong> the platform<br />
Table 3. Components <strong>of</strong> the platform<br />
2<br />
6<br />
8<br />
No. Component DOF<br />
1, 2 Microgripper (1, 2) 4 – XYZ+Gripping<br />
3 Microgripper (3) 5 – XYZ+Gripping+Dispenser Positioner<br />
4 Dispenser --<br />
5 Rotary Table 1 – Rotation in XY-Plane<br />
6 Micropositioner 2 – XY- Plane<br />
7 IPF Bank --<br />
8 Force Sensor --<br />
139<br />
4<br />
7<br />
5<br />
3
3<br />
8<br />
COST Action E54 Book<br />
Figure 5. Implementation <strong>of</strong> the platform. Top: Side-view. Bottom: Top-view<br />
2<br />
140<br />
5<br />
6<br />
1
Experiments<br />
COST Action E54 Book<br />
This section discusses the experiments on measuring the IPF flexibility and breaking IPFBs<br />
using the platform.<br />
Flexibility Measurement<br />
S<strong>of</strong>twood, hardwood and treated s<strong>of</strong>twood are used as raw materials in the experiments. Sample<br />
1 is bleached Pine kraft pulp which is s<strong>of</strong>twood. Sample 2 is bleached hardwood pulp. As an<br />
additional challenge, Sample 1 is treated such that only the S2 and S3 layers and some residues<br />
<strong>of</strong> S1 layer remain in the cell wall.<br />
A small bundle <strong>of</strong> paper fibers is taken from the pulp sample. The bundle is placed in a Petri dish<br />
and it is disintegrated by adding deionized water and shaking. Then the IPFs are soaked for five<br />
minutes. Next, the IPFs are placed on the rotary-table by using a pipette. Figure 6 illustrates the<br />
process <strong>of</strong> IPF manipulation and flexibility measurement in 27±2% relative humidity and<br />
25±1°C temperature. The microgrippers pick up the IPF from the rotary-table, (1 and 2), and<br />
then straighten the IPF by pulling (3 and 4). The effective length, L, <strong>of</strong> the IPF is measured by<br />
using the visualization function. The force sensor is then pushed in the middle <strong>of</strong> the IPF by<br />
using the XY-table and the required amount <strong>of</strong> force F (5 and 6 in Figure 6). The deflection, y,<br />
<strong>of</strong> the center point <strong>of</strong> the IPF is read-out from the position sensor <strong>of</strong> the XY-table.<br />
Figure 6. Flexibility measurement using the platform<br />
The vertical alignment <strong>of</strong> the IPFs is done by using the force sensor probe. Figure 7 illustrates<br />
the IPF vertical alignment process. First the force sensor’s probe is placed in the middle <strong>of</strong> the<br />
IPF (Figure 7-a). Next, keeping the force sensor’s Z-direction coordinate fixed and by moving<br />
the force sensor in the XY-plane, the IPF misalignment is recognized (Figure 7-b, c). Then, the<br />
IPFs are aligned by adjusting the microgrippers in the Z-direction (Figure 7-e, f). Finally, the IPF<br />
alignment is checked before starting the actual tests (Figure 7-d).<br />
141
COST Action E54 Book<br />
Figure 7. Vertical alignment <strong>of</strong> IPF. a, b, c: Before alignment. d, e, f: After alignment<br />
Bond Breaking<br />
In order to demonstrate the capability <strong>of</strong> breaking an individual fiber bond, the bond must first<br />
be produced. The following procedure was used in preparing the individual fiber bonds (IPFB).<br />
A small bundle <strong>of</strong> bleached Pine kraft pulp is placed in a Petri dish and it is disintegrated by<br />
adding deionized water and shaking. Next, the IPFs are placed randomly between two 4×4 cm 2<br />
Teflon plates by using a pipette. Then, the plates are pressed together and kept in 70 °C for one<br />
hour. After the incubation, the IPFBs are identified in a light microscope and moved to rotary<br />
table manually by using tweezers. Figure 8 shows an IPFB.<br />
Figure 8. Individual paper fiber bond (IPFB) <strong>of</strong> bleached Pine kraft pulp<br />
Figure 9 shows the process <strong>of</strong> breaking an IPFB. The IPFB on the rotary table is identified<br />
(Figure 9-a). Next, two parallel axis microgrippers grasp the both ends <strong>of</strong> IPFB and lift it from<br />
the rotary table (Figure 9-b, c). The third microgripper which is perpendicular to the other two<br />
microgrippers is used to grasp the crossed IPF (Figure 9-d). After a secure grasp, the third<br />
microgripper pulls the crossed IPF until the bond breaks (Figure 9-e, f).<br />
142
Identified<br />
IPFB<br />
COST Action E54 Book<br />
Figure 9. Process <strong>of</strong> breaking individual fiber bonds (IPFB)<br />
Results and Conclusions<br />
The IPF manipulation, flexibility measurements and breaking an IPFB are demonstrated. The<br />
flexibility <strong>of</strong> three different samples is measured under different boundary conditions. The<br />
applied loading is either transverse loading and zero axial tension or simultaneous axial and<br />
transverse loading; and the boundary conditions in all tests are both-ends-fixed. Table 4<br />
illustrates all the test results.<br />
Table 4. Results <strong>of</strong> flexibility measurement<br />
a b c<br />
d e f<br />
Test Bending Stiffness (Nm 2 )×10 -9 Flexibility (N -1 m -2 )×10 9<br />
S<strong>of</strong>twood – ZAT* (n=10) 0.12±0.042 9.37±4.2<br />
S<strong>of</strong>twood – UAT** (n=10) 0.30±0.1 3.73±1.37<br />
Hardwood (n=10) 0.0077±0.0044 204.83±170.19<br />
S<strong>of</strong>twood – S2-S3 0.29 ± 0.24 7.63 ± 6.93<br />
* ZAT: Zero Axial Tension<br />
** UAT: Under Axial Tension<br />
The hardwood IPFs have a higher flexibility compared to s<strong>of</strong>twood IPFs. The<br />
hardwood/s<strong>of</strong>twood flexibility ratio based on simulation and experiments are about 23 and 22,<br />
respectively; which indicates similar ratio <strong>of</strong> flexibility values. The IPF model used in the<br />
simulation is a symmetrical tube but the measured IPFs are pulp fibers which are asymmetric<br />
and they have structural disorders. Furthermore, the simulation assumes that the paper fiber cell<br />
wall is made <strong>of</strong> only homogeneous cellulose; but it also contains hemicelluloses and lignin in<br />
addition to cellulose in reality. Therefore, the results based on simulation differ from the average<br />
results based on experiments but they have similar hardwood/s<strong>of</strong>twood flexibility ratio.<br />
Although the average flexibility values <strong>of</strong> the treated s<strong>of</strong>twood fibers seem to differ from the<br />
normal s<strong>of</strong>twood, the high coefficient <strong>of</strong> variation prevents a reliable comparison <strong>of</strong> the<br />
flexibility between the two samples. The IPFs used in the aforementioned tests are pulp fibers<br />
and not wood fibers. The pulping process damages the IPF’s body seriously. Wood fibers,<br />
143
COST Action E54 Book<br />
however, are screened manually based on their botanical properties, such as latewood or<br />
earlywood, fibers or tracheids, etc. This issue is one <strong>of</strong> the main sources <strong>of</strong> errors in these<br />
measurements. The preliminary flexibility tests with s<strong>of</strong>twood IPFs under axial tension show<br />
improvements in the repeatability <strong>of</strong> the results but the mathematical model which includes the<br />
effect <strong>of</strong> the axial tension needs to be incorporated. Breaking <strong>of</strong> the IPFBs can be performed<br />
successfully by using the platform which is the first step towards individual bond strength<br />
measurement.<br />
Future Works<br />
In the continuation <strong>of</strong> this research the following actions can be taken. The aforementioned tests<br />
need to be repeated by using wood fiber samples instead <strong>of</strong> pulp fiber samples to achieve better<br />
standard deviations.<br />
The preliminary flexibility tests with s<strong>of</strong>twood IPFs under axial tension show improvements in<br />
the repeatability <strong>of</strong> the results but the mathematical model which includes the effect <strong>of</strong> the axial<br />
tension needs to be incorporated. It is necessary to integrate an axial force sensor into the<br />
platform, to measure the actual flexibility <strong>of</strong> the IPFs under simultaneous axial and transverse<br />
loading. Considering the state <strong>of</strong> the art on single fiber studies, there is no direct method to<br />
measure the IPF-IPF bond strength. This platform provides the infrastructure for such a<br />
measurement. A force sensor needs to be integrated in the platform to measure the IPFB<br />
strength.<br />
The flexibility tests can be performed in wet conditions either by using a humidity chamber or by<br />
performing the test under water. It is possible to place the probe <strong>of</strong> the force sensor and the tip <strong>of</strong><br />
the grippers under water. Therefore, by changing the angle <strong>of</strong> the force sensor, the flexibility<br />
tests can be performed under water. A controlled humidity and temperature chamber should be<br />
added to the platform, because the standard conditions for testing the IPFs require 50%±2<br />
relative humidity and 20±1°C temperature.<br />
To collect statistically reliable information, it is necessary to make aforementioned teleoperated<br />
processes fully automated in the future to perform hundreds <strong>of</strong> flexibility tests per hour. On the<br />
other hand, this platform can be used not only for IPFs but also for other kinds <strong>of</strong> fibers in<br />
microscale.<br />
Acknowledgement<br />
The authors gratefully acknowledge the support <strong>of</strong> European Cooperation in Science and<br />
Technology (COST), specifically COST Action E54 for financially supporting the workshops<br />
and short-term-scientific-missions, and The Finnish Funding Agency for Technology and<br />
Innovation (Tekes) for funding SMARTFIBRE project.<br />
144
References<br />
COST Action E54 Book<br />
Arai F., Sakami T., Maruyama H., Ichikawa A. and Fukuda T. (2002): Minimally Invasive<br />
Micromanipulation <strong>of</strong> Microbe by Laser Trapped Micro Tools. IEEE International Conference on<br />
Robotics and Automation (ICRA’02) USA, 1937-1942<br />
Burgert I., Frühmann K., Keckes J., Fratzl P., Stanzl-Tschegg S. E. (2003): Microtensile Testing <strong>of</strong> Wood<br />
Fibers Combined with Video Extensometry for Effcient Strain Detection. Holzforschung 57(6) 661–664<br />
Carlson K., Andersen K. N., Eichhorn V., Petersen D. H., Molhave K., Bu I. Y. Y., Teo K. B. K., Milne<br />
W. I., Fatikow S. and Boggild P. (2007): A Carbon Nan<strong>of</strong>ibre Scanning Probe Assembled using an<br />
Electrothermal Microgripper. Nanotechnology 18, 34, 7pp<br />
Desai J. P., Pillarisetti A. and Brooks A. D. (2007): Engineering Approaches to Biomanipulation. Annu<br />
Rev Biomed Eng, Vol. 9, No. 1, Mar. 2007, pp 35-53<br />
Eckhart R., Donoser M. and Bauer W. (2009): Single Fibre Flexibility Measurement in a Flow Cell<br />
Based Device, In Proceedings <strong>of</strong> Advances in Paper Science and Technology (FRC)<br />
Eder M., Stanzl-Tschegg S. and Burgert I. (2008): The Fracture Behaviour <strong>of</strong> Single Wood <strong>Fibres</strong> is<br />
Governed by Geometrical Constraints: In Situ ESEM Studies on Three Fibre Types. Wood Sci. Technol.<br />
42, 8 679-689<br />
Eichhorn S.J. and Young R.J. (2001): The Young’s Modulus <strong>of</strong> a Microcrystalline Cellulose. Cellulose 8,<br />
3 197–207<br />
Eichhorn V., Carlson K., Andersen K.N., Fatikow S. and Boggild P. (2007): Nanorobotic Manipulation<br />
Setup for Pick-and-Place Handling and Nondestructive Characterization <strong>of</strong> Carbon Nanotubes. IEEE/RSJ<br />
Int. Conf. Intelligent Robots and Systems (IROS’07), USA, 291-296<br />
Georgiev A., Allen P.K. and Edstrom W. (2004): Visually-guided Protein Crystal Manipulation using<br />
Micromachined Silicon Tools. IEEE/RSJ Int. Conf. Intelligent Robots and Systems (IROS’04), Japan,<br />
236-241<br />
Hinterstoisser B., Åkerholm M. and Salmén L. (2003): Load Distribution in Native Cellulose.<br />
Biomacromolecules 4, 5 1232–1237<br />
Hirvonen J., Ronkanen P., Ylikomi T., Bläuer M., Suuronen R., Skottman H. and Kallio P. (2008):<br />
Microcutting <strong>of</strong> Living Tissue Slices and Stem Cell Colonies by Using Mechanical Tool and Liquid Jet.<br />
IEEE RAS & EMBS Int. Conf. Biomedical Robotics and Biomechatronics (BIOROB’08), USA, 612-617<br />
H<strong>of</strong>stetter K. and Gamstedt E. K. (2009): Hierarchical Modelling <strong>of</strong> Microstructural Effects on<br />
Mechanical Properties <strong>of</strong> Wood. Holzforschung 63, 2 130–138<br />
Inoue K., Arai T., Tanikawa T. and Ohba K. (2005): Dexterous Micromanipulation Supporting Cell and<br />
Tissue Engineering. IEEE Int. Symp. Micro-NanoMechatronics and Human Science (MHS’05), Japan,<br />
197-202<br />
Jager E. W. H., Inganäs O. and Lundström I. (2000): Microrobots for Micrometer-Size Objects in<br />
Aqueous Media: Potential Tools for Single-Cell Manipulation. Science 288, 5475 2335 - 2338<br />
Kallio P. and Kuncova J. (2006): Capillary Pressure Microinjection <strong>of</strong> Living Adherent Cells: Challenges<br />
in Automation. JµM 3, 3-4 189-220<br />
Kallio P., Ritala T., Lukkari M. and Kuikka S. (2007): Injection Guidance System for Cellular<br />
Microinjections. Int. J. Robot Res. 26, 11-12 1303 - 1313<br />
145
COST Action E54 Book<br />
Kim K., Liu X., Zhang Y. and Sun Y. (2008): Nanonewton Force-Controlled Manipulation <strong>of</strong> Biological<br />
Cells Using a Monolithic MEMS Microgripper with Two-Axis Force Feedback. J. Micromech.<br />
Microeng. 18(2008) 055013 (8pp)<br />
Krohs F., Hagemann S. and Fatikow S. (2007): Automated Cell Characterization by a Nanohandling<br />
Robot Station. Mediterranean Conf. Control & Automation (MED’07), Greece, 1-6<br />
Matsuokaa H., Komazakia T., Mukaia Y., Shibusawaa M., Akanea H., Chakic A., Uetakec N. and Saitoa<br />
M. (2005): High Throughput Easy Microinjection with a Single-Cell Manipulation Supporting Robot.<br />
Biotec. 116, 2 185-194<br />
Park J., Jung S. H., Kim Y. H., Byungkyu K., Lee S. K., Ju B. and Lee K.I. (2004): An Integrated Bio<br />
Cell Processor for Single Embryo Cell Manipulation. IEEE/RSJ Int. Conf. Intelligent Robots and<br />
Systems (IROS’04), Japan, 242-247<br />
Sakaki K., Dechev N., Park E.J. and Burke R.D. (2007): Development <strong>of</strong> a Five Degree-Of-Freedom<br />
Biomanipulator for Autonomous Single Cell Electroporation. IEEE/RSJ Int. Conf. Intelligent Robots and<br />
Systems (IROS’07) USA, 3137-3143<br />
Salmén L. (2004): Micromechanical Understanding <strong>of</strong> the Cell-Wall <strong>Structure</strong>. J. Plant Biol. Pathol. 327,<br />
9 873-880<br />
Sardan O., Eichhorn V., Petersen D. H., Fatikow S., Sigmund O. and Boggild P. (2008): Rapid<br />
Prototyping <strong>of</strong> Nanotube-Based Devices using Topology-Optimized Microgrippers. Nanotechnology<br />
19(2008) 495503 (9pp)<br />
Sun Y., Greminger M.A. and Nelson B.J. (2004): Investigating Protein <strong>Structure</strong> with a Microrobotic<br />
System. IEEE Int. Conf. Robotics and Automation (ICRA’04), USA, 2854-2859<br />
Tze W.T.Y., Wang S., Rials T.G., Pharr G.M., Kelley S.S. (2007): Nanoindentation <strong>of</strong> Wood Cell Walls:<br />
Continuous Stiffness and Hardness Measurements. Compos Part A-Appl. Sci. Manufacturing 38, 3 945-<br />
953<br />
Yan D. and Li K. (2008): Measurement <strong>of</strong> Wet Fiber Flexibility by Confocal Laser Scanning<br />
Microscopy. J. Mater. Sci. 43, 8 2869–2878<br />
Young W. C. and Budynas R. G. (2002): Roak’s Formulas for Stress and Strain - Seventh Edition,<br />
McGRAW-Hill<br />
Wang W., Liu X., Gelinas D., Ciruna B. and Sun Y. (2007): A Fully Automated Robotic System for<br />
Microinjection <strong>of</strong> Zebrafish Embryos. Plos One, 2, 9 e862<br />
146
COST Action E54 Book<br />
NANO- AND MICRO- MECHANICS OF SINGLE WOOD PULP FIBRES<br />
1 Ramesh-Babu Adusumalli, 1 Boopathy Kombaiah, 1 William Mook, 2 Raphaël Passas,<br />
1 Rejin Raghavan, 1 Johann Michler<br />
1 Mechanics <strong>of</strong> Materials and Nanostructures, Swiss Federal Laboratories for Materials Testing<br />
and Research, EMPA, CH-3602 Thun, Switzerland<br />
Abstract<br />
2 Laboratory <strong>of</strong> Pulp and Paper Science and Graphic Arts, Grenoble INP-Pagora,<br />
38400 Saint Martin d’Heres Cedex, France<br />
E-mail: adusumalli_2000@yahoo.com; johann.michler@empa.ch<br />
Mechanical testing <strong>of</strong> single pulp fibres is rarely discussed due to the difficulties in handling the<br />
specimens. In the present investigation, the nano- and micro-mechanics <strong>of</strong> single pulp fibres<br />
(chemical) are studied by using nanoindentation and a novel in-situ SEM microindentation<br />
technique. In order to study the pulp fibres at cell wall scale, single fibres were subjected to<br />
indentation tests using a nanoindenter equipped with an AFM scanner. It has been shown that the<br />
bleaching process, a routine technique in pulp industry, causes a reduction in cell wall hardness<br />
due to the removal <strong>of</strong> lignin. To understand the fibre deformation and to identify the critical<br />
stress level in transverse direction, a novel in-situ scanning electron microscope (SEM)<br />
microindentation technique was adopted for the first time to test single industrial pulp fibres.<br />
The cell wall deforms by ‘elastic’ sinking-in and lateral bulging <strong>of</strong> the micr<strong>of</strong>ibrils. In addition,<br />
the paper frame set-up used previously (Adusumalli et al. 2006) to test single long fibres has<br />
been modified here in order to test both hardwood and s<strong>of</strong>twood pulp fibres in tension. Due to<br />
the brittle nature <strong>of</strong> the pulp fibres, the proposed single fibre tensile tests did not yield promising<br />
results, although some successful measurements are reported for s<strong>of</strong>twood pulp fibres.<br />
Introduction<br />
Wood fibre or cell is a complex anisotropic material and is composed <strong>of</strong> cell wall and lumen.<br />
The cell wall consists <strong>of</strong> a thin primary wall (P), the most external layer, and secondary walls <strong>of</strong><br />
S1 layer, S2 layer, and S3 layer. The S2 wall, thickest among all cell wall layers, consists <strong>of</strong> up<br />
to 50% partly crystalline cellulose micr<strong>of</strong>ibrils wound in a spiral fashion around the stem axis<br />
and embedded in a matrix <strong>of</strong> hemicellulose and lignin (Mark et al. 2002). The spiral angle <strong>of</strong> the<br />
cellulose fibrils is known as micro fibril angle (MFA) and it is considered to be the most<br />
influential factor in wood and pulp fibre mechanical properties (Courchene et al. 2006,<br />
Lichtenegger et al. 1999, Page and El-Hosseiny 1983). Both, s<strong>of</strong>twood (longer fibres, thinner<br />
cell walls in earlywood and thicker cell walls in latewood: 2-10 µm) and hardwood (shorter<br />
fibres, cell wall thickness: 2-5 µm) are used as a fibre source for paper and board (Karlsson<br />
2006).<br />
Wood is converted to pulp fibres by a pulping process. Since the middle lamella is readily<br />
dissolved away by macerating solutions, chemical pulping or cooking is widely used to separate<br />
the cells (fibres) from the middle lamella. Bleaching is performed after cooking in order to<br />
increase the brightness <strong>of</strong> the pulp. Bleaching <strong>of</strong> chemical pulps is a multi-stage process where<br />
the lignin is oxidized, decomposed and finally eliminated from the pulp fibres. As a result <strong>of</strong><br />
cooking, bleaching and subsequent drying, pulp fibres are more collapsed (reduction in lumen<br />
size), thin-walled (P and S1 layers are peeled <strong>of</strong>f) and flattened in shape compared to native<br />
147
COST Action E54 Book<br />
wood fibres (Karlsson 2006). Mohlin et al. (1996) reported the process induced defects such as<br />
micro compressions, curls, twists and kinks along the cell length as a result <strong>of</strong> chemical pulping<br />
and refining. Even though it is widely accepted that paper constitutes pulp fibres with processinduced<br />
defects as well as natural defects such as pits, not enough studies have been carried out<br />
to understand the influence <strong>of</strong> fibre damage on the paper network. Pulp quality is generally<br />
determined by preparing hand sheets and then performing standard paper testing methods such<br />
as zero-span tensile tests and short-span compression tests (Mark et al. 2002). Due to the nonuniform<br />
geometry and chemical composition <strong>of</strong> individual pulp fibres, only a few studies have<br />
been performed to understand the single pulp fibre deformation and their mechanical properties.<br />
Unlike textile fibres, single pulp fibre tensile tests are not routinely carried out with commercial<br />
instrumentation due to their limited length (1-4 mm) and width (15-40 µm). However a few<br />
studies can be found in literature about the single fibre testing <strong>of</strong> pulp fibres, mostly on s<strong>of</strong>twood<br />
fibres. Page (1971) and Page and El-Hosseiny (1983) published the results <strong>of</strong> 1.2 mm long single<br />
spruce pulp fibres and also reported a correlation between MFA and elastic modulus. Mott et al.<br />
(1995) studied the virgin and recycled pulp fibres (1.2 mm long) and found that natural defects<br />
such as bordered pits are crack initiators in single fibre tensile testing. In most <strong>of</strong> the single fibre<br />
tests, the ball and socket method was used to fix the fibres between two droplets; load is<br />
measured through the load cell while the tensile test is carried out either under light microscopy<br />
(Gilani 2006) or environmental scanning electron microscopy (ESEM) (Burgert et al. 2005; Mott<br />
et al. 1995). Elongation in tensile test is measured either with cross-head movement or image<br />
analysis. Recently Eder et al. (2008) studied the earlywood and latewood single fibres by<br />
subjecting them to tensile testing under ESEM. Similarly single fibre testing <strong>of</strong> bast fibres and<br />
man-made fibres were also quoted elsewhere (Adusumalli et al. 2006). Dunford and Wild (2002)<br />
studied the mechanical behaviour <strong>of</strong> single pulp fibres using cyclic transverse compression. Xing<br />
et al. 2008 studied the influence <strong>of</strong> thermomecahnical refining pressure on pulp fibre properties<br />
using the nanoindentation technique.<br />
Mohlin et al. (1996) reported that fully bleached commercial pulps are more deformed than<br />
unbleached pulps. Deformation such as kinks, angular folds and twists which are prone to<br />
change the direction <strong>of</strong> the fibre axis are found to have a negative effect on the tensile index,<br />
compressive strength, etc. So in the present study, the influence <strong>of</strong> bleaching on single pulp fibre<br />
properties is conducted. Here, the paper frame set-up was modified for the tension test in order<br />
to fix the fibres <strong>of</strong> small length commonly seen in hardwood fibres. Since the aim <strong>of</strong> the present<br />
study is to understand the pulp fibre properties at cell wall dimensions, nanoindentation is<br />
performed for the first time on fibre cross-sections to measure the hardness and elastic modulus<br />
<strong>of</strong> the S2 cell wall. Since the indentation displacement range is generally between 0.1 to 2 µm, it<br />
is possible to probe localised areas <strong>of</strong> collapsed pulp fibre cell walls having thicknesses <strong>of</strong> 2 to 5<br />
µm. Nanoindentation <strong>of</strong> wood fibre cell walls was studied by several authors (Gindl et al. 2004,<br />
Wu et al. 2009, Zickler et al. 2006). Since the tensile and nanoindentation tests are performed in<br />
the longitudinal direction, a third test is introduced in this chapter to understand the “localised”<br />
deformation and fracture behaviour <strong>of</strong> a single pulp fibre in the transverse direction. This novel<br />
technique allows real time correlation between the cell wall deformation and the response from<br />
the load cell in addition to advantages <strong>of</strong> the scanning electron microscope (SEM) over an<br />
optical microscope used in other studies. In the present paper the in-situ SEM microindentation<br />
<strong>of</strong> transverse pulp fibres is explained and preliminary results are reported.<br />
Materials and methods<br />
S<strong>of</strong>twood pulp (Scots pine, Pinus sylvestris) as a dry sheet and hardwood pulp (Eucalyptus,<br />
Eucalyptus globulus) as pellets produced in the laboratory were used as raw materials for the<br />
148
COST Action E54 Book<br />
present study. Kappa numbers <strong>of</strong> unbleached hardwood (HWUB), bleached hardwood (HWB),<br />
unbleached s<strong>of</strong>twood (SWUB) and bleached s<strong>of</strong>twood (SWB) were 13, 1.5, 29 and
COST Action E54 Book<br />
Figure 2. Set-up for nanoindentation <strong>of</strong> single pulp fibre cell walls using Hysitron TriboIndenter<br />
On average 3-5 indents were placed on each fibre cross section. Each indent was composed <strong>of</strong> four<br />
loading cycles with increasing peak load from 20 µN in steps <strong>of</strong> 40 µN, resembling cyclic<br />
indentation (Figure 3). A maximum load <strong>of</strong> 160 µN was selected to avoid the edge effects<br />
caused by low cell wall thickness, collapse behaviour <strong>of</strong> pulp fibres and to stay within the<br />
displacement range where the area function had been calibrated for the specific indenter tip. For<br />
all steps the loading and unloading speed was 20 µN / s and the holding time at peak load was 12<br />
s to monitor the visco-plastic creep. An ultra sharp cube corner tip made <strong>of</strong> diamond was used to<br />
perform the indents on the fibre cross sections. The load–displacement curves obtained from all<br />
experiments were evaluated according to the Oliver-Pharr method (Oliver and Pharr 1992)<br />
where peak load (Pmax), depth at peak load (h) and initial slope <strong>of</strong> the unloading curve (S) are<br />
used to measure the hardness (Pmax / A). Contact area A at Pmax was determined from the known<br />
shape <strong>of</strong> the indenter which is calibrated by indenting a material with known properties (in this<br />
case fused quartz). Reduced elastic modulus (Er) as shown in Equation (1) is almost identical to<br />
E in the case <strong>of</strong> s<strong>of</strong>t materials and is termed indentation modulus throughout this paper.<br />
1 S<br />
Er � �<br />
(1)<br />
2 A<br />
Microindentation<br />
For microindentation, ten long single pulp fibres (~ one mm length) are fixed at both ends with<br />
epoxy droplets on ten different conductive glass slides which contained indium tin oxide as a top<br />
layer to minimize charging during SEM imaging. Then, each conductive glass slide was fixed to<br />
the SEM stub using double sided carbon tape and sputter coated with a 6 nm thick goldpalladium<br />
layer to avoid further charging. Microindentation was carried out at 0 % moisture<br />
content <strong>of</strong> the pulp fibres in an environment <strong>of</strong> 10 -6 mbar and 296 K inside a Zeiss DSM962<br />
SEM. A detailed description <strong>of</strong> the in-situ SEM microindentation set-up is available elsewhere<br />
(Rabe et al. 2004). As shown in Figure 4, a conical diamond indenter (cone angle <strong>of</strong> 43º) ending<br />
in a flat-top (diameter <strong>of</strong> ~ 2 µm) was used in the present study. For all the tests, deformation<br />
was carried out at a constant displacement rate <strong>of</strong> 100 nm/s and corresponding load (P) vs.<br />
displacement (h) curves were obtained.<br />
150
COST Action E54 Book<br />
Figure 3. Typical load-displacement graph <strong>of</strong> a nanoindentation experiment<br />
(A)<br />
Figure 4. (A) In-situ SEM microindentation <strong>of</strong> the pulp fibre in transverse direction. Flattened cross<br />
section <strong>of</strong> the pulp fibre and the shape <strong>of</strong> the lumen can be observed. (B) SEM image <strong>of</strong> the indenter tip<br />
having the flat-top surface. Inset picture corresponds to the schematic diagram <strong>of</strong> the flat-top conical<br />
micro-indenter showing conical angle and depth <strong>of</strong> penetration hu.<br />
Single fibre tensile test<br />
5 µm<br />
Under a stereomicroscope, dried single fibres were extracted using small tweezers and fixed to<br />
the paper frame with cyano acrylate glue as shown in Figure 5. The paper frame set-up,<br />
generally used for single fibre testing <strong>of</strong> brittle fibres such as carbon fibres (ASTM D3379-75),<br />
has been modified for pulp fibres. Initially, one paper frame (yellow) was cut with gauge lengths<br />
ranging from 0.5 mm to 3 mm in order to test both s<strong>of</strong>twood and hardwood fibres. After fixing<br />
<strong>of</strong> the fibre ends to the yellow frame, it was fixed to another paper frame (black) and two side<br />
edges <strong>of</strong> the yellow paper frame were cut free using a fine razor blade under a stereo<br />
microscope. The whole set-up was then clamped to the tensile jaws as shown in Figure 5a, and<br />
the two side edges <strong>of</strong> the black frame were cut free very carefully, thus, only the fibre was<br />
subjected to tensile forces as shown in Figure 5b (image was taken after tensile test). Before<br />
clamping, fibre diameter (average <strong>of</strong> three measurements) and gauge length were measured<br />
using a stereomicroscope. The tensile test was carried out in an UTS machine equipped with a<br />
10N load cell and elongation was measured through cross-head movement. All tests were carried<br />
out with a displacement rate <strong>of</strong> 500 µm / min and at environmental conditions <strong>of</strong> 25 °C and 55 %<br />
relative humidity.<br />
151<br />
(B)<br />
43 °<br />
2 µm<br />
h u<br />
1 µm
COST Action E54 Book<br />
Figure 5. Double paper frame (yellow and black) set-up developed for tensile testing <strong>of</strong> single pulp fibres<br />
(see the black arrow) which are glued to the yellow paper frame. a) Set-up before tensile testing. b) Setup<br />
after tensile testing revealing the fibre break at the middle. c) SEM image <strong>of</strong> the fibre shown in b.<br />
Fibre twist, which causes the fibre to break in tension, can be seen in the SEM image.<br />
Results and Discussion<br />
Nanoindentation<br />
Figure 6 shows an optical micrograph <strong>of</strong> pulp fibres embedded in epoxy resin and sectioned until<br />
a smooth surface is achieved as explained in the previous section. This micrograph was taken<br />
prior to nanoindentation using normal reflected light microscopy in order to map the latewood<br />
cell cross-sections. Undoubtedly, this micrograph reveals not only fibre cross sections but also<br />
some tilted (misaligned fibre cross sections) and longitudinal sections due to the fibre<br />
misalignment. Since pulp fibres are 1-3 mm length, highly deformed and irregular in their aspect<br />
ratio, it is difficult to achieve a specimen with all fibres aligned in one direction. Additionally,<br />
since the indentation modulus is influenced by this fibre misalignment (Konnerth et al. 2009),<br />
care is taken to select only longitudinally-aligned fibre cross sections which are free from other<br />
artefacts such as microtome knife markings. One way <strong>of</strong> checking the fibre alignment is to<br />
compare the shapes <strong>of</strong> the fibre cross section before indentation (Figure 6a) and after indentation<br />
followed by 10-20 µm sectioning <strong>of</strong> surface material (Figure 6b). This technique is followed in<br />
our experiments by progressive sectioning <strong>of</strong> 17 µm thick material as explained in Figure 6.<br />
The scanning probe microscopy image <strong>of</strong> residual indents on pulp fibre cell wall after<br />
nanoindentation is shown in Figure 1. Both fibres are collapsed (decrease in lumen) and<br />
compressed such that the lumen exhibits variability in its cell wall thickness. However no<br />
variability in indentation modulus Er and hardness H was observed across the cell wall. This is<br />
most likely because indents were performed on very localised areas <strong>of</strong> the cell wall where<br />
minimal cell wall defects were found. It is therefore assumed that Er and H values obtained from<br />
nanoindentation tests are higher than average values. When typical load – depth curves are<br />
observed (Figure 3), both pulp and epoxy (embedding medium) revealed elasto-plastic behaviour<br />
during loading and unloading in addition to creep while holding at the peak load. Indentation<br />
152
COST Action E54 Book<br />
modulus and hardness values <strong>of</strong> different pulp grades are displayed in Figure 7 and 8<br />
respectively. On average, more than 30 measurements were used for each fibre type. In many<br />
tests, a slight decrease in Er and H was observed with increasing indentation depth.<br />
Figure 6. Optical micrograph <strong>of</strong> the smoothly polished pulp fibre-epoxy nanoindentation specimen.<br />
Image (a) is taken prior to the first nanoindentation test and image (b) is taken prior to the second<br />
nanoindentation test, both tests are performed on the same cell wall cross sections. After first<br />
nanoindentation test, specimen was brought to the polishing lab and 17 µm thick material was sectioned<br />
progressively from the top surface and the same cell wall cross sections were identified under light<br />
microscope (See the oval and hexagonal areas). Subsequently specimen was brought again to the<br />
nanoindenter to perform the second test. This technique was followed to understand the influence <strong>of</strong> fibre<br />
misalignment in nanoindentation measurements.<br />
Similarly nanoindentation <strong>of</strong> viscose and lyocell fibres also revealed a decrease in hardness and<br />
elastic modulus with increasing indentation depth (Gindl et al. 2006). This is most likely not due<br />
to the surrounding epoxy but due to the difficulties in detecting the surface contact at low loads<br />
(Jakes et al. 2007). Quantitative analysis <strong>of</strong> nanoindentation data revealed an average Er and H<br />
<strong>of</strong> 12.2 ± 1.6 GPa and 0.42 ± 0.05 GPa respectively for S2 cell walls <strong>of</strong> unbleached Scots pine<br />
pulp. For S2 wall <strong>of</strong> spruce latewood, Zickler et al. (2006) reported average Er and H <strong>of</strong> 14.2<br />
GPa and 0.40 GPa respectively. Gindl et al. (2004) reported Er <strong>of</strong> 16.2 GPa and H <strong>of</strong> 0.43 GPa<br />
for the latewood Norway spruce (MFA 20°). So the values <strong>of</strong> the unbleached s<strong>of</strong>twood pulp are<br />
in good agreement with the values presented by Zickler and Gindl. Er <strong>of</strong> 9.1±1.6 GPa and H <strong>of</strong><br />
0.43±0.05 GPa were obtained for unbleached eucalyptus pulp. Wu et al. (2009) reported a Er <strong>of</strong><br />
20.2 GPa and H <strong>of</strong> 0.49 GPa as an average values <strong>of</strong> 10 hardwood species. In Figure 7 and 8, Er<br />
and H <strong>of</strong> the epoxy resin were determined to be 4.6 GPa and 0.24 GPa respectively which were<br />
measured under the same conditions as the cross section measurements. Gindl and Gupta (2002)<br />
presented the Er and H <strong>of</strong> same epoxy resin as 3.1 GPa and 0.10 GPa respectively, where a<br />
berkovich tip was loaded to a peak force <strong>of</strong> 500 µN.<br />
153
Indentation Young's modulus modulus (GPa) (GPa)<br />
18<br />
16<br />
14<br />
12<br />
10<br />
8<br />
6<br />
4<br />
2<br />
COST Action E54 Book<br />
0<br />
N= 47 63 67 31 19<br />
HWUB HWB SWUB SWB EPOXY<br />
Figure 7. Nanoindentation results showing indentation modulus or reduced elastic modulus <strong>of</strong> pulp fibre<br />
cell walls and epoxy resin (HWUB= Hardwood unbleached; HWB= Hardwood bleached; SWUB=<br />
S<strong>of</strong>twood unbleached; SWB= S<strong>of</strong>twood bleached; N= number <strong>of</strong> samples). The box and whisker plot<br />
shows the mean value (small square in the box), median (horizontal line inside the box), the 50%<br />
interquartile range (box), maximum and minimum values (whiskers) and outliers.<br />
Regarding the Er shown in Figure 7, unbleached hardwood showed significantly lower values<br />
than unbleached s<strong>of</strong>twood. After the bleaching treatment, both hardwood and s<strong>of</strong>twood revealed<br />
a similar Er value <strong>of</strong> ~11 GPa for a similar Kappa number <strong>of</strong> ~1 (lignin content 0.2%). For a<br />
similar indentation depth, Gindl et al. (2006) reported an Er <strong>of</strong> ~ 11 GPa for lyocell fibre<br />
composed <strong>of</strong> 100 % cellulose. Since Er is directly proportional to MFA as revealed by several<br />
nanoindentation studies (Gindl et al. 2004, Wu et al. 2009), it is difficult to interpret the Er<br />
values <strong>of</strong> different pulp grades shown in Figure 7 without the MFA measurements. But<br />
unfortunately it is also difficult to evaluate the accurate MFA <strong>of</strong> pulp fibres especially where<br />
indentation is performed, although some studies have been reported in literature (Donaldson<br />
1991, Pleasants et al. 1998).<br />
Hardness values measured from nanoindentation are shown in Figure 8. Since H is a plastic<br />
property <strong>of</strong> the material unlike Er, MFA does not influence the hardness value which could be<br />
the reason that no difference in H was observed between s<strong>of</strong>twood and hardwood in the present<br />
study. This supports the recent study that nanoindentation hardness is related to the cell wall<br />
matrix (Konnerth et al. 2009). Similary Wu et al. (2009) also found no significant trend between<br />
nanoindentation hardness and MFA <strong>of</strong> ten hardwood species. In general, bleaching treatment<br />
increases the ductility <strong>of</strong> the cell wall assembly by degrading the lignin, which eventually leads<br />
to lower hardness values compared to the unbleached fibres <strong>of</strong> both hardwood and s<strong>of</strong>twood as<br />
shown in Figure 8. This can be understood as follows: the lignin content <strong>of</strong> the wood is around<br />
23 % and cell wall hardness is around 0.42 GPa (unpublished data). Based on the Kappa<br />
numbers measured in this study, the lignin content <strong>of</strong> the unbleached s<strong>of</strong>twood and hardwood<br />
pulp is around 4.4 % and 2 % respectively. Even though lignin content decreased significantly<br />
from wood to unbleached pulps, the hardness value remained constant i.e. ~0.42 GPa. The lignin<br />
content <strong>of</strong> the bleached fibres was measured to be 0.2 % and their hardness values were in the<br />
range <strong>of</strong> 0.36 GPa. That means removal <strong>of</strong> the lignin-hemicellulose matrix during bleaching<br />
154
COST Action E54 Book<br />
plays a significant role in stress transfer between cellulose micr<strong>of</strong>ibrils. When the lignin content<br />
was further reduced to zero percentage in lyocell fibres, the hardness value drops drastically to<br />
0.24 GPa, in which only hydrogen bonding and van der Waals bonding takes place between<br />
cellulose-cellulose molecules.<br />
Hardness (GPa)<br />
0.8<br />
0.7<br />
0.6<br />
0.5<br />
0.4<br />
0.3<br />
0.2<br />
0.1<br />
N= 47 63 67 31 19<br />
HWUB HWB SWUB SWB EPOXY<br />
Figure 8. Nanoindentation results showing the hardness <strong>of</strong> pulp fibre cell walls and epoxy (HWUB=<br />
Hardwood unbleached; HWB= Hardwood bleached; SWUB= S<strong>of</strong>twood unbleached; SWB= S<strong>of</strong>twood<br />
bleached; N= number <strong>of</strong> samples.<br />
Microindentation<br />
Figure 9 shows the typical P-h curve obtained from in-situ SEM microindentation <strong>of</strong> single pulp<br />
fibre in transverse direction. Insets are SEM micrographs revealing the real-time deformation<br />
and fracture sequence <strong>of</strong> the fibre. At the beginning <strong>of</strong> the indentation test, non-linear behaviour<br />
<strong>of</strong> the P-h curve arises due to the non-uniform geometry <strong>of</strong> the fibre and results in proper contact<br />
with the glass substrate (not shown in Figure 9). The deformation and failure sequence <strong>of</strong> the<br />
fibre shown in Figure 9 is described as follows. Initial deformation was accommodated by<br />
sinking-in <strong>of</strong> the upper cell wall, followed by cracking, which corresponds to the kink or load<br />
drop in the P-h curve. Crack propagation occurs along the longitudinal axis <strong>of</strong> the fibre, while<br />
the initiation seems to be dominated by stress concentrations at the surface. As the load<br />
increases, a second crack was initiated at ~ 10 mN. The two cracks propagated along the axis to<br />
a length <strong>of</strong> around 10 µm, most likely parallel to the micro fibril angle (MFA). Crack formation<br />
led to local collapse <strong>of</strong> the cell wall and the indenter punched through the upper cell wall.<br />
Continued indentation into the lumen and the lower cell wall yielded an increase in the steepness<br />
<strong>of</strong> the P-h curve due to substrate effects (Figure 9). The cracks formed on upper cell wall, close<br />
to unloading, and a residual imprint <strong>of</strong> the conical punch can be seen in the pulp fibre.<br />
155
COST Action E54 Book<br />
Figure 9. Load (P) - displacement (h) curve and corresponding SEM video sequence <strong>of</strong> microindentation<br />
test. Arrows labelled in SEM micrographs represent crack initiation and crack propagation probably<br />
along the micr<strong>of</strong>ibril angle. Schematic mechanism <strong>of</strong> the microindentation test is shown in inset (top left).<br />
Tougher responses were observed during the deformation <strong>of</strong> other fibres. It is understood that<br />
the fibre geometry will play a significant role when a fibre is subjected to lateral compression,<br />
because fibre collapse precedes the cell wall compression (Mark et al. 2002, Nyrén 1971). But, it<br />
is important to note that, in the present study, the load was applied locally, which leads to large<br />
stresses and correspondingly large strains. Hence, the P-h curve shown in Figure 9 is mostly<br />
based on the indentation response <strong>of</strong> the cell walls and specific to the given geometry <strong>of</strong> the fibre<br />
and indenter. Based on these assumptions, the critical stress required to initiate a crack or<br />
deformation in the cell wall was calculated for three successful measurements (Adusumalli et al.<br />
2010b). Failure sequence <strong>of</strong> single fibres subjected to longitudinal compression differs from the<br />
failure sequence found in this study. Loosening <strong>of</strong> the fibrils, piling-up <strong>of</strong> the fibrillar walls and<br />
eventual fibril fracture as reported by Sachs (1986) during longitudinal compression were also<br />
observed in the present study. But, as shown in Figure 9, SEM micrographs did not reveal any<br />
slip bands similar to those observed during longitudinal compression <strong>of</strong> single pulp fibres.<br />
156
800<br />
700<br />
600<br />
500<br />
400<br />
300<br />
200<br />
100<br />
24<br />
21<br />
18<br />
15<br />
12<br />
9<br />
6<br />
3<br />
0<br />
E-Modulus (GPa)<br />
COST Action E54 Book<br />
Tensile strength (MPa)<br />
Elongation at break (%)<br />
Pulp Lyocell Pulp F Lyocell I Pulp J Lyocell M<br />
Figure 10. Tensile properties <strong>of</strong> bleached s<strong>of</strong>t wood pulp and lyocell fibres obtained from single fibre<br />
testing. Box-and whisker diagram showing the tensile modulus (left), strength (centre) and elongation at<br />
break (right) (average <strong>of</strong> 9 measurements).<br />
Single fibre tensile test<br />
Double paper frame set-up developed to test single fibres did not yield enough results in case <strong>of</strong><br />
hardwood fibres (lengths are between 500-800 µm). Fibre lengths exceeding 1 mm such as<br />
s<strong>of</strong>twood fibres and bleached fibres (ductile and flexible compared to unbleached fibres) can be<br />
tested easily by the set-up developed in this test series. On average 10 fibres were tested and<br />
results <strong>of</strong> the successfully measured bleached s<strong>of</strong>twood pulp and lyocell fibres are displayed in<br />
Figure 10. Here, lyocell is taken as reference fibre. Elastic modulus (E-modulus) was obtained<br />
from the initial slope <strong>of</strong> the stress-strain curve (Figure 11). Good agreement was found between<br />
lyocell tensile values shown in Figure 10 and values presented in literature (Adusumalli et al.<br />
2009). Tensile strength <strong>of</strong> approx. 300 MPa and E-modulus <strong>of</strong> approx. 3 GPa was measured for<br />
bleached s<strong>of</strong>t wood pulp. Standard deviations are very high for single pulp fibres due to their<br />
natural variability.<br />
For the successful tensile measurements, SEM fractographs were taken by sputtering the fibre<br />
with a 20 nm gold-platinum coating. In case <strong>of</strong> wood and pulp fibres, it is well known that<br />
increasing micro fibril angle will decrease the tensile modulus and strength. Similar results are<br />
shown in Figures 11-13, where SEM fractographs are compared to the tensile stress-strain<br />
curves. The curve shown in Figure 11a corresponds to high strength and modulus due to low<br />
twist (presumably low MFA), in which cleavage occurred across the fibre (Figure 13). The curve<br />
shown in Figure 11b corresponds to low strength and low modulus due to extreme fibre twists<br />
(presumably high MFA) in which angular cleavage is typically found (Figure 12). Both fibres<br />
revealed no significant difference in their elongation at break, since the amorphous matrix (low<br />
in quantity for bleached fibres) controls the strain <strong>of</strong> the fibre, whereas strength and modulus<br />
depend on cellulose nan<strong>of</strong>ibrils which are oriented around the fibre axis. Considering the<br />
unsuccessful measurements, in most cases, fibre breakage occurred while cutting the black paper<br />
157<br />
800<br />
700<br />
600<br />
500<br />
400<br />
300<br />
200<br />
100<br />
24<br />
21<br />
18<br />
15<br />
12<br />
9<br />
6<br />
3<br />
0
COST Action E54 Book<br />
frame using the razor blade. Page et al. (1983) tested only s<strong>of</strong>twood fibres with span lengths <strong>of</strong><br />
1.2 mm and they used a hot wire to burn the paper frame. Tensile testing <strong>of</strong> hardwood single<br />
fibres will remain a challenge until some in-situ techniques are adopted.<br />
Figure 11. Stress-strain diagram <strong>of</strong> untwisted (a) and twisted (b) single bleached s<strong>of</strong>twood pulp fibres<br />
obtained from tensile test. The corresponding SEM fractographs <strong>of</strong> fibre a and b are shown in Figure 13<br />
and Figure 12, respectively.<br />
Figure 12. Stereomicroscopic image <strong>of</strong> the single pulp fibre prior to tensile test (a). Severe twists can be<br />
observed in the fibre (a and b). SEM fractographs <strong>of</strong> the same fibre after tensile test (b,c). Angular<br />
cleavage is found as a typical tensile failure mode for all twisted fibres.<br />
158
COST Action E54 Book<br />
Figure 13. Stereomicroscopic image <strong>of</strong> the single pulp fibre prior to tensile test (left). Almost no twists<br />
can be observed in the fibre shown here. SEM fractograph <strong>of</strong> the same fibre after tensile test (right).<br />
Cleavage across the fibre diameter was found as a typical tensile failure mode for all untwisted fibres.<br />
Conclusions<br />
We have shown that nanoindentation can be used as a tool to estimate changes in the mechanical<br />
properties <strong>of</strong> cell walls caused by bleaching and also to study the differences in cell wall<br />
mechanical properties between hardwood and s<strong>of</strong>twood. After kraft cooking, prior to bleaching,<br />
indentation modulus <strong>of</strong> 12 GPa was observed for s<strong>of</strong>twood pulp which is 25 % higher than for<br />
hardwood pulp. But, bleaching treatment decreased the hardness value <strong>of</strong> both s<strong>of</strong>twood and<br />
hardwood pulps indicating the importance <strong>of</strong> critical kappa number (lignin content) during<br />
residual delignification. After cooking, bleaching and drying stages, both hardwood and<br />
s<strong>of</strong>twood fibres have similar Er (~10.5 ± 2.1 GPa) and H (~ 0.377 ± 0.033 GPa)<br />
The deformation response <strong>of</strong> single pulp fibres was studied in-situ SEM microindentation, which<br />
revealed correspondence between the cell wall failure mechanisms and the P-h curve response.<br />
The failure sequence <strong>of</strong> single fibre cell walls begins with sinking-in and lateral bulging <strong>of</strong> the<br />
micr<strong>of</strong>ibrils followed by cell wall fracture. It was found that a critical stress <strong>of</strong> ~ 50 MPa is<br />
required to initiate cracks in the cell wall, which propagate parallel to the micr<strong>of</strong>ibril angle.<br />
Chemical pulp fibres <strong>of</strong> bleached s<strong>of</strong>twood were successfully tested in tension by using a newly<br />
developed double paper frame set-up. A correlation was also observed between scanning<br />
electron microscopy (SEM) fractographs and tensile stress-strain curves. But, by this method it<br />
is difficult to test fibres <strong>of</strong> small length (hardwood) and low flexibility (unbleached).<br />
Acknowledgement<br />
This research was funded by State Secretariat for Education and Research, Switzerland (Grant<br />
number: C.07.0023) and partly funded by COST - European Co-operation in Science and<br />
Technology (Action number: E54). Dr. Jean-Marc Breguet (CSEM, Switzerland) is gratefully<br />
acknowledged for his contribution to the project proposal and project execution. We are very<br />
thankful to Pr<strong>of</strong>. Ralph Spolenak and Dr. Marianne Dietiker from the Department <strong>of</strong> Materials,<br />
ETH Zürich, Switzerland for allowing us to use their Hysitron TriboIndenter. The authors would<br />
like to thank Dr. Kilian Wasmer, Mr. Peter Ramseier, Mr. Gerhard Buerki and Mr. Hans-Beat<br />
Mosimann for their contribution in specimen preparation and tensile test set-up. We would like<br />
to thank Dr. Patrick Schwaller, Dr. Tanja Zimmermann and Dr. Stephan Fahlbusch for many<br />
helpful comments on the manuscript. Pr<strong>of</strong>. Gindl (BOKU University, Vienna) is greatly<br />
acknowledged for supplying lyocell fibres.<br />
159
References<br />
COST Action E54 Book<br />
Adusumalli R-B., Reifferscheid M., Roeder T., Weber H., Sixta H. and Gindl W. (2006): Mechanical<br />
Properties <strong>of</strong> Regenerated Cellulose <strong>Fibres</strong> for Composites. Macromol. Symp. 244, 119-125<br />
Adusumalli R-B., Keckes J., Martinschitz K., Boesecke P., Roeder T., Weber H., Sixta H. and Gindl W.<br />
(2009): Comparison <strong>of</strong> molecular orientation and mechanical properties <strong>of</strong> lyocell fibre tow and staple<br />
fibres. Cellulose 16(5), 765-772<br />
Adusumalli R-B., Mook W., Passas R., Schwaller P. and Michler J. (2010a): Nanoindentation <strong>of</strong> single<br />
pulp fibre cell walls. J. Mat. Sci. 45(10), 2558 – 2563<br />
Adusumalli R-B., Raghavan R., Schwaller P., Zimmermann T. and Michler J. (2010b): In situ SEM<br />
microindentation <strong>of</strong> single wood pulp fibres in transverse direction. J. Electron Microscopy 1-5, DOI:<br />
10.1093/jmicro/dfg025<br />
ASTM D 3379-75 (1982): Standard test method for tensile strength and youngs modulus for high-<br />
modulus single filament materials, Philadelphia, U.S.A.<br />
Burgert I., Eder M., Frühmann K., Keckes J., Fratzl P. and Stanzl-Tschegg S. (2005): Properties <strong>of</strong><br />
chemically and mechanically isolated fibres <strong>of</strong> spruce (Picea abies [L. Karst].). Part-3: Mechanical<br />
characterisation. Holzforschung 59, 354-357<br />
Courchene C.E., Peter G.F. and Litvay J. (2006): Cellulose micr<strong>of</strong>ibril angle as a determinant <strong>of</strong> paper<br />
strength and hygroexpansivity in Pinus taeda L. Wood Fibre Sci. 38(1), 112-120<br />
Donaldson L.A. (1991): The use <strong>of</strong> pit apertures as windows to measure micr<strong>of</strong>ibril angle in chemical<br />
pulp fibres. Wood Fibre Sci. 23(2), 290-295<br />
Dunford J.A. and Wild P.M. (2002): Cyclic transverse compression <strong>of</strong> single wood pulp fibres. J. Pulp<br />
Paper Sci. 28(4), 136-141<br />
Eder M., Stanzl-Tschegg S. and Burgert I. (2008): The fracture behaviour <strong>of</strong> single wood fibres is<br />
governed by geometrical constraints: in situ ESEM studied on three fibre types. Wood Sci. Technol. 42,<br />
679-689<br />
Gilani M. S (2006): A micromechanical approach to the behaviour <strong>of</strong> single wood fibres and wood<br />
fracture at cellular level. PhD Thesis, EPFL Lausanne, Switzerland<br />
Gindl W. and Gupta H.S (2002): Cell wall hardness and Young’s modulus <strong>of</strong> melamine-modified spruce<br />
wood by nanoindentation. Composites Part A. 33, 1141-1145<br />
Gindl W., Gupta H.S., Schöberl T., Lichtenegger H.C. and Fratzl P. (2004): Mechanical properties <strong>of</strong><br />
spruce wood cell walls by nanoindentation. Appl. Phys. A 79, 2069-2073<br />
Gindl W., Konnerth J. and Schöberl T. (2006): Nanoindentation <strong>of</strong> regenerated cellulose fibres. Cellulose<br />
13, 1-7<br />
Jakes J.E., Stone D.S. and Frihart C.R. (2007): Nanoindentation size effects in wood. Proc. 30th Annual<br />
Meeting Adhesion Society, Inc, Tampa Bay, Florida, USA. pp: 15-17<br />
Karlsson H. (2006): Fibre Guide – Fibre analysis and process applications in the pulp and paper industry.<br />
ISBN: 91-631-7899-0. AB Lorentzen & Wettre<br />
Konnerth J., Gierlinger N., Keckes J. and Gindl W. (2009): Actual versus apparent within cell wall<br />
variability <strong>of</strong> nanoindentation results from wood cell walls related to cellulose micr<strong>of</strong>ibril angle. J. Mat.<br />
Sci. 44, 4399-4406<br />
160
COST Action E54 Book<br />
Lichtenegger H., Reiterer A., Stanzl-Tschegg S.E. and Fratzl P. (1999): Variation <strong>of</strong> cellulose micr<strong>of</strong>ibril<br />
angles in S<strong>of</strong>twoods and Hardwoods – A Possible strategy <strong>of</strong> mechanical optimization. J. Structural<br />
Biology 128, 257-269<br />
Mark R.E., Habeger Jr C.C., Borch J and Lyne M.B. (2002): Handbook <strong>of</strong> Physical Testing <strong>of</strong> Paper.<br />
ISBN: 0-8247-0498-3. Marcel Dekker, Inc. Vol. 1, Chapter 13 edited by Paavilainen L, Fibre <strong>Structure</strong><br />
pp. 699-720<br />
Mohlin U.B., Dahlbom J. and Hornatowska J. (1996): Fibre deformation and sheet strength. TAPPI<br />
79(6), 105-111<br />
Mott L., Shaler S.M., Groom L.H. and Liang B.H. (1995): The tensile testing <strong>of</strong> individual wood fibres<br />
using ESEM and video image analysis. TAPPI 78(5), 143-148<br />
Nyre�n J. (1971): The transverse compressibility <strong>of</strong> pulp fibres. Tech. Sect., CPPA 72(10), T321-T323<br />
Oliver W.C. and Pharr G.M. (1992): An improved technique for determining hardness and elastic<br />
modulus using load and displacement sensing indentation experiments. J. Mat. Res. 7, 1564-83<br />
Page D.H. and El- Hosseiny F. (1983): The mechanical properties <strong>of</strong> single wood pulp fibres. Part 6.<br />
Fibril angle and the shape <strong>of</strong> the stress-strain curve. J. Pulp Paper Sci., 9, 1-2<br />
Page D.H., El-Hosseiny F. and Winkler K. (1971): Behaviour <strong>of</strong> single wood fibres under axial tensile<br />
strain. Nature 229, 252-253<br />
Pleasants S., Batchelor W. J. and Parker I.H. (1998): Measuring the fibril angle <strong>of</strong> bleached fibres using<br />
micro-Raman Spectroscopy. APPITA 51(5), 373-376<br />
Rabe R., Breguet J-M., Schwaller P., Stauss S., Haug F-J., Patscheider J. and Michler J. (2004):<br />
Observation <strong>of</strong> fracture and plastic deformation during indentation and scratching inside the scanning<br />
electron microscope. Thin Solid Films 469-470, 206-213<br />
Sachs I.B. (1986): Microscopic observations during longitudinal compression loading <strong>of</strong> single pulp<br />
fibres. TAPPI July, 98-102<br />
Spurr A.R. (1969): A low viscosity epoxy resin embedding medium for electron microscope. J. Ultra<br />
Structural Research 26, 31-43<br />
Wu Y., Wang S., Zhou D., Xing C. and Zhang Y. (2009): Use <strong>of</strong> Nanoindentation and Silviscan to<br />
determine the mechanical properties <strong>of</strong> 10 hardwood species. Wood Fibre Sci. 41(1), 64-73<br />
Xing C., Wang S., Pharr G.M. and Groom L.H. (2008): Effect <strong>of</strong> thermo-mechanical refining pressure on<br />
the properties <strong>of</strong> wood fibres as measured by nanoindentation and atomic force microscopy.<br />
Holzforschung 62, 230-236<br />
Zickler G.A., Schöberl T. and Paris O. (2006): Mechanical properties <strong>of</strong> pyrolysed wood: a<br />
nanoindentation study. Phil. Mag. 86(10), 1373-1386<br />
161
COST Action E54 Book<br />
162
COST Action E54 Book<br />
TOWARDS AUTOMATED MANIPULATION AND CHARACTERISATION<br />
OF PAPER-MAKING FIBRES AND ITS COMPONENTS<br />
1 Manuel Mikczinski, 1 Malte Bartenwerfer, 2 Pooya Saketi, 3 Sabine Heinemann, 4 Raphaël Passas,<br />
2 Pasi Kallio and 1 Sergej Fatikow<br />
1 Division Microrobtics and Control Engineering, University <strong>of</strong> Oldenburg, D-26111 Oldenburg,<br />
Germany<br />
Abstract<br />
2 Micro and Nanosystems Research Group, Tampere University <strong>of</strong> Technology,<br />
FI-33101 Tampere, Finland<br />
3 VTT Fibre Processes, Fibre Converting (Espoo), FI-02044 VTT, Finland<br />
4 Grenoble-INP/PAGORA, F-38402 Saint Martin d'Hères, France<br />
Corresponding author: manuel.mikczinski@informatik.uni-oldenburg.de<br />
<strong>Papermaking</strong> has a long history and is dominated by experience. The understanding <strong>of</strong> structure<br />
and ultrastructure and their formation mechanisms is fundamental but far from complete.<br />
Experiments and tests are performed to unveil the ultrastructure and find out more about fibre<br />
properties and the fibre-fibre and fibril-fibre connection establishment during paper-making.<br />
The following pages are dealing with the development and evaluation <strong>of</strong> novel systems and<br />
methodologies addressing this topic. The work was performed in a joint workshop organised<br />
between the University <strong>of</strong> Oldenburg, VTT, Grenoble-INP/PAGORA and Tampere University<br />
<strong>of</strong> Technology. Adopting nanomanipulation techniques used to handle and assemble individual<br />
carbon nano tubes (CNT) is a promising approach. Although organic material behaves<br />
differently than the more organised inorganic structures like CNTs, the existing systems and<br />
techniques are good starting points. Three different systems were used during the workshop at<br />
the University <strong>of</strong> Oldenburg. One <strong>of</strong> these systems was developed from scratch for this<br />
workshop. It is a modular micro/nanomanipulation system <strong>of</strong>fering a high flexibility in<br />
manipulations. After introducing these systems, different manipulation techniques are performed<br />
and presented. The gained experiences were used to perform a number <strong>of</strong> preparing steps and<br />
characterisation experiments which are not yet available in larger scale applications in the<br />
presented resolution, e.g. the compression testing <strong>of</strong> single fibres with force feedback. Also other<br />
techniques as for example focused ion beam cutting and deposition on single fibres were<br />
performed. All presented material was used to evaluate existing systems and to create<br />
recommendations for future systems.<br />
Introduction<br />
Producing different paper is a versatile challenge. Especially printing paper is available in a huge<br />
number <strong>of</strong> different weight classes and qualities. Producing these papers with certain properties<br />
requires a detailed knowledge about the materials and processes. Insight into the paper structure<br />
is <strong>of</strong> major interest to check the obtained results. Several properties need to be controlled to<br />
validate the processing and material. Changes take place not only on sheet level but also on fibre<br />
and fibril level. Data that is gathered in the post-processing state must be compared to data<br />
collected in raw state. Going from the sheet level down to the fibre or even fibril level several<br />
conditions change. Visualisation system, working environment, and manipulation systems will<br />
change due to technical reasons. Visualisation in a scanning electron microscope (SEM) is<br />
163
COST Action E54 Book<br />
already performed to obtain insights into the surface structure <strong>of</strong> fibres or to make fibrils visible,<br />
as seen with Chinga-Carrasco (2010) and Turner and Reynolds (2009). With the SEM the<br />
working environment changes from atmospheric conditions into a chamber with reduced<br />
pressure to enable the use <strong>of</strong> the electron beam. This makes remotely controlled manipulation<br />
systems necessary. The use <strong>of</strong> these micro- or nanomanipulation systems requires in turn new<br />
methodologies but enables also new experiments.<br />
The COST Action E54 was initiated to contribute to the following questions aiming at the<br />
“Characterisation <strong>of</strong> the fine structure <strong>of</strong> papermaking fibres using new technologies”. The main<br />
objective <strong>of</strong> the Action is to generate new knowledge on the micro- and nanostructure <strong>of</strong><br />
papermaking fibres and properties required for the efficient and sustainable use <strong>of</strong> fibres.<br />
Specific attention is paid to the influence <strong>of</strong> the chemical and mechanical pulping processes and<br />
fibre treatment on the fine structure and composition <strong>of</strong> different papermaking fibres.<br />
Single fibre investigations are subject <strong>of</strong> Working Group 2 in this Action, entitled “Treatment<br />
and characterisation <strong>of</strong> individual fibres by microsystem technologies.” The group focuses on<br />
the development <strong>of</strong> new instruments by which individual fibres can be treated and fibre<br />
structures can be investigated at lab scale. Interaction between microsystem technology<br />
developers and paper scientists in Europe providing a good transfer <strong>of</strong> knowledge between those<br />
groups is highly desired and has started within this COST Action. This paper represents one <strong>of</strong><br />
the first results <strong>of</strong> this networking.<br />
Working with Single <strong>Fibres</strong><br />
There are two general processes to get a fibre deliberated from the wood matrix in a tree –<br />
mechanical treatment by grinding or refining (e.g. the TMP process), and chemical treatment<br />
(e.g. cooking). Depending on these processes, the separated fibres have a characteristic<br />
appearance e.g. in the light microscope (Figure 1). In the first case, the wood matrix is broken<br />
down to single particles with minor material loss. Usually yields are 90-95%. The fibres appear<br />
rarely intact, they are mainly broken or their outer layers are partly peeled <strong>of</strong>f (Figure 1a). In the<br />
second case, approx. 50% <strong>of</strong> the wood (lignin and some carbohydrates) is dissolved by<br />
chemicals and removed. The remaining fibres are intact with smooth and close surfaces<br />
(Figure 1b).<br />
The properties <strong>of</strong> such fibres vary considerably with the wood species and growth site. The<br />
wood fibre properties vary also by the growth rate, and the age <strong>of</strong> the wood influence fibre<br />
properties to a large extend. Both the fibre length and the fibre wall thickness increase with<br />
wood age. The juvenile wood fibres are shorter, narrower, and have thinner walls than mature<br />
wood. Typically, the juvenile wood pulps have lower strength properties and higher lightscattering<br />
coefficient as reported by Tyrväinen (1995).<br />
In general a tree <strong>of</strong> a faster growth rate contains more earlywood and more lignin than a slow<br />
grown tree. The growth rate influences the cross-sectional dimensions <strong>of</strong> fibres. Sirviö (2000)<br />
and Sarén et al. (1999) showed that faster growing trees develop thinner walled fibres than<br />
slowly growing trees in average. Micr<strong>of</strong>ibril angle decreases rapidly with the age <strong>of</strong> the tree,<br />
being larger for earlywood than latewood and larger for fast-grown than for slowly grown trees<br />
as reported by Sarén et al. (1999) and Lichtenegger et al. (1999). Vehniäinen (2008) reports that<br />
a fast grown tree <strong>of</strong> the same diameter contains less heartwood compared to a slowly grown tree.<br />
164
COST Action E54 Book<br />
Figure 1. S<strong>of</strong>twood fibres in the light microscope – mechanical pulp (TMP) showing broken fibres and<br />
peeled fibre surfaces with high degree <strong>of</strong> fibrillation (a), and chemical pulp with intact fibres and<br />
untouched surfaces (b). Some weak points (compression areas, dislocations marked with arrows) are<br />
visible (Photos: KCL (today VTT))<br />
Typical fibre characterisation tests provide average values <strong>of</strong> dimensions such as length, width,<br />
and wall thickness computed from 5,000 to 100,000 single fibres using automated fibre<br />
analysers. Of course the parameter distributions are delivered as well, but only little <strong>of</strong> this<br />
information can be traced back to the single fibre. But knowledge about single fibre properties<br />
and behaviour in manufacturing processes is essential for their use in traditional, advanced and<br />
future products, which might not only be paper.<br />
In recent years, it became <strong>of</strong> greater interest to study the basic reactions <strong>of</strong> wood fibres on<br />
process impacts throughout the mechanical pulping process with the aim to understand the<br />
interaction <strong>of</strong> single fibre development and specific energy consumption as seen in Vehniäinen<br />
(2008). Understanding the occurrence and development <strong>of</strong> such morphological features as shown<br />
in Figure 2 would enable e.g. to revise the energy-intensive mechanical pulping process towards<br />
more efficient energy use and higher raw material exploitation.<br />
Chemical pulp fibres are characterised by strong (crystalline), and weak (amorphous) structures<br />
<strong>of</strong> the fibre wall. Those weak structures are called dislocations, which is a structure containing<br />
slip lines and slip planes that are easily seen in polarised light microscopy. Small dislocations<br />
affect fibre flexibility and are not considered detrimental for papermaking. Large dislocations<br />
also give fibre flexibility, but due to the less ordered or more open amorphous cellulose structure<br />
in the dislocations, they can be the target for chemical, mechanical or enzymatic attacks as<br />
reported by Ander et al. (2008). Effects <strong>of</strong> such attacks on single fibres are shown in Figure 3.<br />
To understand, where in a fibre the highest effect occurs and how it develops with certain<br />
treatments is another reason to study single fibres instead <strong>of</strong> collecting average values.<br />
165
COST Action E54 Book<br />
Figure 2. SEM-images <strong>of</strong> s<strong>of</strong>twood mechanical pulp fibres (TMP) – Bands <strong>of</strong> combined middle lamella<br />
and P and S1 layer around long fibres in 3 rd stage pulp (a), split thin-walled earlywood fibre with slit<br />
propagation in the direction <strong>of</strong> fibril angle (b) (Photos KCL (today VTT), scale bar always 10 µm)<br />
Figure 3. SEM-images <strong>of</strong> s<strong>of</strong>twood chemical pulp fibres – Further degradation after HCl attack cleaving<br />
both the S1 and S2 fibre walls (a); and (b) early phase <strong>of</strong> cellulase (0.3 mL Celluclast) action producing<br />
numerous clefts/grooves in the outer fibre wall (black arrows). An artefact crack is shown at the line to<br />
the left (see Ander et al. 2008)<br />
Micro- and Nanorobotics<br />
A variety <strong>of</strong> experimental setups are already developed for manipulation and characterization<br />
task on different materials, with main focus on inorganic materials, though. Depending on the<br />
size <strong>of</strong> the particles and objects, the most common approaches for mechanical characterisation<br />
measurements are the determination <strong>of</strong> elastic forces and <strong>of</strong> thermal vibration frequencies for<br />
micro- and nanoscale-objects, as reported by Poncharal (1999) and Lukic (2005).<br />
The division Microrobtics and Control Engineering developed a setup for characterisation<br />
measurements on CNTs over the past years. The setup consists <strong>of</strong> a coarse and a fine positioning<br />
system allowing realization <strong>of</strong> multistep-based experiments. The setup was used to determine the<br />
Young’s modulus <strong>of</strong> vertical aligned multi walled carbon nanotubes (CNTs) as well as the<br />
conductivity <strong>of</strong> single walled carbon nanotube bundles, as described by Eichhorn (2010, 2010a).<br />
The performed mechanical characterisation measurements were based on the determination <strong>of</strong><br />
the bending stiffness and bending behaviour <strong>of</strong> CNTs.<br />
Due to this basic experience, the system can be adapted for different kinds <strong>of</strong> characterisation<br />
tasks and objects. On the one hand, the requirements on an experimental setup for organic<br />
166
COST Action E54 Book<br />
materials are even higher; on the other hand at least a possible redesign effort is minimized by<br />
the versatility <strong>of</strong> the existing system. Therefore, this is the first system to be adopted and is<br />
described in more detail in the Mechanical Setup section.<br />
Working Environment<br />
The working environment includes the main chamber in which experiments are conducted, the<br />
visualisation system, and the inserted manipulation facilities. Using the scanning electron<br />
microscope (SEM) is a necessity for visualisation at the scale <strong>of</strong> interest.<br />
System Environment<br />
The principle <strong>of</strong> the SEM is to obtain images from the detection <strong>of</strong> secondary or backscattered<br />
electrons. Those are produced during interaction between a focused electron beam and the<br />
material. The electron beam is generated in the column part <strong>of</strong> the SEM and its energy is<br />
controlled by the accelerating voltage parameter. In the column, the pressure should be as low as<br />
possible in order to facilitate extraction <strong>of</strong> the electrons (10 -4 to 10 -10 Pa, respectively for a<br />
tungsten cathode and for a field emission gun). The electron/matter interactions occur in the<br />
microscope chamber and the chamber-pressure is very important on one hand to reduce the<br />
electron beam diffusion and on the other hand to amplify the signal given by the secondary<br />
electrons.<br />
In order to reduce the electrical charging effect <strong>of</strong> the sample, one can choose between three<br />
possibilities. The first one is to prepare the sample by deposition <strong>of</strong> a thin layer <strong>of</strong> conductive<br />
material (carbon, gold, palladium…). The second one is to decrease the electron beam energy<br />
(low accelerating voltage e.g. 1kV) and the last one is to introduce gas (e.g. water vapour) in the<br />
chamber (low vacuum and environmental mode). <strong>Fibres</strong> are living cells and are to be considered<br />
as biological samples. That means that they are sensitive to the energy <strong>of</strong> the electron beam and<br />
they could be hydrated. The advantage <strong>of</strong> the Environmental SEM (ESEM) is to allow the<br />
observation <strong>of</strong> such a sample. In this mode, the pressure in the chamber varies from ca. 130 Pa to<br />
about 2700 Pa. The water phase diagram (Figure 4) shows that if the sample temperature is<br />
controlled, it is possible to keep it hydrated. From a papermaker point <strong>of</strong> view, this is <strong>of</strong> great<br />
interest because it is conceivable to study the fibre deformation (hornification phenomena)<br />
during drying and rewetting cycles.<br />
Two different SEMs were available for the experiments. Low-pressure experiments were<br />
performed in a Quanta 600 <strong>of</strong> FEI, Netherlands, with a tungsten cathode as electron source.<br />
Other experiments were conducted in a LYRA 3 FEG / XMH <strong>of</strong> Tescan, Czech Republic, which<br />
works with a field emission gun and is also equipped with a focused ion beam (FIB) column.<br />
With this microscope, fibres can be visualized at a low accelerating voltage (typically 1.5 kV)<br />
without any sample preparation until a magnification <strong>of</strong> X5,000 times. To achieve high<br />
magnification, specimens are coated with a thin gold layer. This was performed in a Polaron<br />
SC7620 sputter coater. The specimens were coated with the minimal energy and duration <strong>of</strong><br />
approximately 30 seconds.<br />
Both SEMs are used with their original stage and only added manipulator units or systems,<br />
which are described in more detail in the following subsection.<br />
167
Mechanical Setup<br />
COST Action E54 Book<br />
Figure 4. Phase diagram <strong>of</strong> water (1 Torr =<br />
133 Pa, from FEI company)<br />
There are lots <strong>of</strong> restrictions for mechanical positioning and manipulation systems that are used<br />
inside the SEM for micro- and nanomanipulations. For example, they need to be very small,<br />
<strong>of</strong>fer a high repeatable accuracy, and show virtually no drift.<br />
Three systems were developed to work in the SEMs for different purposes. First, there is a<br />
mechanical testing station (I) for direct measurements between two aligned objects. The second<br />
system rebuilds an atomic force microscope (AFM) to be used inside the SEM (II). The<br />
restriction <strong>of</strong> strict tool-specimen alignment is overcome by the third system (III), which is<br />
designed in a more modular fashion. It <strong>of</strong>fers flexible positioning <strong>of</strong> the manipulators relative to<br />
the specimen.<br />
Mechanical testing, like tensile strength, indentation, or compression requires a good alignment<br />
between the tool and the object to be tested. The first setup (I) <strong>of</strong>fers this on a bar-like base<br />
(Figure 5-I). On this base two types <strong>of</strong> positioners are installed for coarse and fine positioning.<br />
Coarse positioning is performed by linear axes by SmarAct GmbH, Germany. These axes are<br />
working with the slip-stick principle and <strong>of</strong>fer a high relative resolution <strong>of</strong> ca. 50 nm along the<br />
complete axis movement. Due to the principle they are fast and <strong>of</strong>fer not only the stepping<br />
movement but also a scanning movement. For fine positioning Physik Instrumente axes with a<br />
stroke <strong>of</strong> ± 100 µm are used from the Hera product line. These are built with flexure hinges and<br />
ensure a frictionless and drift-free movement. A capacitive sensor is used to measure the<br />
movement. The resolution <strong>of</strong> these axes is less than 2 nm, which makes them ideal for high<br />
resolution mechanical testing. The measurement tool is fixed on the coarse positioning side,<br />
whereas the specimen is mounted on the fine positioning side. The specimen can either be<br />
mounted on a flat or an angled stub, as required by the chosen property to be tested. In turn, the<br />
tool or any other end effector needs to be aligned accordingly.<br />
The second setup (II) is already more specialised. To combine the advantages <strong>of</strong> both techniques<br />
this systems represents an atomic force microscope (AFM) inserted in a SEM, see Figure 5-II.<br />
As a commercial AFM is generally designed to move the probe, this setup uses a movable<br />
scanning tip. It consists, as well as the first system, <strong>of</strong> a coarse and a fine positioning unit.<br />
SmarAct axes with a high stiffness are used for positioning the scanning tip on the patch to be<br />
scanned. The scanning motion is performed by means <strong>of</strong> the fine positioning axes by Physik<br />
Instrumente. In this way the region <strong>of</strong> interest stays in sight <strong>of</strong> the SEM view. Additionally, this<br />
setup is capable <strong>of</strong> delivering a force feedback to the operator via a Phantom Desktop haptic<br />
device by SensAble Technologies. But every mode requires some settings that does not allow for<br />
using the modes (AFM and force feedback manipulations) simultaneously.<br />
168
COST Action E54 Book<br />
Figure 5. The mechanical setups used for the experiments. In (I) the coarse positioning axes with the<br />
measurement tool (left) and the fine positioning axes with the sample (right) can be seen. (II) shows the<br />
AFM setup mounted inside the SEM chamber. This time the coarse positioning carries the sample (right)<br />
and the fine positioning moves the tool (left). The third setup can be seen in (III). All tools come from an<br />
outer position and centre around the samples, which can be revolved. In this way any tool can reach any<br />
sample. On the left side a microgripper on its carrier-pcb is facing the second sample in the sample<br />
carousel. From the bottom comes the sharp metal tip in the field <strong>of</strong> view. The angle between the tools can<br />
be adjusted beforehand to ensure a close collaboration on the sample<br />
The third system used is a fully modular positioning and manipulation system (III). Many tasks<br />
in micro- and nanorobotics benefit from two or more endeffectors manipulating the specimens.<br />
This is especially true for organic materials as paper-making fibres. On a round disc-like base<br />
different positioning / manipulation units are mounted. Every module is set into a groove on the<br />
base disc and fixed with setscrews. Due to the angled border <strong>of</strong> the pie piece-like module bases<br />
and the groove in the base-disc every module is clamped and perfectly fixed. By combining the<br />
different modules a large variety <strong>of</strong> manipulations becomes possible. Even different angles<br />
between the tools can be easily achieved due to the round shape. Every module is designed to<br />
take a specific combination <strong>of</strong> positioners, e.g. linear or rotary axes. These multi-degree-<strong>of</strong>freedom<br />
positioners can be equipped with any kind <strong>of</strong> end effector to form a manipulator unit.<br />
Typical end effectors are for example sharp metal tips from tungsten wire (STM-tips), force<br />
sensors, or micro- and nanogrippers.<br />
Automation Approaches<br />
(III) (I)<br />
(II)<br />
Not just in industry but also in research are many processes automated. Many steps in<br />
experiments require a large number <strong>of</strong> specimens to be handled or tested. In some cases this<br />
work causes fatigue and concentration losses with the experimenter. Especially the work with<br />
organic specimen like biological cells is laborious work as reported earlier (Desai et al. 2007).<br />
169
COST Action E54 Book<br />
Automating an experimental setup does not just mean to replace a manual handle with a motor<br />
and program a controller to send a signal to the motor which performs the required movement. It<br />
starts earlier with determining the necessary steps to be performed. Experimental protocols are<br />
the first thing to be examined. From these, the necessary tools can be derived. The next step is<br />
planning the automation system mechanically. After programming the automation sequence in<br />
accordance to the protocols, the automations system needs to be validated. From the information<br />
technology point <strong>of</strong> view, it is beneficial to divide the automation s<strong>of</strong>tware in a low-level and a<br />
high-level control. The low-level control deals with converting control signals into driving<br />
signals <strong>of</strong> e.g. the motors. In the high-level control structure the testing protocol is implemented.<br />
In this way, it is possible to program the protocol without direct knowledge about the specific<br />
driving signals.<br />
However, here the focus is on the mechanical side. What facilities are necessary is determined<br />
by the tests, which should be performed. An automation system could start for example with<br />
separating fibres from pulp samples. Before outlining a mechanical system testing procedures<br />
need to be formulated.<br />
Testing Procedures<br />
Microscopic analysis <strong>of</strong> fibres is very important, as already mentioned above. The visualisation<br />
<strong>of</strong> special features <strong>of</strong> the fibre wall in micro and nano scale has already been well developed, but<br />
the bottleneck <strong>of</strong> all such procedures is the high time demand and the required accuracy for<br />
sample preparation. A large number <strong>of</strong> tests have to be performed to achieve statistical results<br />
due to natural variability (see also section “Working with Single <strong>Fibres</strong>” above). Furthermore, it<br />
is necessary to avoid human artefacts on the analysis in order to have a repeatable method which<br />
could be applicable as a standard. It is also interesting to keep in mind that a paper machine<br />
produces about 1,000 tons <strong>of</strong> paper per day. If some analyses are needed to check the product<br />
quality, a quick measurement is mandatory.<br />
The idea therefore was to study the suitability <strong>of</strong> certain procedures for a fully automated testing<br />
principle on single fibres. Such a method would be interesting both from scientific and from<br />
commercial point <strong>of</strong> view.<br />
As a start-up, three different tasks were performed during the workshop on the single fibre level:<br />
1) Basic fibre manipulations (e.g. gripping or slicing with a metal tip),<br />
2) Fibre compression testing with force measurement, and<br />
3) Charged particle beam manipulations: cross-sectional cutting and depositing metals on the<br />
fibre surface.<br />
Automation System<br />
The first step in individual paper fibre (IPF) characterisation is sample preparation. Wood fibres<br />
are natural fibres and they have high level <strong>of</strong> asymmetry compared to synthetic nanowires, like<br />
CNTs. This asymmetry problem is even worse in case <strong>of</strong> pulp fibres due to damages caused in<br />
pulping process. Combination <strong>of</strong> asymmetry problem and the paper fibre dimensions, tens <strong>of</strong><br />
micrometres in diameter and few millimetres in length, make paper fibres a challenging material<br />
to manipulate on individual cell level.<br />
170
Microgripper<br />
s<br />
Stub<br />
COST Action E54 Book<br />
Probe<br />
Figure 6. Individual paper fibre manipulation platform (IPFMP)<br />
An individual paper fibre manipulation platform (IPFMP) is developed in MST-Group <strong>of</strong><br />
Tampere University <strong>of</strong> Technology. IPFMP is used to manipulate and sort the IPFs to prepare<br />
the samples. IPFMP operates two microgrippers (SmarAct) to grasp the individual paper<br />
fibres (IPFs) and a self-tailored probe to place the IPFs on stubs (SEM sample holder). Figure 6<br />
shows the IPFMP and its components.<br />
The pulp fibre samples are disintegrated in a Petri dish by adding DI-water. Then the IPFs are<br />
placed on rotary table by using a pipette. Carbon pads are placed on the SEM stubs in a V-shape.<br />
This facilitates to match the length <strong>of</strong> the IPF with the gap between the pads. The two<br />
microgrippers are used for picking-up an IPF from the suspension, straighten it and let it dry.<br />
One <strong>of</strong> the microgrippers releases the IPF and the second microgripper is used for carrying the<br />
IPF on the V groove <strong>of</strong> the carbon pads to the place where the gap matches the length <strong>of</strong> the IPF.<br />
Afterwards, the fibres are placed on the carbon pads on each stub either with one-end-fixed<br />
and/or both-ends-fixed configurations. Figure 7 illustrates the schematic fibre placement<br />
configuration on the stubs. A probe is used to place the ends <strong>of</strong> the IPF on the carbon pads.<br />
<strong>Fibres</strong><br />
Carbon Pads<br />
Figure 7. Schematic <strong>of</strong> fibre placement configuration<br />
171
COST Action E54 Book<br />
Two IPFs from each sample are placed with the both-ends-fixed configuration and the other two<br />
are placed with the one-end-fixed configuration on the stubs. Figure 8 shows the IPF placement<br />
configuration; or in other words, boundary conditions <strong>of</strong> the IPFs.<br />
Figure 8. Boundary conditions <strong>of</strong> the IPFs. White arrow: Both-ends-fixed. Black arrow: One-end-fixed.<br />
From top the gas injection system (GIS) can be seen which is used for deposition experiments<br />
The above mentioned process is performed in a tele-operated mode. The sample preparation time<br />
is around 15 min/IPF. But most <strong>of</strong> the time is used to let the fibre dry. Although, preparing less<br />
than 40 samples and characterizing these IPFs does not provide statistically reliable data, the<br />
need for an automated IPF sample preparation platform is obvious. As a sub-system <strong>of</strong> an<br />
automated manipulation and characterisation paper fibre platform, IPFMP provides an<br />
infrastructure for a fully automated IPF sample preparation platform which could prepare stacks<br />
<strong>of</strong> samples for characterisation in adequate time.<br />
The next step in automating fibre testing is the delivery <strong>of</strong> the prepared sample stub in the SEM.<br />
During the workshop this was done manually. But opening and closing the SEM and wait for the<br />
vacuum system to reduce the pressure for one or two samples is far from optimal. This means<br />
either a sample stock must be available inside the SEM or an automated vacuum lock for<br />
samples must be installed.<br />
Subsequently, the testing takes place. Depending on the preferred tests, different testing modules<br />
must be installed. These can either be chosen beforehand or in the best case the automation<br />
system can rearrange the setup according to the operator’s wishes. In the latter case, also the<br />
testing and measurement tools must be palletised.<br />
SEM Experiments and Results<br />
1) Basic Fibre Manipulations<br />
Some basic manipulation techniques like pushing, pulling, gripping, relocating, and fixing a<br />
fibre or its components in a certain place have to be learned. Only with this knowledge an<br />
automation system will work reliable and correctly. During the workshop, manipulations with a<br />
sharp tungsten wire tip, which are normally used for scanning tunnelling microscopy (STM),<br />
were performed. The tip was used to hold a fibre in place by fixing it on the carbon glue pad or<br />
172
COST Action E54 Book<br />
to push fibres over the pad’s surface. By pushing the nanoscale tip through the fibre and moving<br />
it sideways the fibre was sliced. The piece <strong>of</strong> cell wall which was ripped apart stuck to the tip<br />
and could be transferred to other places without losing it. From this point a gripper was used to<br />
grip the free-standing part <strong>of</strong> the cell wall. The biggest problem during these manipulations was<br />
the lack <strong>of</strong> knowledge about the third dimension. It was not clearly visible if the tool was already<br />
in contact with the fibre or not. Due to the material, the fibres were bending downwards without<br />
changing position in the visual plane.<br />
Figure 9. From (a) to (c) a number <strong>of</strong> manipulations can be recognised. (a) shows the penetration <strong>of</strong> the<br />
STM-tip into the fibre wall. The piece <strong>of</strong> fibre cell wall that was ripped <strong>of</strong>f is sticking to the STM-tip (b).<br />
The last picture shows the collaboration <strong>of</strong> two different tools on the same object: a gripper coming from<br />
the left and the STM-tip, which is fixing the fibre wall layer at the carbon pad <strong>of</strong> the SEM stub<br />
2) Fibre Compression Testing<br />
First compression tests support the experimental setup for the mechanical characterisation<br />
(setup I). Figure 10 shows an unrefined paper fibre fixed between two pieces <strong>of</strong> carbon glue<br />
pads, as prepared by the IPFMP. The fibre does not touch the metal surface, is still flexible, and<br />
can be pressed against the surface easily to achieve an actual compression. The metal surface<br />
itself is used to provide a quasi-rigid sample for the sensors calibration, which is needed to<br />
determine the intrinsic stiffness.<br />
173<br />
Figure 10. A COST unrefined paper fibre fixed<br />
between two pieces <strong>of</strong> carbon glue pads. The force<br />
sensor (left side) pushes the fibre to the underlying<br />
metal plane and causes a compression <strong>of</strong> the fibre<br />
subsequently. The fibre has a diameter <strong>of</strong> ca. 23.2<br />
µm, but a non-round cross-section
COST Action E54 Book<br />
Several compressions on different paper fibres were performed, while monitoring displacement<br />
and force. A typical measurement curve is shown in Figure 11. Two distinguishable parts are<br />
observable: a) the low-force region, where the force sensor pushes the fibre towards the surface<br />
and b) the high-force region, where the actual compression is performed.<br />
Loading and unloading curve show hysteresis and a slight different shape; typical for elasticity<br />
measurements. Only the unloading part <strong>of</strong> the curve is taken into account, since this part<br />
contains primarily information <strong>of</strong> the material’s elasticity without being affected by parasitic<br />
forces.<br />
The results <strong>of</strong> the force displacement measurements reveal a non-fatigue-behaviour <strong>of</strong> the fibres<br />
and a stiffness <strong>of</strong> about 2000 N/m. The determination <strong>of</strong> a corresponding material property –e.g.<br />
Young’s modulus- would be interesting, but is possible only with an extensive knowledge <strong>of</strong> the<br />
fibre’s cross-section.<br />
Force/N<br />
12<br />
10<br />
8<br />
6<br />
4<br />
2<br />
x 10 -4<br />
data<br />
excluded data<br />
fitted curve<br />
1 2 3 4 5 6 7<br />
x 10 -6<br />
Displacement/m<br />
Figure 11. Typical force-displacement measurement curve on a paper fibre. Only the first 40% <strong>of</strong> the<br />
unloading curve (black x-markers) were used for the elasticity calculation (black line)<br />
3) Charged Particle Beam Manipulations<br />
Cutting across single free standing fibres with a focused ion beam (FIB) and subsequent<br />
manipulation <strong>of</strong> the cut areas as well as depositing metals, platinum (Pt) and tungsten (W), from<br />
the gaseous phase by ion beam induced deposition (IBiD) are discussed in the following subsection.<br />
Figure 12 shows a series <strong>of</strong> SEM images taken during a cutting sequence. The tests were<br />
performed on single fibres which were not separated before testing as explained above. Air-dried<br />
unrefined s<strong>of</strong>twood chemical pulp from the 2 nd common COST sample, described elsewhere in<br />
this book by Heinemann and Ander (2011) was fixed on the stub and a free-standing fibre loop<br />
was chosen for the test. FIB cutting was applied to all cuts with 630 pA and aperture 6. For the<br />
manipulation <strong>of</strong> cut fibre parts, a piezoresistive AFM cantilever was used with the AFM-in-SEM<br />
system, which is capable <strong>of</strong> manipulations with force feedback. Two neighboured cuts were<br />
performed subsequently (Figure 12a). For cut 1, the total cutting time was calculated with 150<br />
sec. This long time was applied because obviously nothing had happened to the fibre although<br />
the beam was hitting the substrate (white line beneath cut 1 in Figure 12a) The same beam<br />
conditions were applied to cut 2, but already after a few seconds, the fibre moved in cut 1 which<br />
was evidently broken (no continuation in longitudinal fibre orientation, i.e. the left side <strong>of</strong> the<br />
fibre turning a bit upwards). Since the cut piece was still hold onto the fibre, manipulation by the<br />
174
COST Action E54 Book<br />
AFM cantilever should move it apart (Figure 12b). The mechanical action did not succeed, and<br />
another ionic beam, having the same conditions as before, was set to cut 2. Immediately after the<br />
first energy input, the cut fibre part was released at cut 1 and bend down towards the substrate.<br />
The cross-sectional shape <strong>of</strong> the cut fibre became visible for cut 1 (Figure 12c and d). The<br />
magnification <strong>of</strong> the cross-section in Figure 12d explains why so different energy amounts by<br />
time had to be applied to create the cut – the fibre was partly folded (U-shaped), which could not<br />
be seen from above when choosing the cutting position, and the ion beam had to go through the<br />
fibre in principle twice in the folded regions.<br />
Bending down and fibre repelling were observed also for other cut fibre parts and explained by<br />
charging effects.<br />
Figure 12. Cross-cutting <strong>of</strong> a single fibre (s<strong>of</strong>twood chemical pulp unrefined) and manipulation with<br />
AFM cantilever using FIB mode (630 pA, aperture 6). Fibre after two neighboured cuts 1 and 2 (a),<br />
manipulation <strong>of</strong> the cut piece by AFM cantilever (b), breaking <strong>of</strong> cut 1 (c), and magnified cross-section <strong>of</strong><br />
the cut fibre at cut 1 (d)<br />
175
COST Action E54 Book<br />
Figure 13. Deposition experiments using electron and ion beam induced deposition (EBiD/IBiD) with<br />
platinum (Pt) and tungsten (W) on a free standing s<strong>of</strong>twood fibre <strong>of</strong> refined chemical pulp. Fibre surface<br />
before deposition, natural circular features such as closed bordered pits marked with white arrows (a),<br />
results <strong>of</strong> three deposition trials (b): Trial 1: 4-spot grid, radius 1 µm, gap 4 µm, parallel mode (Pt), trial<br />
2: 4-spot grid, radius 0.25 µm, gap 1 µm, serial mode (Pt), trial 3: 9-spot grid, radius 0.25 µm, gap 1<br />
µm, serial mode (W)<br />
Electron or ion beam induced depositions (EBiD resp. IBiD) use the charged particle beam to<br />
decompose precursor molecules which are injected into the vacuum chamber <strong>of</strong> the SEM. Many<br />
precursors are delivered in gaseous state close to the deposition spot by a gas injection system<br />
(GIS). The charged beam cracks the adsorbed precursor molecules and the non-volatile<br />
fragments become a solid deposition. The volatile fragments are pumped away by the vacuum<br />
system. More about the use <strong>of</strong> EBiD and IBiD can be found in Fatikow (2008). The deposition<br />
experiments were performed at refined samples <strong>of</strong> the s<strong>of</strong>twood chemical pulp from the 2 nd<br />
common COST sample, described elsewhere in this book by Heinemann and Ander (2011). A<br />
free-standing single fibre was used, which was prepared as described above (see Figure 8). The<br />
depositions were done with Platinum (Pt) and Tungsten (W) with three different patterns (Figure<br />
13). To separate native circular structures on a dry fibre surface, features such as closed bordered<br />
pits were registered from the fibre before deposition treatment (white arrows in Figure 13a). The<br />
resulting three grid patterns are visible in Figure 13b. Pattern 1 was a 4-spot grid (2x2 matrix)<br />
with a spot radius <strong>of</strong> 1 µm and a gap width <strong>of</strong> 4 µm performed as parallel process with Platinum.<br />
Also pattern 2 was performed with Platinum as a 4-spot grid with a spot radius <strong>of</strong> 0.25 µm and a<br />
gap width <strong>of</strong> 1 µm, but as serial process (spot-by-spot). The serial process was also applied to<br />
pattern 3, which was a 3x3 matrix with the same spot radius and gap width as for pattern 2, but<br />
using a tungsten precursor.<br />
176
Outlook<br />
COST Action E54 Book<br />
The results <strong>of</strong> the first manipulation applications on single fibres in SEM and AFM-in-SEM<br />
techniques were promising and a good start-up for developing a fully automated testing principle<br />
on single fibres.<br />
The combination <strong>of</strong> micro/nano manipulators and the SEM/AFM technology have a high<br />
potential to improve investigations on the morphology <strong>of</strong> fibres and fibrils, e.g. by following<br />
deformations during drying and wetting and thus contributing to hornification tests.<br />
The application <strong>of</strong> the FIB technology will contribute to investigations on structural properties<br />
and on the fine fibre structure e.g. by tests <strong>of</strong> the fibre compressibility or peeling resistance.<br />
Instead <strong>of</strong> simple cross-sectional cutting the surface and fibre-wall ablation by this charged<br />
particle beam needs to be tested, as it could reveal more <strong>of</strong> the inner structure <strong>of</strong> the fibre and<br />
make specific structuring <strong>of</strong> the fibre possible.<br />
Concerning the compression testing the folding <strong>of</strong> the fibres must be known. On the one hand<br />
the presented setup can measure the folding stiffness and on the other hand the compression<br />
stiffness <strong>of</strong> the fibre alone. This folding-problem needs to be taken into account in future setups:<br />
Either another fibre must be chosen or the setup is able to unfold the fibre. With these<br />
modifications the cross-section will be known and a corresponding material property can be<br />
determined.<br />
Future research also has to address the difficulties in manipulating and processing these paper<br />
fibres in three dimensions. A contact detection tool which is sensitive in three dimensions would<br />
ensure safer working with the <strong>of</strong>ten delicate tools made from silicon.<br />
Questions for future research can possibly be answered with micro- and nanorobotic systems.<br />
Some <strong>of</strong> those questions could be for example:<br />
- Single fibre properties such as transversal and cross-sectional dimensions, bendability and<br />
tensile strength including fibre wall structure at the breaking point<br />
- Characterisation <strong>of</strong> bonds between fibres, between fibres and fibrils, and between fibres and<br />
vessels regarding the bonding strength<br />
- Fibre wall delamination, cross-sectional shape and effect on fibre deformation (compression<br />
force)<br />
- Peeling characteristics <strong>of</strong> fibre layers: Removing <strong>of</strong> single fibre wall layers considering the<br />
peeling <strong>of</strong>f force<br />
- Special focus on the nano scale: Bundles <strong>of</strong> fibrils, micr<strong>of</strong>ibrils, nan<strong>of</strong>ibrils.<br />
However, an automated system as outlined in the Automation System-section is not yet realised.<br />
Some <strong>of</strong> the biggest efforts have to be spent on the handling <strong>of</strong> such irregular, naturally grown<br />
structures like paper fibres. But using robotics, that work at the micro and nanoscale, will<br />
certainly <strong>of</strong>fer future-pro<strong>of</strong> solutions.<br />
Acknowledgement<br />
The authors gratefully acknowledge the help and support <strong>of</strong> Uwe Mick while working with the<br />
AFM-in-SEM system.<br />
177
References<br />
COST Action E54 Book<br />
Ander P., Hildén L. and Daniel G. (2008): Cleavage <strong>of</strong> s<strong>of</strong>twood kraft pulp fibers by HCl and<br />
cellulases. BioResources 3(2): 477-490<br />
Chinga-Carrasco G. (2010): Micro- and nanostructures <strong>of</strong> wood pulp fibres. COST Action E54<br />
Workshop, May 10-12, Coimbra, Portugal 2010<br />
Desai J.P., Pillarisetti A. and Brooks A.D. (2007): Engineering Approaches to Biomanipulation.<br />
Anu. Rev. Biomed. Eng. 9:35-53<br />
Eichhorn V., Bartenwerfer M. and Fatikow S. (2010): Nanorobotic Strategy for Nondestructive<br />
Mechanical Characterization <strong>of</strong> Carbon Nanotubes. Bentham J. Micro and Nanosystems 2(1):<br />
32-37<br />
Eichhorn V., Fatikow S., Sukas O. S., Hansen T., Bøggild P. and Occhipinti L. (2010a): Novel<br />
Four-Point-Probe Design and Nanorobotic Dual Endeffector Strategy for Electrical<br />
Characterization <strong>of</strong> As-grown SWCNT-Bundles. In: IEEE International Conference on Robotics<br />
and Automation, Anchorage, Alaska, USA, May 3-8, 2010<br />
Fatikow S. (2008): Automated Nanohandling by Microrobots. Springer-Verlag, London 2008<br />
Heinemann S. and Ander P. (2011): Standard Pulp and Paper Tests, In COST Action E54<br />
“Characterisation <strong>of</strong> the fine structure and properties <strong>of</strong> papermaking fibres using new<br />
technologies”. Eds: Ander P., Bauer W., Heinemann S., Kallio P., Passas R. and Treimanis A.<br />
Swedish University <strong>of</strong> Agricultural Sciences. p. 211-232. ISBN 978-91-576-9007-4<br />
Lichtenegger H., Reiterer A., Tschegg S. and Franzl P. (1999): Variation <strong>of</strong> cellulose micr<strong>of</strong>ibril<br />
angles in s<strong>of</strong>twoods and hardwoods – A possible strategy <strong>of</strong> mechanical optimization. J. Struct.<br />
Biol. 128(3): 257-269<br />
Sarén M.-P., Serimaa R., Andersson S., Paakkari T., Saranpää P. and Pesonen, E. (1999):<br />
Structural variations <strong>of</strong> tracheids in Norway spruce (Picea abies [L.] Karst.). J. Struct. Biol.<br />
128(2): 101-109<br />
Sirviö J. (2000): Variation in tracheid properties <strong>of</strong> Norway spruce. Dissertation. University <strong>of</strong><br />
Helsinki, Department <strong>of</strong> Forest Resource Management. Helsinki, Finland: Yliopistopaino,<br />
Publications 25, 35 p.<br />
Turner P. and Reynolds A. (2009): New insights into the cellulose micro-fibril structure <strong>of</strong> the<br />
wood cell wall. COST Action E54 Workshop, May 4-6, Tampere, Finland, 2009<br />
Tyrväinen J. (1995): The influence <strong>of</strong> wood properties on the quality <strong>of</strong> TMP made from<br />
Norway spruce (Picea abies) wood from old growth forests, first thinnings and sawmill chips. In:<br />
1995 Int. Mech. Pulping Conf, Ottawa, Canada, 12-15 June 1995. Montreal, Canada: CPPA,<br />
Proceedings, p. 23<br />
Vehniäinen A. (2008): Single fiber properties – a key to the characteristic defibration patterns<br />
from wood to paper fibers. Dissertation. Helsinki University <strong>of</strong> Technology, Department <strong>of</strong><br />
Forest Products Technology. Espoo, Finland: KCL Communications 12, 95 p.<br />
178
Abstract<br />
COST Action E54 Book<br />
FIBER CROSS SECTION PROPERTIES ESTIMATED WITH<br />
AN AUTOMATED SERIAL SECTIONING TECHNIQUE<br />
1 Johannes Kritzinger, 2 Michael Donoser, 1 Ulrich Hirn and 1 Wolfgang Bauer<br />
1 Institute for Paper, Pulp and Fiber Technology, Graz University <strong>of</strong> Technology<br />
Research Studio Austria µSTRUCSCOP<br />
Kopernikusgasse 24/II, 8010 Graz, Austria<br />
2 Institute for Computer Graphics and Vision, Graz University <strong>of</strong> Technology<br />
{johannes.kritzinger, michael.donoser, ulrich.hirn, wolfgang.bauer}@tugraz.at<br />
An accurate analysis <strong>of</strong> pulp fiber cross section properties in the dry state is commonly<br />
performed based on images obtained with scanning electron microscopy (SEM) or confocal laser<br />
scanning microscopy (CLSM). Sample preparation and digitization is a time consuming process<br />
for both techniques, especially if a reasonable number <strong>of</strong> fiber cross sections has to be analyzed.<br />
This paper introduces an automated serial sectioning technique and newly developed image<br />
analysis algorithms for the analysis <strong>of</strong> fiber cross section properties in a sheet <strong>of</strong> paper. A 3D<br />
data set, consisting <strong>of</strong> consecutive cross sections, allows the analysis <strong>of</strong> several thousand fiber<br />
cross sections within reasonable time. This technique was used to study the effect <strong>of</strong> beating in a<br />
PFI mill on fiber cross section properties. An increase in fiber collapse as well as a decrease in<br />
the fiber wall thickness was observed.<br />
Introduction<br />
The paper network is composed <strong>of</strong> individual fibers which highly vary in their shapes and<br />
dimensions. These variations can attributed to two major sources. The first source is the<br />
variation <strong>of</strong> fiber dimensions within the same kind <strong>of</strong> wood species, due to e.g. growing<br />
conditions, location in the stem or location in annual ring (earlywood vs. latewood). The second<br />
source <strong>of</strong> variations originates from the wood species used. S<strong>of</strong>twoods are almost fully<br />
composed <strong>of</strong> tubular tracheids with an average length <strong>of</strong> 2 to 3 mm and a width <strong>of</strong> 20 to 35 µm.<br />
Hardwoods are made up from very thin walled vessel cells and tracheids which are significantly<br />
smaller than those in s<strong>of</strong>twoods.<br />
Measurement <strong>of</strong> longitudinal properties like the fiber length, kink and curl is well established<br />
and usually performed in flow cells, i.e. in the wet state (e.g. Turunen et al. 2005; Hirn and<br />
Bauer 2006). Some <strong>of</strong> these flow cell based devices also characterize average wet state fiber<br />
cross section properties as e.g. fiber wall thickness, however at a rather low level <strong>of</strong> resolution.<br />
Exact analysis <strong>of</strong> fiber cross section properties requires significantly higher resolution and thus<br />
more sophisticated measuring techniques. In fact, there is currently no measurement equipment<br />
available which is able to determine fiber cross section properties at high resolution in a<br />
statistically reasonable manner and within a reasonable time. Several approaches have been<br />
suggested since fiber cross section properties have crucial effects on paper quality. Mechanical<br />
properties <strong>of</strong> single fibers like fiber strength are affected by changes in the cross section<br />
dimensions (Hartler and Nyrén 1970). Cracks in the fiber wall can cause changes in the<br />
scattering coefficient or surface smoothness in the final sheet (Nesbakk et al. 2001). Thin walled<br />
fibers collapse easier than thick walled ones and these collapsed fibers are more flexible and<br />
form denser fiber networks (Jang and Seth 1998; Gregersen and Niskanen 1999). This again has<br />
179
COST Action E54 Book<br />
an impact on the final paper in terms <strong>of</strong> higher paper strength, a lower paper thickness and<br />
increased paper smoothness (e.g. Dinwoodie 1965; Oluwafemi and Sotannde 2007).<br />
CLSM<br />
(Batchelor et al. 2006)<br />
SEM<br />
(Chinga et al. 2007)<br />
X-ray tomography<br />
(Antoine et al. 2002)<br />
Figure 1. Paper cross section used for the analysis <strong>of</strong> fiber cross section properties obtained with<br />
different digitization techniques<br />
A typical analysis routine <strong>of</strong> fiber cross section properties consists <strong>of</strong> three steps: digitization <strong>of</strong><br />
fiber cross sections – detection and segmentation <strong>of</strong> fiber cross sections – measurement <strong>of</strong> fiber<br />
cross section properties. The first step is very important since image quality and image contrast<br />
are the determining factors for the later steps. Different techniques are used for the digitization<br />
<strong>of</strong> fiber cross sections; scanning electron microscopy (SEM) and confocal laser scanning<br />
microscopy (CLSM) are the most common techniques, X-ray tomography (µCT) is an emerging<br />
technique within the last decade. Exemplary images obtained by the various methods are shown<br />
in Figure 1.<br />
The optical sectioning capability <strong>of</strong> CLSM is used to produce 3D datasets <strong>of</strong> the sample to be<br />
analyzed. Fiber cross section analysis is performed in two different ways, optical sectioning<br />
through the fiber thickness <strong>of</strong> individual fibers mounted on a microscope slide (Ho et al. 1991;<br />
Jang et al. 1992) and digitization <strong>of</strong> prepared paper cross sections (Dickson 2000a; He et al.<br />
2003a). The latter technique again can be divided into digitization <strong>of</strong> paper cross sections at a<br />
small depth range (Dickson 2000a; b) and at significantly different depth from 0 to 10 µm (He et<br />
al. 2003a; b). In general, the use <strong>of</strong> CLSM is limited because <strong>of</strong> two reasons; a rapid diminishing<br />
<strong>of</strong> the signal intensity with increasing depth <strong>of</strong> the vocal plane and the need <strong>of</strong> a fluorescent dye<br />
because <strong>of</strong> the weak auto fluorescence <strong>of</strong> fibers used in paper making. Another problem for both<br />
techniques is that touching fibers cannot be separated because there are just weak boundaries<br />
visible in the grey scale images.<br />
Scanning electron microscopy (SEM) in backscatter mode is used because <strong>of</strong> the very high<br />
resolution achievable and the high contrast between embedding medium and fibrous materials,<br />
see Figure 1 (b). The common way in the analysis <strong>of</strong> fiber cross section properties with SEM is<br />
the use <strong>of</strong> individual cross sections (e.g. Reme and Helle 2001; Reme et al. 2002; Nesbakk and<br />
Helle 2002; Chinga-Carrasco et al. 2009). The fibers have to be orientated perpendicular to the<br />
image plane. Therefore different preparation steps are necessary. Image analysis is difficult as<br />
with CLSM, because touching fibers again do not show a visible borderline. There are also some<br />
attempts to analyze fiber cross section properties from 3D data sets obtained with SEM.<br />
Different approaches like serial grinding (Chinga et al. 2004) or also serial sectioning (Aronsson<br />
et al. 2002) are used but the time involved is very high in both cases.<br />
180
COST Action E54 Book<br />
X-ray tomography is a non destructive technique capable for the analysis <strong>of</strong> fiber cross section<br />
properties. Synchrotron radiation based digitization yields in acceptable image quality (e.g.<br />
Antoine et al. 2002; Rolland du Roscoat et al. 2005), see Figure 1 (c), without the need <strong>of</strong><br />
contrast material or embedding <strong>of</strong> the sample. Again, only grey scale images are obtained and<br />
thus there is also a lack in image analysis in the case <strong>of</strong> touching fibers.<br />
Serial sectioning in principle fulfills the basic requirements for a digitization system in fiber<br />
cross section analysis; a high resolution combined with sufficient image quality, digitization <strong>of</strong> a<br />
large sample within a reasonable time and the capability to digitize fibers in a sheet <strong>of</strong> paper.<br />
This paper describes the use <strong>of</strong> an automated serial sectioning combined with light microscopy<br />
and newly developed image analysis routines for the analysis <strong>of</strong> fiber cross section properties.<br />
The technique is used to show the effect <strong>of</strong> beating in a PFI mill on fiber cross section<br />
properties.<br />
Materials and methods<br />
As with other techniques, our method to analyze fiber cross section dimensions consists <strong>of</strong> three<br />
subsequent steps. First, the 3D structure <strong>of</strong> a paper sample is digitized at high resolution using<br />
the automated serial sectioning technique. Second, newly developed image analysis algorithms<br />
are used to detect individual fibers. And third, several properties <strong>of</strong> the fiber cross sections are<br />
evaluated.<br />
Automated serial sectioning<br />
(a) Schematic diagram <strong>of</strong> the prototype built (b) Photograph <strong>of</strong> the prototype built<br />
Figure 2. Layout <strong>of</strong> the prototype built; (a) shows a schematic diagram indicating the major components<br />
and directions <strong>of</strong> motion and (b) depicts a photograph <strong>of</strong> the prototype built<br />
The digitization concept has already been introduced by Wiltsche et al. (2005). This concept<br />
combines automated microtomy and light optical microscopy, see Figure 2 (a) and (b). The<br />
microtome cuts <strong>of</strong>f thin slices from a resin embedded paper sample. After each cut the surface <strong>of</strong><br />
the block is scanned with a microscope mounted on a moveable stage in front <strong>of</strong> the microtome.<br />
Slicing and imaging are fully automated and a 3D digital representation <strong>of</strong> the analyzed paper<br />
sample is obtained. Fiber cross section analysis is performed at a resolution <strong>of</strong> 0.6 µm and at a<br />
cut thickness between 1 and 3 µm. The time needed for a slicing and imaging <strong>of</strong> a typical cross<br />
section is about 1 minute. A small cut out <strong>of</strong> a digitized paper sample is shown in Figure 3,<br />
representing a low weight coated (LWC) paper. The spatial distribution <strong>of</strong> the coating layer as<br />
well as changes in the cross sectional appearance <strong>of</strong> some fibers is already visible in this small<br />
cut out.<br />
181
COST Action E54 Book<br />
Figure 3. Cutout <strong>of</strong> a 3D dataset obtained with the automated serial sectioning technique. Several<br />
structural features, like the coating layers or fiber cross sections are visible in this image<br />
The digitized 3D paper structure data sets can then be analyzed with a novel semi-automatic<br />
image analysis routine which allows the tracking <strong>of</strong> individual fibers through the entire image<br />
sequence.<br />
Image analysis<br />
A tracking algorithm was developed which segments individual fiber cross sections only based<br />
on the boundary image contrast which is clearly visible in Figure 5 (a). Tracking <strong>of</strong> fiber cross<br />
sections is formulated in a probabilistic framework to improve robustness. Maximally Stable<br />
Extremal Regions (MSERs) are used to obtain accurate fiber segmentations in every frame. The<br />
concept is explained in detail in Donoser et al. (2008). The detection <strong>of</strong> individual fiber cross<br />
sections is still a major research topic.<br />
The tracking <strong>of</strong> fibers is initiated with manually segmented fiber cross sections in a first frame.<br />
This manual segmentation may cause a selection <strong>of</strong> some specific classes <strong>of</strong> fiber cross sections<br />
which has to be considered in the interpretation <strong>of</strong> the results.<br />
The result <strong>of</strong> tracking is a sequence <strong>of</strong> so-called label images, where the segmentations <strong>of</strong> the<br />
cross sections <strong>of</strong> each fiber are identified by a unique ID. Figure 5 (b) shows obtained results<br />
where each ID is shown in a distinct color. Please note, that this allows direct access to each<br />
individual fiber which makes an independent analysis <strong>of</strong> all segmented fibers possible.<br />
Evaluation <strong>of</strong> fiber cross section properties<br />
This brief outline is based on Kritzinger et al. (2008; 2009). A very important step in the analysis<br />
<strong>of</strong> fiber cross section properties from 3D image data sets <strong>of</strong> actual paper samples is the<br />
calculation <strong>of</strong> a true fiber cross section. Since fibers are usually not oriented perpendicular to the<br />
cut plane, the dimensions <strong>of</strong> the measured cross sections in the images are overrated compared to<br />
182
COST Action E54 Book<br />
their real sizes. By allowing access to a sequence <strong>of</strong> cross sections our method enables us to<br />
correct this overrating. The change <strong>of</strong> the cross section location <strong>of</strong> a fiber in the fiber network is<br />
estimated based on the fiber centroid coordinates. The trend <strong>of</strong> this centroid coordinates is<br />
calculated using a polynomial fit. The local slope <strong>of</strong> this fit is used as a measure to transform the<br />
measured cross section to the true sized one.<br />
Figure 4. Fiber cross section properties extracted from resized cross sections<br />
The transformed cross sections are then analyzed concerning fiber wall area, lumen area, fiber<br />
perimeter, fiber width and fiber thickness as well as fiber wall thickness, as illustrated in Figure<br />
4. Furthermore the fiber cross sections are classified into three groups, collapsed fibers, fibers<br />
with visible lumen and fibers with a broken fiber wall. The calculation <strong>of</strong> distributions <strong>of</strong> single<br />
properties as well as correlations between the properties <strong>of</strong> the fiber cross sections like the fill<br />
factor (ratio between fiber wall area and the total area <strong>of</strong> the cross section – wall area and lumen<br />
area) completes the analysis routines. New approaches are developed to analyze changes <strong>of</strong> cross<br />
sectional properties along the fiber main axis.<br />
Results and Discussion<br />
The capability to analyze fiber cross section properties with an automated serial sectioning<br />
technique is shown in the following. The first example shows the effect <strong>of</strong> beating in a PFI-mill<br />
on fiber cross section properties. The second example shows some limitations <strong>of</strong> the automated<br />
serial sectioning technique. The last example is an outlook on future work in the field <strong>of</strong> fiber<br />
morphology.<br />
(a) Paper cross sections with one fiber highlighted (b) Label image (different sample) with extracted<br />
fiber cross sections along image sequence<br />
Figure 5. Detection <strong>of</strong> fiber cross sections in paper cross sections<br />
183
COST Action E54 Book<br />
(a) Unbeaten pulp (b) 6 000 rev. in PFI-mill<br />
Figure 6. Effect <strong>of</strong> beating on fiber wall thickness distribution and fraction <strong>of</strong> collapsed fibers. The mean<br />
wall thicknesses and standard deviations <strong>of</strong> the corresponding distributions are given for the three<br />
different classes <strong>of</strong> fiber cross sections<br />
(a) Unbeaten pulp (b) 6000 rev. in PFI-mill<br />
Figure 7. Effect <strong>of</strong> beating on the correlation <strong>of</strong> fiber thickness and fiber width<br />
Effect <strong>of</strong> beating on fiber wall thickness<br />
A flash dried bleached s<strong>of</strong>twood (spruce) kraft pulp was used to analyze the effect <strong>of</strong> laboratory<br />
beating in a PFI-mill on fiber cross section properties. Three beating levels have been analyzed;<br />
unbeaten, 2 000 and 6 000 revolutions in the PFI mill. Small cutouts <strong>of</strong> typical cross sections <strong>of</strong><br />
standard hand sheets (Rapid Koethen method) made from the pulps are presented in Figure 8, (a)<br />
for the unbeaten pulp and (b) for the pulp after 6 000 revolutions in the PFI-mill.<br />
184
COST Action E54 Book<br />
(a) Unbeaten pulp (b) 6000 rev. in PFI-mill<br />
Figure 8. Effect <strong>of</strong> beating on fiber cross sections prepared in hand sheets<br />
Several effects <strong>of</strong> beating on fiber and paper structures can already be seen in these images. The<br />
unbeaten pulp contains a fraction <strong>of</strong> fibers with visible lumen and the fibers are strongly<br />
deformed in many cases. The paper structure appears very porous. Beating leads to several<br />
changes in the structures. The fibers after beating are almost fully collapsed. The increased<br />
flexibility <strong>of</strong> the fibers is obvious because <strong>of</strong> the denser network respectively the lower void<br />
volume between the individual fibers. The higher network strength achieved in beating can be<br />
imagined because <strong>of</strong> the apparently larger contact areas between the fibers.<br />
Several subsequent cross sections with a length <strong>of</strong> more than 2 mm have been digitized. The<br />
distance between the cross sections was set to 1 µm. An average <strong>of</strong> 2 000 fiber cross sections has<br />
been analyzed in each case. The most important results obtained in fiber cross section analysis<br />
are summarized in Table 1. Fiber wall area and fiber wall thickness are significantly reduced in<br />
the beating process. The actual reasons for this effect have not been found so far, however there<br />
might be some peeling <strong>of</strong> outer layers at the fiber wall or a compression <strong>of</strong> the fiber wall. The<br />
fiber width, the major length <strong>of</strong> a fiber cross section, is slightly increased, whereas the fiber<br />
thickness is decreased significantly. This is an indication for strong fiber collapse during beating.<br />
The fiber perimeter is not affected by different beating levels. The fill factor confirms the<br />
observations made in Figure 8. This value is always close to one which indicates strongly<br />
collapsed cross sections at all beating levels. The fraction <strong>of</strong> fibers with a visible lumen is<br />
decreased during beating from about 11% in the unbeaten pulp to approximately 2% after 6 000<br />
revolutions in the PFI mill. To the same extent, the fraction <strong>of</strong> collapsed fibers increases. The<br />
fraction <strong>of</strong> fibers with a broken fiber wall is hardly affected during beating in a PFI-mill.<br />
A more detailed analysis <strong>of</strong> fiber wall thickness data is presented in Figure 6, showing the wall<br />
thickness distribution for (a) the unbeaten pulp and (b) the pulp after 6 000 revolutions in the<br />
PFI-mill. The bars are split into fractions <strong>of</strong> fibers with visible lumen (blue part), fibers with<br />
collapsed lumen (green part) and fibers with a broken fiber wall (red part). As has been already<br />
discussed, the fraction <strong>of</strong> fibers with visible lumen is strongly decreased after beating in the PFImill.<br />
The fiber wall thickness seems to be an influencing parameter on the resistance <strong>of</strong> fiber<br />
collapse. As can be seen in the mean values collapsed fibers tend to have a thinner fiber wall<br />
185
COST Action E54 Book<br />
than the fibers with a visible lumen. The mean values also indicate that the decrease <strong>of</strong> the fiber<br />
wall thickness during beating is more pronounced for fibers with visible lumen and fibers with a<br />
broken wall than for already collapsed fibers.<br />
Table 1. Effect <strong>of</strong> beating with a PFI-mill on fiber cross section properties obtained with automated<br />
serial sectioning and image analysis)<br />
Cross section property Unbeaten pulp 2 000 rev.<br />
6 000 rev.<br />
in PFI-mill in PFI-mill<br />
# Fiber cross sections ~1 900 ~2 100 ~2 100<br />
Fiber wall area [µm²] 170.2 ± 3.2 150.1 ± 3.0 142.8 ± 2.7<br />
Fiber wall thickness [µm] 3.25 ± 0.06 2.75 ± 0.05 2.66 ± 0.05<br />
Fiber width [µm] 28.58 ± 0.49 31.26 ± 0.54 30.84 ± 0.52<br />
Fiber thickness [µm] 9.01 ± 0.14 7.28 ± 0.12 6.97 ± 0.12<br />
Fiber perimeter [mm] 69.17 ± 0.99 69.42 ± 0.98 67.95 ± 0.93<br />
Fill factor [ ] 0.990 0.997 0.997<br />
Visible lumen [%] 10.90 4.14 1.83<br />
Collapsed lumen [%] 87.32 93.93 96.20<br />
Broken fiber wall [%] 1.78 1.96 1.97<br />
Figure 9. Correlation <strong>of</strong> fiber wall thickness (serial sectioning) and coarseness (kajaani FS-200). A<br />
strong correlation between the two different measuring techniques can be found<br />
Figure 7 shows the correlation between fiber thickness and fiber width, (a) for the unbeaten pulp<br />
sample and (b) for the pulp after 6 000 revolutions in the PFI-mill. Values for the fiber width are<br />
considerably larger than for the fiber thickness. This indicates a strong deformation from a<br />
roundish like to a flattened cross section. Beating again shows some effects. The fiber thickness<br />
values are more concentrated below 10 µm, whereas the fiber width is hardly affected as was<br />
already summarized in Table 1.<br />
A validation <strong>of</strong> the results obtained with the novel technique is presented in Figure 9, where a<br />
correlation <strong>of</strong> the fiber wall area obtained in the dry state with the serial sectioning technique and<br />
the coarseness measured with a kajaani FS200 in the wet state is shown. The fiber wall area as a<br />
measure for the fiber volume is thought to influence the coarseness <strong>of</strong> a pulp which can be<br />
interpreted as another method to measure the fiber volume. The data show a strong correlation, a<br />
decrease in the fiber wall area corresponds to a decrease in the coarseness. This can be seen as<br />
pro<strong>of</strong>, since two completely different measuring systems show a similar trend <strong>of</strong> the properties<br />
investigated.<br />
186
COST Action E54 Book<br />
Fiber cross section analysis in mechanical pulp<br />
As with other techniques, the automated serial sectioning technique has also its limitations in the<br />
analysis <strong>of</strong> fiber cross section properties. As can be seen in Figure 10, there are some pulp<br />
grades, where almost no fiber cross sections can be detected. These samples are cross sections <strong>of</strong><br />
hand sheets from different mechanical pulps, (a) stone ground wood – SGW, (b) pressure ground<br />
wood – PGW and (c) thermo mechanical pulp – TMP. The main structures in these images result<br />
from fines and parts <strong>of</strong> the fiber wall.<br />
(a) SGW (b) PGW (c) TMP<br />
Figure 10. Cross sections <strong>of</strong> different mechanical pulp grades obtained with the automated serial<br />
sectioning technique<br />
Other research groups concentrate on the analysis <strong>of</strong> fiber cross section properties in mechanical<br />
pulps (e.g. Reme et al. 2002). The fraction <strong>of</strong> fibers with a broken fiber wall and the degree <strong>of</strong><br />
collapse are important characteristic measures for these pulps. The analysis in this case is usually<br />
limited to fractions <strong>of</strong> the different fiber classes which are typically obtained with Bauer-McNett<br />
fractionation. This seems to be the preparation method <strong>of</strong> choice in this case. A total,<br />
representative analysis <strong>of</strong> fiber cross section properties however is not possible anymore.<br />
Change <strong>of</strong> cross section properties along fiber main axis<br />
Also the variance <strong>of</strong> cross section properties along the fiber main axis is a question <strong>of</strong> interest.<br />
As an example Figure 11 shows 10 subsequent cross sections <strong>of</strong> a hand sheet made from spruce<br />
kraft pulp. The distance between each frame is 6 µm. Two fibers are outlined, one black and the<br />
other one white. The white fiber collapses and decollapses within the image sequence over a<br />
distance <strong>of</strong> just 60 µm. Apart from the rapid changes in fiber collapse the values measured for<br />
fiber wall properties are varying strongly within this small distance. Fiber wall thickness varies<br />
20-30%, fiber wall area varies 10-25% and fiber perimeter varies around 15%.<br />
Similar results have been reported by Bardage et al. (2002) and due to the new method<br />
developed, are now easy to access giving the basis for further discussion.<br />
187
COST Action E54 Book<br />
Figure 11. Changes <strong>of</strong> cross sectional shape along the image sequence. Collapse and decollapse <strong>of</strong> a<br />
cross section during passing another fiber.<br />
Table 2. Changes <strong>of</strong> chosen cross sectional properties along the image sequence presented in Figure 11.<br />
Frame #1 and Frame #10 cannot be evaluated because <strong>of</strong> a lack <strong>of</strong> information for the currently used<br />
cross section resizing routine<br />
Frame # 2 3 4 5 6 7 8 9<br />
Fiber wall thickness [µm]<br />
Black fiber 4.88 4.96 4.83 4.61 4.37 4.42 4.10 4.38<br />
White Fiber 2.82 2.99 3.30 3.36 3.41 3.60 3.70 3.71<br />
Fiber wall area [µm²]<br />
Black fiber 343 337 332 336 321 339 305 346<br />
White fiber 103 103 106 105 108 119 122 123<br />
Fiber perimeter [µm]<br />
Black fiber 96 99 100 104 102 106 100 112<br />
White fiber 52 50 48 47 45 49 49 47<br />
Conclusions and Outlook<br />
The combination <strong>of</strong> a microtome, light optical microscopy and proper image analysis is capable<br />
to analyze fiber cross section properties in a sheet <strong>of</strong> paper. Compared to other techniques, serial<br />
sectioning is able to access a reasonable number <strong>of</strong> fiber cross sections within a short period <strong>of</strong><br />
time and a sufficient image quality. The image analysis routines are in principle able to handle<br />
thousands <strong>of</strong> cross sections that have to be evaluated to obtain statistically significant results.<br />
Further improvements <strong>of</strong> image analysis routines are however still necessary to minimize the<br />
necessary user interactions and the time needed for analysis.<br />
The effect <strong>of</strong> beating on fiber cross section properties was shown in the first experiments. A<br />
noticeable decrease <strong>of</strong> fiber wall area and fiber wall thickness was found at increased beating<br />
levels. The fraction <strong>of</strong> fibers with a visible lumen was found to be decreased from about 11% for<br />
the unbeaten pulp to about 2% for the pulp after 6 000 revolutions in the PFI-mill. The fiber<br />
width was almost unaffected, whereas the fiber thickness decreased during beating.<br />
A promising approach is the possibility to extract data about changes in cross section<br />
morphology within individual pulp fibers. Measurement <strong>of</strong> dimensional variations within fibers<br />
is important since these have a large impact on fiber flexibility, strength and conformability. A<br />
novel field in fiber morphology research can be opened with this technique.<br />
188
Acknowledgement<br />
COST Action E54 Book<br />
The authors gratefully acknowledge the funding by the BMWFJ - Federal Ministry <strong>of</strong> Economy,<br />
Family and Youth <strong>of</strong> the Republic <strong>of</strong> Austria - and by the FFG - Austrian Research Promotion<br />
Agency - under the program line “Research Studios Austria”.<br />
References<br />
Antoine C., Nygard P., Gregersen Ö.W., Holmstad R., Weitkamp T. and Rau C. (2002): 3D images <strong>of</strong><br />
paper obtained by phase-contrast X-ray microtomography: image quality and binarisation. Nucl. Instrum.<br />
Methods Phys. Res. Sect. B-Beam Interact. Mater. Atoms 490, 392-402<br />
Aronsson M., Henningsson, O. and Sävborg Ö. (2002): Slice-based Digital Volume Assembly <strong>of</strong> a Small<br />
Paper Sample. Nord. Pulp Paper Res. J. 17(1), 29-33<br />
Bardage S.L., Daniel G. and Singh A. (2002): Three-Dimensional Analysis <strong>of</strong> the Collapse Behavior <strong>of</strong><br />
Kraft-Cooked Norway Spruce Fibers. Wood Fiber Sci. 34(3), 382-390<br />
Batchelor W.J., He J. and Sampson W.W. (2006): Inter-fibre contacts in random fibrous materials:<br />
experimental verification <strong>of</strong> theoretical dependence on porosity and fibre width. J. Mater. Sci. 41, 8377-<br />
8381<br />
Chinga G., Johnsen P.O. and Diserud O. (2004): Controlled serial grinding for high-resolution threedimensional<br />
reconstruction. J. Microsc.-Oxf. 214(1), 13-21<br />
Chinga G. Solheim O. and Mörseburg K. (2007): Cross-sectional dimensions <strong>of</strong> fiber and pore networks<br />
based on Euclidean distance maps. Nord. Pulp Paper Res. J. 22(4), 500-507<br />
Chinga-Carrasco G., Lenes M., Johnsen P.O. and Hult E.-L. (2009): Computer-assisted scanning electron<br />
microscopy <strong>of</strong> wood pulp fibres: Dimensions and spatial distribution in a polypropylene composite.<br />
Micron 40(7), 761-768<br />
Dickson A.R. (2000a): Quantitative analysis <strong>of</strong> paper cross-sections. Appita J. 53(5), 292-295<br />
Dickson A.R. (2000b): The quantitative microscopic analysis <strong>of</strong> paper cross-sections: sample preparation<br />
effects. Appita J. 53(5), 362-366<br />
Dinwoodie J.M. (1965): The relationship between fiber morphology and paper properties: A review <strong>of</strong><br />
literature. Tappi J. 48(8), 440-447<br />
Donoser M., Kritzinger J., Mauthner T. and Bisch<strong>of</strong> H. (2008): A probabilistic approach for tracking<br />
fibers. Proc. 19th International Conference on Pattern Recognition (ICPR), Tampa, Florida, December<br />
2008. ISBN 978-1-4244-2175-6<br />
Gregersen Ø.W. and Niskanen K. (1999): Measurement and simulation <strong>of</strong> paper 3D-structure. Proc.<br />
COST E11 meeting, 1999<br />
Hartler N. and Nyrén J. (1970): Transverse Compressibility <strong>of</strong> Pulp Fibers II. Influence <strong>of</strong> Cooking<br />
Method, Yield, Beating, and Drying. Tappi J. 53(5), 820-823<br />
He J., Batchelor W.J., Markowski R. and Johnston R.E. (2003a): A new approach for quantitative<br />
analysis <strong>of</strong> paper structure at the fibre level. Appita J. 56(5), 366-370<br />
He J., Batchelor W.J. and Johnston R.E. (2003b): The behavior <strong>of</strong> fibers in wet pressing. Tappi J. 2(12),<br />
27-31<br />
Hirn U. and Bauer W. (2006): A review <strong>of</strong> image analysis based methods to evaluated fiber properties.<br />
Lenzinger Berichte 86, 96-105<br />
189
COST Action E54 Book<br />
Ho F.J., Robertson A.G. and Seth R.S. (1991): Optical sectioning <strong>of</strong> pulp fibers using confocal scanning<br />
laser microscopy. Tappi J. 74(10), 217-219<br />
Jang H.F., Robertson A.G. and Seth R.S. (1992): Transverse dimensions <strong>of</strong> wood pulp fibres by confocal<br />
laser scanning microscopy and image analysis. J. Mater. Sci. 27, 6391-6400<br />
Jang H.F. and Seth R.S. (1998): Using confocal microscopy to characterize the collapse behavior <strong>of</strong><br />
fibers. Tappi J. 81(5): 167-174<br />
Kritzinger J., Donoser M., Wiltsche M. and Bauer W. (2008): Examination <strong>of</strong> fiber transverse properties<br />
based on a serial sectioning technique. Proc. Progress in Paper Physics Seminar 2008, Helsinki, Finland,<br />
June 2008. ISBN 978-951-22-9391-9, pp. 157-160<br />
Kritzinger J., Donoser M. and Bauer, W. (2009): Estimation <strong>of</strong> fiber cross section properties from image<br />
data obtained by a serial sectioning technique. Proc. COST E54 meeting Tampere, Finland, May 2008.<br />
pp. 63-65<br />
Nesbakk T., Mörseburg K. and Helle T. (2001): Relationship between fibre properties and cross sectional<br />
paper characteristics <strong>of</strong> mechanical pulp handsheets. Proc. 3rd Biennial Gullichsen Coll. 2001<br />
Nesbakk T. and Helle T. (2002): The influence on the pulp fibre properties on supercalendered<br />
mechanical pulp handsheets. J. Pulp Pap. Sci. 28(12), 406-409<br />
Oluwafemi O.A. and Sotannde O.A. (2007): The Relationship between Fibre Characteristics and Pulpsheet<br />
Properties <strong>of</strong> Leucaena leucocphala (Lam.) De Wit. Middle-East Journal <strong>of</strong> Scientific Research<br />
2(2), 63-68<br />
Reme P.A. and Helle T. (2001): Quantitative Assessment <strong>of</strong> Mechanical Fibre Dimensions During<br />
Defibration and Fibre Development. J. Pulp Pap. Sci. 27(1), 1-7<br />
Reme P.A., Johnsen P.O. and Helle T. (2002): Assessment <strong>of</strong> Fibre Transverse Dimensions using SEM<br />
and Image Analysis. J. Pulp Pap. Sci. 28(4), 122-128<br />
Rolland du Roscoat S., Bloch J.F. and Thibault X. (2005): Synchrotron radiation microtomography<br />
applied to investigation on paper. J. Phys. D-Appl. Phys. 38, A78-A84<br />
Turunen M., LeNy C., Tienvieri T. and Niinimäki J. (2005): Comparison <strong>of</strong> fibre morphology analysers.<br />
Appita J. 58(1), 28-32<br />
Wiltsche M., Donoser M., Bauer W. and Bisch<strong>of</strong> H. (2005): A new slice based concept for 3D paper<br />
structure analysis applied to spatial coating layer formation. Proc. 13th Fund. Res. Symposium,<br />
Cambridge, UK, September 2005. ISBN 0-9545273-3-2, pp. 853-899<br />
190
COST Action E54 Book<br />
IMPROVED CHARACTERIZATION OF CHANGES IN FIBRE CROSS<br />
SECTION DURING SHEET FORMING AND DRYING USING OPTICAL<br />
FIBRE ANALYZER DATA AND A SERIAL SECTIONING TECHNIQUE<br />
Abstract<br />
1 Warren Batchelor, 2 Johannes Kritzinger, 2 Wolfgang Bauer, 3 Timo Kuntzsch and<br />
3 Gert Meinl<br />
1 Monash University Victoria, Australia<br />
2 Graz University <strong>of</strong> Technology, RSA µSTRUCSCOP, Austria<br />
3 PTS Heidenau, Germany<br />
E-mail: timo.kuntzsch@ptspaper.de<br />
The contribution describes the combination <strong>of</strong> analysis methods to characterize fibre cross<br />
sections in wet and dry state aiming at a better understanding <strong>of</strong> shrinkage and pressing effects<br />
and related fibre collapse and deformation. The experimental results measured for a range <strong>of</strong><br />
different pulp samples by an optical fibre analyzer and a serial sectioning technique are<br />
presented and discussed. Furthermore a new numerical approach for describing the<br />
transformation <strong>of</strong> fibre cross sections from wet to dried state is introduced and evaluated.<br />
Introduction<br />
The development <strong>of</strong> physical models for paper property prediction and their practical use require<br />
detailed knowledge regarding individual fibre characteristics such as their morphological<br />
parameters and their arrangement in a fibre network <strong>of</strong> the formed sheet. Regarding fibre<br />
bonding, fibre cross sections are one <strong>of</strong> the most important issues controlling bonded surfaces as<br />
shown in Figure 1, for instance in terms <strong>of</strong> Relative Bonded Area (RBA). Batchelor and He<br />
(2005) and Batchelor et al. (2007) presented approaches to estimate RBA <strong>of</strong> fibres in a given<br />
sheet by using the apparent density <strong>of</strong> the sheet and (mean) fibre cross section dimensions. The<br />
method itself needs the knowledge <strong>of</strong> fibre diameter in the dried sheet.<br />
Figure 1. Fibre bond formation process (from Nanko and Ohsawa 1989)<br />
191
COST Action E54 Book<br />
Cross section information <strong>of</strong> thousands <strong>of</strong> fibres is typically provided by some fibre analyzers<br />
which measure morphological fibre properties in a dilute suspension. The fibre cross section<br />
dimensions determined in the wet state differ considerably from those in a well dried paper sheet<br />
because <strong>of</strong> fibre shrinkage and pressing effects, which lead to fibre collapse and deformation<br />
(Figure 1).<br />
During the last few years, as a result <strong>of</strong> innovative image acquisition and processing techniques,<br />
morphological data <strong>of</strong> fibre cross sections within dried sheets have become available. The<br />
combination <strong>of</strong> analysis methods to characterize fibre cross sections in wet and dry state allows a<br />
better understanding <strong>of</strong> pressing and drying mechanisms and can be used to derive and to<br />
improve corresponding simulation models.<br />
This contribution will compare characteristics <strong>of</strong> fibre cross-sectional dimensions (i.e. Fibre<br />
Width, Fibre Wall Thickness and Fibre Wall Area) measured in suspension and in the dried<br />
sheet. The fibre cross-section dimensions in suspension were measured by a kajaani FiberLab TM<br />
instrument (Metso Automation), while a serial sectioning technique applied to handsheets was<br />
used to measure cross-sectional dimensions within the dried sheet. For allocation <strong>of</strong><br />
representative results fibre populations <strong>of</strong> about 20000 fibres in suspension and 2000 fibre cross<br />
sections in the corresponding handsheets have been analysed. The results were evaluated with<br />
regard to pressing and drying processes. Moreover a new numerical approach for describing the<br />
transformation <strong>of</strong> fibre cross sections from wet to dried state will be introduced and discussed.<br />
Experimental<br />
Pulp samples<br />
The following unrefined pulp samples were selected in order to compare fibre cross section in<br />
suspension and in dried handsheets:<br />
- BCTMP (Bleached Chemi-Thermomechanical Pulp, aspen)<br />
- BEKP (Bleached Eucalyptus Kraft Pulp)<br />
- NBSK (Northern-Bleached S<strong>of</strong>twood Kraft, spruce)<br />
- Sulfite (S<strong>of</strong>twood sulfite pulp, spruce)<br />
Further on to study the effect <strong>of</strong> refining on fibre cross section a Northern Unbleached S<strong>of</strong>twood<br />
Kraft Pulp (UBSK, pine/spruce) was used and refined on a laboratory disc refiner with a Specific<br />
Edge Load <strong>of</strong> 2.0 J/m and with Specific Net Refining Energy input <strong>of</strong> 0, 50 and 100 kWh/t.<br />
Measurement methods<br />
FiberLab TM V3.0 was used to measure the fibre cross sections in suspension. For this purpose all<br />
pulp samples were reslushed and diluted.<br />
Working principals <strong>of</strong> optical fibre analyzers and some quality comparisons were described in<br />
more detail by Turunen et al. (2005) and Guay et al. (2005). Comparing FiberLab TM fibre wall<br />
thickness data with results from an alternative image processing systems, Richardson et al.<br />
(2003) recommended the use <strong>of</strong> FiberLab TM fibre wall thickness data carefully. Nevertheless<br />
FiberLab TM is an established fibre analyzer for fibre wall thickness measurement <strong>of</strong> large fibre<br />
populations featuring a proven ability to detect changes relevant to raw material or process<br />
effects (see e.g. Reyier 2008).<br />
192
COST Action E54 Book<br />
Rapid-Köthen former was used to form standard handsheets for each pulp sample. A serial<br />
sectioning technique and image processing tools were applied for fibre cross sectional analysis<br />
in handsheets (see Kritzinger et al. 2008).<br />
Results and Discussion<br />
Starting with Fibre Wall Area the measured data confirm that the ratio <strong>of</strong> the Fibre Wall Area A’<br />
in handsheet and those in suspension A varies between 1:2.5 (chemical pulp) and 1:4<br />
(mechanical pulp). Concerning the correlation <strong>of</strong> Fibre Wall Thickness data seen in Figure 2 <strong>of</strong><br />
handsheet and suspension indicates the same corresponding behaviour <strong>of</strong> chemical (dashed line)<br />
and mechanical (continuous line) pulps. In addition to the measured data, Figure 2 contains data<br />
from Reyier (2008), where fibre wall thickness <strong>of</strong> TMP fibres before (TMP Feed) and after<br />
various fractionation steps (TMP Stream 1, TMP Stream 5) in a hydrocyclone were compared.<br />
“Handsheet” data were measured by Reyier on freeze dried fibres, a method which is described<br />
in more detail by Reme et al. (2002). The data for TMP are well on the line <strong>of</strong> BCTMP.<br />
Suspension FWT [µm]<br />
12<br />
10<br />
8<br />
6<br />
4<br />
2<br />
0<br />
A':A ~ 1:4<br />
Fibre Wall Thickness<br />
0,0 0,5 1,0 1,5 2,0 2,5 3,0 3,5<br />
Handsheet a o-a i [µm]<br />
A':A ~ 1:2,5<br />
BCTMP<br />
BEKP<br />
NBSK<br />
Sulfite<br />
UBSK 0<br />
UBSK 50<br />
UBSK 100<br />
TMP Feed<br />
TMP Stream 1<br />
TMP Stream 5<br />
Figure 2. Mean Fibre Wall Thickness in suspension (FWT) and in handsheet (ao-ai ; explained in<br />
Figure 4)<br />
The results also show that there are no major differences in the average Fibre Wall Area visible<br />
before and after refining. The same observation was made for other mean values <strong>of</strong> cross<br />
sectional dimensions. Only the amount <strong>of</strong> totally collapsed fibres indicates the refining impact.<br />
The latter number increased steadily from 85 % (unrefined) to 95% as refined (100 kWh/t).<br />
193
Suspension WI [µm]<br />
40<br />
35<br />
30<br />
25<br />
20<br />
15<br />
10<br />
5<br />
0<br />
COST Action E54 Book<br />
Fibre Width<br />
0,0 5,0 10,0 15,0 20,0 25,0 30,0<br />
Handsheet 2a o [µm]<br />
Figure 3. Fibre width in suspension (WI) and in handsheet (2ao ; explained in Figure 4)<br />
BCTMP<br />
BEKP<br />
NBSK<br />
Sulfite<br />
UBSK 0<br />
UBSK 50<br />
UBSK 100<br />
Based on the measured data for fibre width (Figure 3) and fibre wall thickness, the transition <strong>of</strong><br />
the fibre cross section from swollen state to dried and compressed state can be divided into two<br />
processes (Figure 4), which occur simultaneously during paper making – the drying process<br />
(shrinkage <strong>of</strong> the fibre cross section) and the compressions process (due to the forces which act<br />
on the fibres during wet pressing).<br />
I. Fibre cross-section in suspension<br />
(swollen)<br />
WI<br />
A<br />
FWT<br />
II. Fibre cross-section due to<br />
drying shrinkage<br />
WI‘<br />
A‘<br />
FWT‘<br />
III. Fibre cross-section in<br />
handsheet (compressed)<br />
a o<br />
a) Elliptical<br />
b o<br />
b i<br />
b) Rectangular<br />
a i A“<br />
Figure 4. Two processes (drying shrinkage and compression), which occur during sheet forming and<br />
corresponding fibre cross section characteristics. The fibre cross section in handsheet can be drawn as<br />
elliptical or rectangular<br />
194<br />
a o<br />
b o<br />
b i<br />
a i<br />
A“
COST Action E54 Book<br />
The drying process I�II (A�A’ in Figure 4) can be characterized mathematically by a<br />
similarity transformation. Comparing Fibre Wall Area A before and A” after shrinkage (the<br />
latter equals A’ if we assume fibre wall material incompressibility) leads to a similarity ratio<br />
[ A ' '/<br />
A ] <strong>of</strong> about 0.66 for chemical pulp and 0.5 for mechanical pulp. Applying this ratio to<br />
WI and FWT yields the corresponding values WI’ and FWT’ <strong>of</strong> the dried but uncompressed<br />
fibre.<br />
For the second step, the compression process II�III in Figure 4, it is important to account for<br />
invariants. According to observations by He et al. (2003) the fibre cross section area does not<br />
change significantly due to various wet press levels, i.e. A’=A”. A second assumption that was<br />
made is FWT’=bo-bi. i.e., the difference <strong>of</strong> outer and inner minor axis remains constant. As a<br />
third assumption let us assume that fibre perimeter also remains constant.<br />
Now the procedure followed for the transformation to elliptical shape was to prescribe the values<br />
<strong>of</strong> the outside semi-minor ellipse axis, bo, as a fraction <strong>of</strong> WI’. The inside semi-minor ellipse<br />
axis, bi, was then calculated by subtracting the wall thickness FWT’ <strong>of</strong> the fibre A’ from bo. The<br />
outside and inside semi-major axes, ao and ai were calculated from the area invariance A’=A”<br />
and by assuming that the perimeter <strong>of</strong> the ellipse was constant and independent <strong>of</strong> the fractional,<br />
very slight reduction in thickness given by 2bo/WI’.<br />
The procedure described above can be applied with minor modifications to both cases, elliptical<br />
or rectangular fibre cross section in handsheet. A calculation example is shown in Figure 5 for<br />
the BEKP sample (elliptical case) for various bo values. In this case the measured value for ao<br />
can be described properly supporting the proposed procedure. However further refinement is<br />
ongoing to explain all observed effects, e.g. with regard to fibre collapse.<br />
[µm]<br />
BEKP<br />
16<br />
14<br />
12<br />
10<br />
8<br />
6<br />
4<br />
2<br />
0<br />
increasing degree<br />
<strong>of</strong> deformation<br />
0 1 2 3 4 5 6<br />
bO o [µm]<br />
Figure 5. Calculation <strong>of</strong> ao, ai, bi as a function <strong>of</strong> bo for BEKP. The following input data were used: A’’=<br />
59.7 µm 2 , Perimeter: 32.5 µm, bo - bi = 4.9 µm. The arrows refer to the measured values <strong>of</strong> bo and ao<br />
195<br />
a o<br />
a i<br />
b i
Conclusions<br />
COST Action E54 Book<br />
Different measurement methods were combined to characterize fibre cross sections in wet state<br />
(suspension) and in handsheets after shrinking and drying. All handsheets showed highly<br />
deformed fibres, for all investigated chemical pulp samples little or no lumen was found. Fibre<br />
shrinkage and deformation/compression were described using similarity transformations. A<br />
circular cross section for fibres in suspension and an elliptical shaped cross section for fibres in<br />
handsheets were assumed. The relation between cross section data measured by FiberLab TM in<br />
suspension and those <strong>of</strong> the dried and compressed fibres in handsheets can be described by two<br />
affine transformations, which differ for chemical and mechanical pulps. Fibre deformation<br />
seems to occur in a similar way for all investigated pulp samples.<br />
From analysis <strong>of</strong> fibre cross sections after moderate refining (up to 100 kWh/t net refining<br />
energy) no significant changes were observed neither in suspension nor in dried handsheets. The<br />
only significant change was that the number <strong>of</strong> collapsed fibres increased, with increasing<br />
refining energy, which was probably caused by fibre stiffness reduction.<br />
References<br />
Batchelor W.J. and He J. (2005): A new method for determining the relative bonded area. Tappi J. 47(6),<br />
23-28<br />
Batchelor W., Kibblewhite R.P. and He J. (2007): A new method for measuring RBA applied to the Page<br />
equation for the tensile strength <strong>of</strong> paper. TAPPI Paper Physics Conference 2007<br />
Guay D., Sutherland N., Rantanen W., Malandri N., Stephens A., Mattingly K. and Schneider M. (2005):<br />
Comparison <strong>of</strong> Fiber Length Analyzers. Proc. TAPPI Practical <strong>Papermaking</strong> Conf., May 22-26, 2005,<br />
Milwaukee, Wisconsin<br />
He J., Batchelor W.J., Markowski R. and Johnston R. (2003): A new approach for quantitative analysis <strong>of</strong><br />
paper structure at the fibre level. Appita J. 56(9) 366<br />
Kritzinger J., Donoser M., Wiltsche M. and Bauer W. (2008): Examination <strong>of</strong> fibre transverse properties<br />
based on a serial sectioning technique. Proc. Progress Paper Physics Seminar: June 2-5, 2008, Espoo,<br />
Finland<br />
Nanko H. and Ohsawa J. (1989): Mechanisms <strong>of</strong> fibre bond formation. In: Fundamentals <strong>of</strong><br />
<strong>Papermaking</strong>. Ed: C.F. Baker, Mechanical Engineering Publications Ltd., London, 1989, p. 783<br />
Reme P.A., Johnsen P.O. and Helle T. (2002): Assessment <strong>of</strong> Fibre Transverse Dimensions using SEM<br />
and Image Analysis. J. Pulp Paper Sci. 28(4), 122<br />
Reyier S. (2008): Bonding Ability Distributions <strong>of</strong> Fibers in Mechanical Pulp Furnishes. Licentiate<br />
Thesis, Mid-Sweden University, Sundsvall 2008<br />
Richardson J.D., Riddell M.J.C. and Burrel P. (2003): Experience with the FiberLab V3.0 analyser for<br />
measuring fibre cross-section dimensions. Proc. 57th Appita Annual Conference and Exhibition: May 5-<br />
7, 2003, Melbourne, Australia<br />
Turunen M., LeNy C., Tienvieri T. and Niinimäki J. (2005): Comparison <strong>of</strong> fibre morphology analysers.<br />
Appita J. 58(1) 28<br />
196
COST Action E54 Book<br />
CHARACTERIZATION OF TMP FIBER WALL STRUCTURES BY<br />
MICROSCOPIC TECHNIQUES<br />
1 Sabine Heinemann, 2 Shaoxia Wang, 2 Jouko Peltonen, 1 Marjatta Kleen<br />
1 P.O. Box 1000, 02044 VTT (Espoo), Finland<br />
2 Center <strong>of</strong> Excellence for Functional Materials (FUNMAT), Laboratory <strong>of</strong> Paper Coating and<br />
Converting, Åbo Akademi University, Porthansgatan 3, 20500 Turku, Finland<br />
Abstract<br />
Corresponding author: sabine.heinemann@vtt.fi<br />
Effect <strong>of</strong> pH on micro and nano scale surface structure <strong>of</strong> 1 st stage TMP latewood fibers from<br />
Norway spruce was investigated. The fibers were analyzed by light microscopy, Atomic Force<br />
Microscopy (AFM) and Field-Emission Scanning Electron Microscopy (FE-SEM). Fibers at<br />
rather neutral pH level were found to be partly covered by reminants <strong>of</strong> outer fiber wall layers<br />
and partly by areas <strong>of</strong> exposed inner fiber wall. The outer fiber wall areas appeared as intact<br />
bands surrounding the fiber and were clearly rougher than areas <strong>of</strong> exposed inner fiber wall. In<br />
addition, the pH level affected the roughness <strong>of</strong> the outer fiber wall areas.<br />
Introduction<br />
Process development, including improved understanding <strong>of</strong> the fiber surface development, plays<br />
a key role in modern mechanical pulping. Both the physical and the chemical surface properties<br />
<strong>of</strong> pulps are very important, since they influence fiber charge, fiber bonding, wettability,<br />
adsorption, adhesion and consumption <strong>of</strong> papermaking chemicals.<br />
The refining process includes two stages – fiber separation and fiber development – which can<br />
occur simultaneously (Karnis 1994). In the fiber separation stage, wood chips are broken up into<br />
smaller particles, whereas fiber development proceeds via delamination and peeling <strong>of</strong> the fiber<br />
surface. Basically, the outer fiber wall layers, i.e. primary wall (P) and outer secondary wall<br />
(S1), are peeled <strong>of</strong>f leaving the inner secondary wall (S2) exposed. The way how the refining<br />
process affects the fiber surfaces depends on several factors, e.g. the refining energy input and<br />
the possible pretreatment <strong>of</strong> the wood chips with steam or chemicals prior to refining.<br />
The conventional chemical used in s<strong>of</strong>twood CTMP process is sodium sulfate (Na2SO3). In<br />
comparison to the TMP process, this chemical improves the purity <strong>of</strong> the s<strong>of</strong>twood pulp as well<br />
as its absorption ability and strength, though the refining energy demand to a certain freeness<br />
level is increased by addition <strong>of</strong> the chemical. Some other chemicals, e.g. buffered sodium<br />
oxalate, have been tested mainly in search <strong>of</strong> suitable processes for TMP production at lower<br />
specific energy consumption (Meyer et al. 2004; 2005). Such process applies acidic pH <strong>of</strong> about<br />
2. On the other hand, very little is known about how the acidic treatment changes the fiber<br />
surface morphology.<br />
The morphology <strong>of</strong> mechanical pulp fiber surfaces can be studied by different microscopy<br />
techniques, e.g. with Atomic Force Microscope (AFM) (Börås et al. 1999; Gustafsson 2004;<br />
Hanley et al. 1994; Kangas et al. 2004; Koljonen et al. 2003; Shaune et al. 1994; Snell 2001;<br />
Stenius et al. 2008; Österberg 2006), with light microscopy or with Scanning Electron<br />
Microscopy (SEM) (Braaten 1997; Daniel et al. 2009; Fernando and Daniel 2008; Johnsen et al.<br />
1995; Lidbrandt and Mohlin 1980; Reme et al. 1998). A SEM equipped with a field emission gun<br />
(FE-SEM) produces images <strong>of</strong> fiber surfaces at high magnifications and can be used to study fine<br />
surface details (Kangas et al. 2004).<br />
197
COST Action E54 Book<br />
The aim <strong>of</strong> this work was to collect versatile information about the surface structures <strong>of</strong> spruce<br />
TMP fiber walls and how they were changed by acidic environment. Different microscopy<br />
techniques were used to study the fiber surface structures focusing on the differences between<br />
the inner and outer fiber wall areas <strong>of</strong> spruce TMP fibers treated with water and hydrochloric<br />
acid.<br />
Materials and sample preparation<br />
Samples<br />
The investigations were carried out on samples from latewood-enriched, i.e. thick-walled, long<br />
fibers separated from 1 st stage spruce TMP (Picea abies). This type <strong>of</strong> material has the highest<br />
sensitivity in responding to the initial defibration process in mechanical pulping. The long fibers<br />
were separated from the pulp by Bauer-McNett cascade fractionation. The remaining material<br />
over 14 mesh and 28 mesh was mixed. The latewood content <strong>of</strong> this material was 42 % as<br />
measured by microscopy, which is high compared to the normal 15-20 %. Selected properties <strong>of</strong><br />
these long fibers are given in Table 1.<br />
Table 1. Average properties <strong>of</strong> the fibers in the long fiber fraction before chemical treatment<br />
Long fibers<br />
Freeness, mL 760<br />
Length-weighted fiber length, mm 2.12<br />
DDJ-fines content, % 1) 1.7<br />
Fiber wall thickness, µm 5.21<br />
Fiber width, µm 35.48<br />
Cell-wall index CWI 2) 0.294<br />
1) <strong>Fine</strong>s proportion <strong>of</strong> a pulp sample, separated by Dynamic Drainage Jar (DDJ) using a 81 µm mesh screen<br />
2) Cell wall index is calculated as the ratio <strong>of</strong> double fiber wall thickness and fiber width (see also Heinemann and Ander 2011)<br />
Adjusting <strong>of</strong> pH levels<br />
The long fibers were treated with hydrochloric acid (AC) to get a pH <strong>of</strong> approx. 2.5. Reference<br />
treatment (REF) was performed with deionized water at pH 6. The conditions for all treatments<br />
are given in Table 2. In all cases, fiber consistency was 2 % and the treatment temperature<br />
130°C. All mechanical treatments, such as mixing and stirring, were the same for all trials.<br />
Table 2. Fiber treatment conditions<br />
Sample name Treatment<br />
Amount <strong>of</strong><br />
chemical on<br />
oven-dry fiber<br />
(mmol/g)<br />
Initial pH<br />
Treatment<br />
time<br />
(min)<br />
Total contact<br />
time<br />
(min)<br />
REF Water 6.0 15 53<br />
AC HCl 1.14 2.5 15 51<br />
Preparation <strong>of</strong> single fibers for analysis<br />
A special single fiber analysis procedure for inspection with different microscopy techniques<br />
was developed. This enabled the imaging <strong>of</strong> one and the same fiber with all microscopy<br />
methods. Moist fibers with visible bands <strong>of</strong> intact outer fiber wall were selected under the light<br />
microscope. The fibers were placed as parallel as possible onto a round glass plate <strong>of</strong> 15 mm<br />
diameter. The ends <strong>of</strong> the fibers were fixed with water-pro<strong>of</strong> tape, and the glass plate was then<br />
198
COST Action E54 Book<br />
brought to an object slide fixed with a drop <strong>of</strong> water-glycerin. Finally, a drop <strong>of</strong> water was set<br />
onto the fibers, and they were covered with cover slide and brought to cool and dark storage<br />
room.<br />
For AFM measurements, dry fibers are preferred. The fibers fixed on the glass plates and<br />
covered with standard cover glass were permitted to dry gently in the storage room. Before AFM<br />
imaging, the cover glass was carefully removed. By this procedure, minor changes in the surface<br />
structure cannot be avoided, and some shrinking was observed. These minor changes are<br />
assumed not to affect the comparison <strong>of</strong> the samples, since the same preparation procedure was<br />
applied on all the samples.<br />
After AFM measurement, the same glass plates with fibers fixed on them were studied by FE-<br />
SEM. The glass plates were mounted to the samples holders, and the fibers were sputtered<br />
directly on the glass support.<br />
Methods<br />
Light microscopy<br />
Each single unstained fiber was first inspected at light microscope applying bright field,<br />
polarization, surface scatter and combinations <strong>of</strong> these optical techniques. These illumination<br />
modes provide possibilities to visualize distinctive parts <strong>of</strong> the fiber wall – bands <strong>of</strong> intact outer<br />
fiber wall, and exposed areas <strong>of</strong> inner fiber wall. Additionally, selected fibers were stained with<br />
Rhodamine Red and Toluidine Blue to further improve the visibility <strong>of</strong> morphologically<br />
different fiber wall areas.<br />
Images were taken from all inspected single fibers. The positions <strong>of</strong> the different fiber wall parts<br />
were marked to localize them again when analyzing the fibers by AFM and FE-SEM.<br />
Atomic Force Microscope (AFM)<br />
The AFM measurements were carried out at ambient conditions with a Nanoscope IIIa (Digital<br />
Instruments Veeco Meterology Group, Santa Barbara, CA) instrument. The microscope was<br />
placed on an active vibration isolation table (MOD-1, JAS Scientific Instruments), which was<br />
itself placed on a massive stone table to eliminate external vibration noise. All images were<br />
obtained with a J-scanner in tapping mode and using silicon cantilevers (NSC15/NoAl, µmasch<br />
TM) with a radius <strong>of</strong> curvature <strong>of</strong> the tips less than 10 nm. The free vibration amplitude <strong>of</strong> the<br />
cantilever was 80 ± 5 nm, and a damping ratio (tapping amplitude/free amplitude) within 0.60-<br />
0.75 was used for imaging. Topographical and phase images were recorded simultaneously using<br />
a scan speed <strong>of</strong> 0.8-1 Hz with a pixel resolution <strong>of</strong> 512 x 512. Mean values and deviations <strong>of</strong><br />
roughness parameters were calculated from about 8 sample spots sized 3 x 3 µm each.<br />
RMS (Root Mean Square) roughness, kurtosis and skewness were found to be the most suitable<br />
roughness parameters for characterization <strong>of</strong> surface differences between the outer and the inner<br />
fiber wall areas.<br />
RMS roughness Sq is defined as the standard deviation <strong>of</strong> height within the sampling area:<br />
���<br />
�<br />
� M 1N<br />
�1<br />
1<br />
2<br />
S q �<br />
z(<br />
xk<br />
, yl<br />
) � µ<br />
(1)<br />
MN<br />
k �0<br />
l �0<br />
Where µ is the mean height:<br />
199
µ �<br />
1<br />
MN<br />
� M 1N<br />
�1<br />
��<br />
k �0<br />
l �0<br />
z(<br />
x , y )<br />
k<br />
l<br />
COST Action E54 Book<br />
These equations are valid for an M x N rectangular sampling area with lateral directions x and y<br />
and vertical direction z (Image Metrology 2007).<br />
Kurtosis Sku is a measure <strong>of</strong> the peakedness or sharpness <strong>of</strong> the surface topography, and it is<br />
defined as:<br />
���<br />
�<br />
� M 1N<br />
�1<br />
1<br />
4<br />
S ku �<br />
z(<br />
xk<br />
, yl<br />
) � µ<br />
(3)<br />
4<br />
MNS<br />
q<br />
k �0<br />
l �0<br />
Sku equals 3.0 for a Gaussian-like surface. Values smaller than 3.0 indicate a broad<br />
(heterogeneous) height distribution, whereas values larger than 3.0 refer to a surface with height<br />
distribution narrower than that <strong>of</strong> a Gaussian surface (Stout 2000, Image Metrology 2007).<br />
Skewness Ssk describes the asymmetry <strong>of</strong> the height distribution histogram, and is defined as:<br />
� M 1N<br />
�1<br />
���z(<br />
xk<br />
, yl<br />
) � µ �<br />
S �<br />
(4)<br />
sk<br />
k �0<br />
l �0<br />
3<br />
If Ssk is 0, a symmetric Gaussian like height distribution is indicated. Ssk > 0 indicates a flat<br />
surface with peaks and Ssk < 0 refers to a surface dominated with valleys. Values numerically<br />
greater than 1.0 may indicate extreme valleys or peaks on the surface (Image Metrology 2007).<br />
Field Emission Scanning Electron Microscope (FE-SEM)<br />
The morphology <strong>of</strong> pulp fibers was imaged using a Field Emission Scanning Electron<br />
Microscope (FE-SEM, Jeol JSM 6335F). A low acceleration voltage (1 kV) was used. Fibers<br />
were sputter-coated with a thin layer <strong>of</strong> Au-Pd. The same areas as already studied with the light<br />
microscope and measured by AFM were localized in FE-SEM.<br />
Results and Discussion<br />
TMP fiber wall surface structures studied by light microscopy<br />
The appearance <strong>of</strong> the studied TMP fibers is illustrated in Figure 1. Different parts <strong>of</strong> the fiber<br />
walls can be easily recognized, i.e. areas <strong>of</strong> intact outer fiber wall, which appear as bands around<br />
the fiber without longitudinal slits, and exposed inner fiber wall areas, which are seen as swollen<br />
areas by light microscopy. The dimensions <strong>of</strong> the outer wall bands and their distribution along<br />
the fiber axis depend on TMP process conditions and are connected to fiber flexibility and<br />
eventually to paper properties (Vehniäinen 2008; Heinemann 2008).<br />
200<br />
(2)
COST Action E54 Book<br />
200 µm<br />
Figure 1. Surface structures <strong>of</strong> TMP fiber walls – intact outer (marked with arrows) and developed inner<br />
fiber wall areas as imaged by SEM and light microscopy (photo: KCL (today VTT))<br />
Figure 2 shows how the different surface structures become visible at light microscopy when<br />
various illumination modes and optical staining methods are used. It is possible to recognize<br />
morphological differences between intact outer fiber wall and exposed inner fiber wall using<br />
only bright field illumination with transmitted light (1). The optical contrast can be improved by<br />
polarized light (2), by circular modified polarized light (3) and by more unconventional<br />
illumination mode with surface-scattered light (4). Staining <strong>of</strong> the fiber with suitable stains and<br />
observation in transmitted light (5 and 6) was a further step to improve the optical contrast<br />
between the outer and the inner fiber wall areas. As seen from Figure 2, there was a clear<br />
distinction between the intact outer fiber wall (P/S1 wall) areas and the exposed inner fiber wall<br />
(S2) area in all applied light microscopy procedures. The most suitable stains were Rhodamine<br />
Red (5) and Direct Red. In this work, Rhodamine Red (5) was mainly used.<br />
open inner fiber wall (S2)<br />
intact outer fiber wall (P/S1)<br />
1 2 3 4 5 6<br />
1 – normal transmitted light<br />
2 – polarized light<br />
3 – modified polarized light<br />
4 ‐ surface light<br />
5 – normal transmitted light (Rhodamine)<br />
6 – normal transmitted light (Rhodamine/Toluidine Blue)<br />
100 µm<br />
Figure 2. Intact outer fiber wall areas and exposed inner fiber wall area along fiber length axis revealed<br />
by different light microscopy techniques<br />
TMP fiber wall surface structures studied by AFM<br />
The same single fibers that were studied with the light microscope were further investigated by<br />
AFM and FE-SEM. AFM topographical and phase images were measured from different areas<br />
(i.e. inner and outer layers) <strong>of</strong> the fiber surfaces.<br />
201
COST Action E54 Book<br />
Figure 3 shows a representative topographic image and the corresponding phase contrast image<br />
from the inner wall <strong>of</strong> a fiber treated with hydrochloric acid. The topographical image resolves<br />
not only main bundles, but also individual micr<strong>of</strong>ibrils and the roughness <strong>of</strong> the surface<br />
structure. The diameter <strong>of</strong> the micr<strong>of</strong>ibrils is 10-30 nm which is in very good agreement with<br />
literature values (Kollmann et al. 1968).<br />
The phase image, in addition, reveals more details <strong>of</strong> the fiber fine structure because the contrast<br />
is proportional to the viscoelastic interactions between the surface and the oscillating tip. The<br />
marked area in Figure 3 represents a relatively even and smooth area and therefore, by<br />
topography, a visually homogeneous part <strong>of</strong> the regarded surface. The phase image <strong>of</strong> the same<br />
marked area, however, reveals that the surface in fact is heterogeneous. This is indicated by the<br />
locally varying phase contrast arising from such locally different viscoelastic properties, i.e.<br />
different material components appear on the surface. The s<strong>of</strong>ter the material the darker the color<br />
in the images. In comparison with the reference fiber (not shown here), besides micr<strong>of</strong>ibrils,<br />
additional granular components (the darker area in the image) are visible in the phase image <strong>of</strong><br />
the hydrochloric acid treated fiber. In other words, the hydrochloric acid treatment resulted in a<br />
morphological change <strong>of</strong> the TMP fiber surface caused by some granular, s<strong>of</strong>ter material.<br />
Figure 3. AFM topography (left) and phase (right) images <strong>of</strong> a spruce TMP long fiber treated with<br />
hydrochloric acid. The images are 3 �m x 3 �m<br />
In order to evaluate structural features and differences in the differently treated fibers, phase<br />
contrast images <strong>of</strong> fiber surfaces were used. A collection <strong>of</strong> them is shown in Figure 4. The<br />
topographical images (not shown here) were used for roughness analysis. The fibril angles were<br />
estimated from the AFM phase images <strong>of</strong> fibers that were always positioned vertically before<br />
starting the AFM measurement. The estimated fibril angles assured that distinctive outer and<br />
inner fiber wall areas from the studied fibers were evaluated. The fibril angle, RMS roughness<br />
(Sq), kurtosis (Sku) and skewness (Ssk) values are given in Figure 4 for the shown images.<br />
Although the fibril angles were only estimated from the AFM phase images, a clear difference in<br />
fibril angle values was found between the inner and the outer fiber walls (Figure 4). This result<br />
probably explains the formation <strong>of</strong> the band-like outer fiber wall parts (Figure 1) in the refining<br />
process.<br />
202
COST Action E54 Book<br />
Figure 4. AFM phase images, fibril angle and surface roughness parameters <strong>of</strong> reference fiber (REF),<br />
and fiber treated with hydrochloric acid (AC). The images are 3 �m x 3 �m<br />
The inner and outer fiber walls <strong>of</strong> the reference pulp (REF) can clearly be distinguished due to<br />
their different visual appearance and characteristic roughness parameter values (Figure 4a). For<br />
fibers treated with hydrochloric acid (AC), granular structures were observed in the phase image<br />
(Figure 4b) <strong>of</strong> the inner walls in addition to the fibrilar structure. Furthermore, the dark-light<br />
local contrast differences in the phase contrast image refer to inhomogeneities in the viscoelastic<br />
properties <strong>of</strong> the inner wall. This kind <strong>of</strong> heterogeneity is concluded to be caused by the ACtreatment,<br />
because corresponding heterogeneity is not visible in the reference sample REF<br />
(Figure 4a). In addition, the hydrochloric acid treatment seemed to have resulted in formation <strong>of</strong><br />
patch-like structures on the surface <strong>of</strong> the outer wall.<br />
203
COST Action E54 Book<br />
The mean RMS roughness values (Sq), calculated as an average from all measurements <strong>of</strong> each<br />
type <strong>of</strong> wall area, and their corresponding standard deviations are given in Figure 5a. No<br />
significant difference in roughness <strong>of</strong> the inner walls was found between the different pH levels.<br />
Independent <strong>of</strong> the chemical treatment, the outer fiber wall surfaces were clearly rougher than<br />
the inner fiber wall surfaces. Practically no difference could be observed between the samples<br />
treated with hydrochloric acid (AC) and water (REF).<br />
RMS roughness S q, nm<br />
80<br />
60<br />
40<br />
20<br />
0<br />
inner wall outer wall<br />
17.8 20.7 40.8 43.9<br />
REF AC<br />
Kurtosis S ku<br />
a) b)<br />
Skewness S sk<br />
10<br />
8<br />
6<br />
4<br />
2<br />
0<br />
0.6<br />
0.4<br />
0.2<br />
0.0<br />
‐0.2<br />
‐0.4<br />
‐0.6<br />
‐0.8<br />
‐1.0<br />
inner wall outer wall<br />
4.01 5.40 2.73 3.07<br />
‐0.03<br />
‐0.41<br />
REF1 AC<br />
inner wall outer wall<br />
REF 1 AC<br />
Figure 5. RMS roughness (a), Kurtosis Sku (b), and Skewness Ssk (c) <strong>of</strong> inner and outer fiber wall areas<br />
(for averages, 9 images, varying from 4 to 12 were evaluated)<br />
The results <strong>of</strong> the height distribution analysis (roughness parameter kurtosis, Sku) are shown in<br />
Figure 5b. In each sample type, the value <strong>of</strong> this parameter was larger for the inner fiber wall<br />
areas than for the outer fiber wall areas. The inner walls <strong>of</strong> the acid-treated sample (AC) showed<br />
clearly higher kurtosis indicating that this treatment caused a larger change in the surface peak<br />
distribution <strong>of</strong> the inner wall areas. The AC-treated samples also showed a substantial difference<br />
in kurtosis between the inner and the outer fiber wall areas. The kurtosis values <strong>of</strong> the outer fiber<br />
wall parts were quite close to 3, i.e. for these parts <strong>of</strong> the fiber surfaces Gaussian distribution was<br />
the most representative. The results suggest that no visible changes were introduced to the<br />
surface height distribution <strong>of</strong> the outer fiber wall areas by changing the pH in the treatment.<br />
Skewness (Ssk) was slightly negative for all measured inner fiber wall areas (Figure 5c). This<br />
stands for a surface dominated by valleys (surface pores). This is distinctive especially for the<br />
acid-treated fibers (AC) indicating that this treatment created most surface pores in the inner<br />
wall areas. The outer fiber walls had skewness values close to zero or slightly positive which<br />
204<br />
c)<br />
0.21<br />
0.07
COST Action E54 Book<br />
means that the surfaces were less porous than the surfaces <strong>of</strong> inner fiber wall areas, especially in<br />
the reference sample (REF).<br />
RMS roughness <strong>of</strong> each analyzed area was plotted in relation to the corresponding fibril angle<br />
(Figure 6). The roughness values <strong>of</strong> the inner fiber wall parts scatter clearly less than those <strong>of</strong> the<br />
outer fiber wall parts as already seen in the average values in Figure 5a. Although the fibril<br />
angles were only estimated from the AFM phase images with the fibers carefully positioned<br />
before analysis, a clear classification between the inner and the outer fiber walls was found. This<br />
result probably explains the formation <strong>of</strong> the band-like outer fiber wall parts in the refining<br />
process – fiber wall layers with high fibril angles have a lower resistance against peeling<br />
perpendicular to the fiber length axis.<br />
RMS roughness S q, nm<br />
100<br />
80<br />
60<br />
40<br />
20<br />
0<br />
inner wall outer wall<br />
0 15 30 45 60 75 90<br />
Fibril angle, °<br />
Figure 6. Distinction <strong>of</strong> inner and outer fiber wall roughness by fibril angle<br />
TMP fiber wall surface structures studied by FE-SEM<br />
The same single fibers, which were measured by AFM, were also studied by FE-SEM to<br />
compare the information obtained with these two analysis techniques.<br />
FE-SEM confirmed the relatively smooth surface <strong>of</strong> the inner fiber wall <strong>of</strong> the reference fibers<br />
(REF, Figure 7) as already was seen by AFM (Figures 4 and 5). Also the fibers treated with<br />
hydrochloric acid (AC) were found by FE-SEM to have similar structures (Figure 8) as found by<br />
AFM.<br />
Obviously, the high resolution <strong>of</strong> FE-SEM gives high-quality information comparable to AFM<br />
in visual characterization <strong>of</strong> fiber surface structures. The strength <strong>of</strong> AFM lies in additional<br />
possibilities to measure surface roughness and other surface structural characteristics.<br />
205
COST Action E54 Book<br />
Figure 7. FE-SEM images <strong>of</strong> inner fiber wall surface – reference sample (REF) – Insert: AFM image <strong>of</strong><br />
comparable fiber wall structure with corresponding size (not from exactly the same position <strong>of</strong> the fiber<br />
wall)<br />
Figure 8. FE-SEM images <strong>of</strong> outer and inner fiber wall areas <strong>of</strong> samples treated with hydrochloric acid<br />
(AC) – Insert: AFM image <strong>of</strong> comparable fiber wall structure with corresponding size (not from exactly<br />
the same position <strong>of</strong> the fiber wall)<br />
206
Conclusions<br />
COST Action E54 Book<br />
Light microscopy, AFM and FE-SEM are very suitable tools to characterize fiber wall surface<br />
structures. Single fiber examination with a combination <strong>of</strong> these techniques provided deeper<br />
insight into fiber wall surface structure. Distinction between the outer and the exposed inner<br />
fiber wall areas in TMP refined fibers can easily be done by light microscopy in transmitted light<br />
on fibers stained with Direct Red or Rhodamine Red. AFM measurements deliver roughness<br />
data <strong>of</strong> the outer and inner fiber wall areas and FE-SEM can be used to illustrate the locations in<br />
macro scale <strong>of</strong> the structures which can be measured in micro and nano scale by AFM.<br />
Using AFM, the surface structures <strong>of</strong> the inner and outer fiber wall areas were clearly<br />
distinguishable based on their fibril angle and RMS roughness measures. The reminants <strong>of</strong> the<br />
outer fiber wall areas in all studied samples were found rougher than the exposed inner fiber wall<br />
areas. The hydrochloric acid treatment modified the fine structure <strong>of</strong> the inner wall surfaces and<br />
revealed the appearance <strong>of</strong> a granular and viscoelastic heterogeneous structure.<br />
References<br />
Braaten K.R. (1997): The impact <strong>of</strong> fiber geometry, fiber splitting and fibrillation on light scattering.<br />
1997 Int. Mech. Pulp. Conf. (IMPC), Stockholm, June 9-13, 349-353<br />
Börås L. and Gatenholm P. (1999): Surface composition and morphology <strong>of</strong> CTMP fibers.<br />
Holzforschung, (53): 188-194<br />
Daniel G., Bardage S., Fernando D., Hafrén J. and Ander P. (2009): Energy consumption in refining <strong>of</strong><br />
Scots pine and Norway spruce TMP is governed by fibre morphology and ultrastructure. Int. Mech. Pulp.<br />
Conf., Sundsvall, Sweden. May 31-June 4, 2009. SPCI and Mid Sweden University, p. 82-86<br />
Fernando D. and Daniel G. (2008): Exploring pine fibre development mechanisms during TMP<br />
processing; Impact <strong>of</strong> cell wall ultrastructure (morphological and topochemical) on negative<br />
behaviour. Holzforschung 62(5): 597-607<br />
Gustafsson J. (2004): Surface characterization <strong>of</strong> chemical and mechanical pulp fibres by AFM and XPS.<br />
Doctoral thesis, Åbo Akademi University, Turku, Finland<br />
Hanley S.J. and Gray, D.G. (1994): Atomic force microscope images <strong>of</strong> black spruce wood sections and<br />
pulp fibres. Holzforschung (48): 29-34<br />
Heinemann S. (2008): Quantitative description <strong>of</strong> the TMP fiber wall. Wochenbl. Papierfab. 136(11-12):<br />
658-665<br />
Image Metrology, The Scanning Probe Image Processor, SPIPTM, User’s and Reference Guide Version<br />
4.4, 2007, Copenhagen<br />
James P.J., Antognozzi M., Tamayo J., McMaster T.J., Newton J.M. and Miles, M.J. (2001):<br />
Interpretation <strong>of</strong> contrast in tapping mode AFM and shear force microscopy. A study <strong>of</strong> Nafion.<br />
Langmuir. (17): 349-360<br />
Johnsen P.O., Skinnarland I., Helle T. and Houen P.J. (1995): Distribution <strong>of</strong> lignin and other materials<br />
on particle surfaces in mechanical pulps. 1995 Int. Mech. Pulp. Conf. (IMPC), Ottawa, Canada, 93-107<br />
Kangas H., Pöhler T., Heikkurinen A. and Kleen M. (2004): Development <strong>of</strong> the mechanical fibre surface<br />
as a function <strong>of</strong> refining energy. J. Pulp Paper Sci. 30(11): 298-306<br />
207
COST Action E54 Book<br />
Kangas H. and Kleen M. (2004): Surface chemical and morphological properties <strong>of</strong> mechanical pulp<br />
fines. Nordic Pulp Paper Res. J. 19(2): 191-199<br />
Karnis A. (1994): The mechanism <strong>of</strong> fibre development in mechanical pulping. J. Pulp Paper Sci. 20(10):<br />
J280-J288<br />
Koljonen K., Österberg M., Johansson L.-S. and Stenius P. (2003): Surface chemistry and morphology <strong>of</strong><br />
different mechanical pulps determined by ESCA and AFM. Colloids and Surfaces A: Physicochem. Eng.<br />
Aspects (228): 143-158<br />
Kollmann F.F.P. and Côté W.A. (1968): Principles <strong>of</strong> wood science and technology: I. Solid Wood.<br />
Springer-Verlag, Berlin<br />
Lidbrandt O. and Mohlin U.-B. (1980): Changes in fiber structure due to refining as revealed by SEM.<br />
IPC Int. Symp. Fundamental Concepts <strong>of</strong> Refining, Appleton, USA, 61-74<br />
Meyer V., Ruel K., Petit-Conil M., Valtat G. and Kurek B. (2004): Modification <strong>of</strong> the cell wall structure<br />
by oxalate associated with energy savings during mechanical pulping. 9th Int. Conf. Biotechnol. Pulp<br />
Paper Ind., Durban, South Africa, 10 – 14 October 2004, pp. 95–96<br />
Meyer V., Ruel K., Kurek B. and Petit-Conil M. (2005): Oxalate pretreatment <strong>of</strong> poplar and spruce chips<br />
before mechanical pulping: Energy savings related to biochemical and ultrastructural modifications. 2005<br />
Int. Mech. Pulping Conf., Oslo, Norway, 7 – 9 June 2005, pp. 102–106<br />
Reme P.A., Helle, T. and Johnsen P.O. (1998): Fibre characteristics <strong>of</strong> some mechanical pulp grades.<br />
Nordic Pulp Paper Res. J. 13(4): 263-268<br />
Snell R., Groom L.H. and Rials T.G. (2001): Characterizing the surface roughness <strong>of</strong> thermomechanical<br />
pulp fibers with atomic force microscopy. Holzforschung 55: 511-520<br />
Stenius P. and Koljonen K. (2008): Surface characterization <strong>of</strong> mechanical pulp fibers by contact angle<br />
measurement, polyelectrolyte adsorption, XPS and AFM. Characterization <strong>of</strong> Lignocellulosic Materials.<br />
In: Hu, T. Q. (Ed.), Characterization <strong>of</strong> Lignocellulosic Materials, Blackwell, Oxford, pp. 36-59<br />
Stout K.J. (2000): Development <strong>of</strong> Methods for the Characterisation <strong>of</strong> Roughness in Three Dimensions,<br />
Penton Press, London<br />
Vehniäinen A. (2008): Single Fiber Properties ─ A Key to the Characteristic Defibration Patterns from<br />
Wood to Paper Fibers. Doctoral thesis, Helsinki University <strong>of</strong> Technology, Espoo, Finland<br />
Österberg M., Schmidt U. and Jääskeläinen A.S. (2006): Combining confocal Raman spectroscopy and<br />
atomic force microscopy to study wood extractives on cellulose surfaces. Colloids and Surfaces A:<br />
Physicochem. Eng. Aspects. (291): 197-201<br />
208
COST Action E54 Book<br />
Chapter 3. Results <strong>of</strong> standard pulp and paper tests on Common<br />
pulps I and II and other fibre materials 209-281<br />
Heinemann S. and Ander P. “Standard pulp and paper tests” 211-232<br />
Heinemann S. and Neclaw A. “Hydrodynamic specific surface area – The<br />
Dresden method and its results for pulps affected by different additives” 233-246<br />
Arndt T., Meinl G. and Erhard K. “Behaviour <strong>of</strong> cellulose fine structures in<br />
papermaking tests” 247-252<br />
Popescu C.-M., Totolin M.I., Tibirna C.M., Popescu M.-C., Ander P. and<br />
Vasile C. “Structural and morphological characterization <strong>of</strong> unmodified and<br />
grafted unbleached and bleached s<strong>of</strong>twood Kraft pulp fibres” 253-266<br />
Cazacu G., Sdrobis A., Pintilie M., Rosu D., Ciolacu D., Totolin M. and Vasile<br />
C. “Swelling and electrokinetic properties <strong>of</strong> unbleached/bleached s<strong>of</strong>twood<br />
Kraft cellulose fibers” 267-281<br />
209
COST Action E54 Book<br />
210
COST Action E54 Book<br />
STANDARD PULP AND PAPER TESTS<br />
1 Sabine Heinemann, 2 Paul Ander<br />
1 P.O. Box 1000, 02044 VTT (Espoo), Finland<br />
2 CRUW, Dept. Forest Products/Wood Science, Swedish Univ. <strong>of</strong> Agricultural Sciences (SLU)<br />
P.O. Box 7008, SE-75007 Uppsala, Sweden<br />
Abstract<br />
sabine.heinemann@vtt.fi and paul.ander@slu.se<br />
Within the COST Action E54 “Characterization <strong>of</strong> the fine structure and properties <strong>of</strong><br />
papermaking fibers using new technologies”, common pulp samples from a Södra Cell pulp mill<br />
were tested applying a variety <strong>of</strong> standard testing methods but also <strong>of</strong> new and unique measuring<br />
technologies. The data were collected and summarized, providing extended knowledge about the<br />
quality <strong>of</strong> that pulp grade like never before.<br />
Introduction<br />
As announced by the title <strong>of</strong> the COST Action, new technologies and unique methods should be<br />
applied to characterize the fine structure and properties <strong>of</strong> papermaking fibers. Two common<br />
pulp samples were selected and distributed to all participating partners who could provide<br />
methods and technologies for fine fiber characterization. To perform all the tests and analyses<br />
with one and the same pulp sample from a common chemical pulp production line opened the<br />
unique opportunity to collect characteristics and information about this pulp exceeding all<br />
experiences so far. The other advantage <strong>of</strong> these efforts was an improved comparability <strong>of</strong> the<br />
applied methods and technologies.<br />
New and unique technologies are presented within this book in separate articles. This article is to<br />
summarize the results from standard measurements. Standard methods in that sense can be<br />
typical laboratory testing methods described e.g. in ISO standards, but also some special<br />
methods which are introduced and proved but common for certain laboratories only.<br />
Common pulp samples<br />
The common pulp was s<strong>of</strong>twood chemical pulp from spruce (Picea abies) and pine (Pinus<br />
sylvestris), delivered in two sample sets, both from a Södra Cell pulp mill in Sweden.<br />
In the first sample set, the percentage relation spruce:pine was 79:21. The trees for that sample<br />
came probably from Southwest Sweden. Pulping was done by batch kraft cooking, the bleaching<br />
sequence was Q(complexing agent) OP Q+PAA(peracetic acid) PO. Also unbleached pulp was<br />
included into the first sample set. The factory sampling was carried out at the end <strong>of</strong> May 2007.<br />
The second sample set was similar to the first one. Only bleached pulp <strong>of</strong> Södra Green 85Z<br />
quality was used. The percentage relation spruce:pine was 81:19, and the factory sampling was<br />
done at the beginning <strong>of</strong> June 2008.<br />
Applied methods<br />
All pulp tests start usually with microscopic inspection for morphological characterization. Light<br />
microscopy with different illumination modes (e.g. polarization, phase contrast, staining in<br />
transmitted light) are the simplest methods and easy to apply. More advanced methods are<br />
211
COST Action E54 Book<br />
Atomic Force Microscopy (AFM) and Electron Microscopy (SEM, ESEM) to get more<br />
information about the small-scale structures <strong>of</strong> the fibers. AFM is also used for fiber surface<br />
characterization.<br />
Fiber dimensions are usually determined by automated fiber analyzers. Several commercial<br />
devices were applied, such as kajaani FiberLab, kajaani FS300, L&W FiberMaster, L&W<br />
FiberTester, MorfiLab and Cyberflex. Within this paper, data from kajaani FiberLab were used.<br />
From the pulp slurries, several drainability parameters were measured (Schopper-Riegler value,<br />
Canadian Standard Freeness, Water Retention Value, Fiber Saturation Point, Specific Filtration<br />
Resistance, Specific Surface area, and Drainage time Rapid Köthen).<br />
The refining resistance was tested with a laboratory beater (JOKRO mill). Additionally, a pilot<br />
scale refiner was used. Handsheets were made for physical testing <strong>of</strong> strength and optical<br />
properties.<br />
Assessment <strong>of</strong> spruce-pine ratio (SLU, Sweden)<br />
The spruce-pine ratio in the common pulp sample was studied by means <strong>of</strong> polarized light<br />
microscopy. This illumination mode is very useful to visualize the typical window pores in pine<br />
earlywood fibers (Figure 1). Additionally, SEM can be applied to characterize fiber cleavage<br />
more detailed (Figure 2).<br />
Figure 1. Earlywood fiber from unbleached pulp (left, magnification 20x), and from bleached pulp (right,<br />
magnification 10x). Typical window pores in pine fibers marked with white arrow, Polarized light<br />
In the Polarized Light method (PLM), fiber images were inspected, and typical pine earlywood<br />
fibers were counted. For example, from 28 counted unbleached earlywood fibers, 8 were<br />
recognised as pine fibers, thus giving 29% pine fibers and subsequently 71% spruce fibers in the<br />
earlywood. From 48 counted bleached earlywood fibers, 13 were found to be from pine, and the<br />
proportion becomes 27% pine fibers and 73% spruce fibers. In another image, when both<br />
earlywood and latewood fibers were present (like Figure 1 right), 91 fibers in total were counted,<br />
from which 19% were pine earlywood fibers, and subsequently 81% spruce earlywood fibers.<br />
The average <strong>of</strong> all these counted proportions gave 25% pine fibers and 75% spruce fibers in the<br />
earlywood. Assuming that the same ratio can also be found from the latewood, one gets 79%<br />
spruce fibers and 21% pine fibers in total.<br />
212
COST Action E54 Book<br />
a b<br />
10 µm<br />
10 µm<br />
Figure 2. SEM-images <strong>of</strong> the cleavage <strong>of</strong> s<strong>of</strong>twood chemical pulp fibres – Further degradation after HCl<br />
attack cleaving both the S1 and S2 fiber walls (a), complete cleavage <strong>of</strong> the fiber, also revealing the cell<br />
lumen (see Ander et al. 2008)<br />
This is the spruce-pine ratio calculated for the first common pulp sample (79:21). The ratio in<br />
the second sample was 81:19. From an earlier Södra Cell pulp, a ratio spruce:pine <strong>of</strong> 84:16 was<br />
found.<br />
HCl-method for cleavage determination (SLU, Sweden)<br />
A standard method to obtain cleavage per fiber was developed (Ander et al 2005; 2008, Ander<br />
and Daniel 2006). The parameter “cleavage per fiber” evaluates dislocations and weak points in<br />
the fiber. It is defined as<br />
L0<br />
Cleavage per fiber � � 1<br />
L<br />
with L0 being the length-weighted fiber length in mm for the control in water, and L the lengthweighted<br />
fiber length in mm for the HCl-treated sample.<br />
Cleavage by HCl shown in the SEM is given in Figure 2 for a s<strong>of</strong>twood kraft pulp (Ander et al.<br />
2008). Cellulases also cleave fibres in dislocations. In addition, cleavage <strong>of</strong> latewood<br />
dislocations by HCl is shown using PLM (Ander et al. 2011).<br />
Procedure<br />
- Never-dried pulp fibers (dry weight 100-250 mg) were swelled for 10-15 minutes in 20<br />
mL water in a 100 mL Erlenmeyer flask and stirred with a 25 mm stirring bar.<br />
- Treatment with 40 mL 1 M HCl pH 0 at 80-82°C for 4h in a reciprocal water bath without<br />
using the stirring bar.<br />
- Completion <strong>of</strong> cleavage with 25 mm stirring bar at 150 rpm for 30 minutes during cooling<br />
to near room temperature.<br />
- Fibre washing with 0.2 M phosphate buffer pH 7 on Munktell filters 1002, 1003 or glass<br />
filters G2 or G3. Polarized light microscopy can be done directly on the cleaved fibres. For<br />
electron microscopy, the fibres must be washed with water to remove the buffer.<br />
- Fiber length analysis with commercial automated fiber analyzer (e.g. FiberMaster or<br />
kajaani FiberLab)<br />
- Calculation <strong>of</strong> the cleavage per fiber from length-weighted fiber lengths<br />
The procedure is illustrated in Figure 3.<br />
213
COST Action E54 Book<br />
Figure 3. Procedure steps <strong>of</strong> the HCl-method for fiber cleavage: Swelling <strong>of</strong> fibers in 20 mL water with<br />
stirring (above left), shaking fiber in 1M HCl for 4 h at 80-81°C in the water bath - plastic lid closed<br />
during treatment (above right), close up <strong>of</strong> water bath (below left), and cooling down with stirring for 30<br />
min (below right)<br />
Drainability by RAPID-KÖTHEN method - RK number (drainage time)<br />
Drainage time according to RAPID-KÖTHEN – shortly called RK number – is a rather old<br />
testing method, which is performed during handsheet forming in Rapid Köthen sheet molds.<br />
There is no standard anymore, but it has once been described as a testing method in the<br />
collection <strong>of</strong> Zellcheming Technical Leaflets (1961). The RK number stands for the time, which<br />
takes a volume <strong>of</strong> 6 L <strong>of</strong> aqueous fiber slurry to drain in the RAPID-KÖTHEN handsheet former<br />
from 8 L to 2 L under atmospheric pressure. The initial pulp consistency is 0.03% which<br />
corresponds to the concentration for a 75 g/m²-handsheet. The testing device and an idealistic<br />
drainage curve are given in Figure 4.<br />
214
COST Action E54 Book<br />
Figure 4. RAPID-KÖTHEN sheet mold – dewatering column (left), and idealistic drainage curve with RK<br />
number<br />
Drainage time can also be measured with conventional sheet formers during handsheet forming,<br />
but the resulting parameter is different to the RK number due to several procedure deviations<br />
(Table 1).<br />
Table 1. Comparison <strong>of</strong> methods for drainage time assessment<br />
Method description<br />
Sheet forming procedure<br />
Procedure point <strong>of</strong><br />
measurement<br />
Applied drainage pressure,<br />
kPa<br />
Applied handsheet grammage,<br />
g/m²<br />
Specific surface area and specific filtration resistance<br />
RK number Drainage time<br />
Zellcheming Technical Leaflet<br />
V/7/61<br />
T221 cm-99 (SCAN-M9:76)<br />
RAPID KÖTHEN sheet former Conventional sheet former<br />
(ISO 5269-2)<br />
(ISO 5269-1)<br />
Drainage time stopped 2 L Drainage stopped when all water<br />
above the screen<br />
has passed through the screen<br />
100 (atmosphere) 27 (vacuum)<br />
75 60<br />
These parameters also characterize the dewatering behavior <strong>of</strong> pulps, but they have been used<br />
more to describe the bonding ability <strong>of</strong> the fibers, e.g. to predict static strength properties (tensile<br />
index, breaking length). The methods to determine both parameters have been developed rather<br />
parallel.<br />
Specific surface area is the result <strong>of</strong> the permeability method, which was in this sense first<br />
published about 60 years ago (Robertson and Mason 1949, Mason 1950), and mainly applied on<br />
mechanical pulps (Brecht and Schanz 1957, Forgacs 1963). More details about this parameter<br />
“hydrodynamic specific surface area” can be found from elsewhere in this book (Heinemann and<br />
Neclaw 2011). The tests in this investigation <strong>of</strong> the common pulp sample were performed with<br />
the Dresden Permeability Tester (Heinemann 1985).<br />
215
COST Action E54 Book<br />
Specific filtration resistance is the result <strong>of</strong> the filtration method (Ingmanson 1952, Ingmanson<br />
and Whitney 1954, Ingmanson and Andrews 1959). A special apparatus for the characterization<br />
<strong>of</strong> mechanical pulp was developed by Mannström (1967, 1972) and was also used for the pulp<br />
tests.<br />
There are essential differences between the two methods.<br />
Specific surface area is understood as the surface area <strong>of</strong> fibers in a compressed water-swollen<br />
fiber pad that is accessible for flowing water molecules, and thus, the so called hydrodynamic<br />
specific surface area is a function <strong>of</strong> the flow rate through a fiber pad. Because the flow rate is<br />
measured AFTER building-up the fiber pad for different compressions steps, there is no effect <strong>of</strong><br />
fiber conformability during the measurement. The resulting parameter is given as specific<br />
surface area in m²/g.<br />
The filtration method estimates specific surface area from the filtration behavior <strong>of</strong> fiber slurries<br />
based on the principle <strong>of</strong> cake filtration, which means a complete deposition <strong>of</strong> the solid material<br />
onto the filter medium and building <strong>of</strong> a filter cake proportionally to the corresponding filtrate<br />
volume with the cake structure remaining constant. The resulting specific filtration resistance is<br />
thus a function <strong>of</strong> the flow rate during fiber pad (cake) creation. Because the flow rate is<br />
measured DURING building up the fiber pad by defined drainage <strong>of</strong> a fiber suspension over a<br />
wire screen, the effect <strong>of</strong> fiber conformability cannot be neglected. No constant height <strong>of</strong> the<br />
fiber pad (or filter cake) can be adjusted, therefore the specific filtration resistance is given in<br />
m/g.<br />
Dimension-based parameters<br />
All dimension-based parameters reported in this paper were measured with kajaani FiberLab.<br />
Additionally to the basis parameters fiber length, fiber width and fiber wall thickness, further<br />
parameters were calculated and discussed.<br />
• Aspect ratio<br />
The parameter “Aspect ratio” AR is normally used for non-fibrous particles. Applied to fibers, it<br />
is an expression for the “slenderness” <strong>of</strong> the material. The smaller the value the more thread-like<br />
are the particles.<br />
Fiber width<br />
AR �<br />
�<br />
Fiber length<br />
W<br />
L C, i<br />
• Mork’s value<br />
The parameter “Mork’s value MV” is not widely known as such. The original idea was to<br />
separate earlywood and latewood fibers within a pulp sample and giving proportions <strong>of</strong> the fiber<br />
types (Mork 1928). A fiber with a lumen at least as wide as the double fiber wall thickness CWT<br />
was declared to be earlywood. In practical cases, fibers with only marginal differences in lumen<br />
size and double fiber wall thickness, which were classified to be earlywood, <strong>of</strong>ten behaved like<br />
latewood. That is why it is better to use the mean value <strong>of</strong> all calculated Mork’s values <strong>of</strong> the<br />
respective fibers instead <strong>of</strong> a summarized proportion. Additionally, a deviation <strong>of</strong> this value can<br />
be provided (Heinemann and Vehniäinen 2009).<br />
MV<br />
�<br />
Fiber wall thickness<br />
Lumen<br />
2�<br />
CWT<br />
�<br />
(W � 2�<br />
CWT)<br />
216
• Cell wall index CWI<br />
COST Action E54 Book<br />
The cell wall index is something similar like the Mork’s value, but it is related to the fiber<br />
width instead <strong>of</strong> fiber lumen.<br />
Fiber wall thickness 2�<br />
CWT<br />
CWI �<br />
�<br />
Fiber width W<br />
• Cross-sectional area CSA, volume index VI<br />
The cross-sectional area CSA and the volume index VI are standard parameters delivered from<br />
kajaani FiberLab in the cross-sectional parameter package. These values consider a fiber to<br />
have a circular shaped cross-section.<br />
The cross-sectional area CSA is therefore calculated as annulus from fiber width W and fiber<br />
wall thickness CWT. The volume index VI describes then a tube with the cross-section CSA and<br />
the central-line length <strong>of</strong> the respective fiber.<br />
CSA � � �CWT(<br />
W � CWT )<br />
VI � CSA�<br />
L<br />
External fibrillation<br />
c<br />
External fibrillation occurs to fibers undergoing mechanical treatments such as refining. Parts <strong>of</strong><br />
the outer fiber wall are opened or released; the fibrils <strong>of</strong> the inner fiber wall become accessible<br />
and can be separated from their original position in the fiber wall. Figure 5 shows such<br />
fibrillated fibers how they appear in the light microscope.<br />
a b<br />
Fibrils released from fiber surface<br />
Fibrils still connected to the fiber surface<br />
Figure 5. External fibrillation <strong>of</strong> s<strong>of</strong>twood fibers from long fiber fractions. Fibrils released from or<br />
slightly attached to the fibers (a), fibrils still strongly attached to the fibers (b) (micrographs: VTT/KCL)<br />
Fibrillation index is a parameter provided by automated fiber analyzer kajaani FiberLab. It is<br />
defined as the ratio between the area <strong>of</strong> fibrils and the total fiber area in the evaluated image:<br />
Fibrillation<br />
index<br />
A<br />
�<br />
A<br />
fibril �<br />
total<br />
100%<br />
217
COST Action E54 Book<br />
Only fibers with attached fibrils are considered (such as shown in image b <strong>of</strong> Figure 5). Released<br />
fibrils are recorded either as short fibers or as fines depending on their length and visibility<br />
(optical contrast).<br />
Assessment <strong>of</strong> the refining resistance<br />
For the assessment <strong>of</strong> the refining resistance, the bleached pulp from the second sample set was<br />
treated in the JOKRO mill at Dresden University <strong>of</strong> Technology for 15, 45, and 60 minutes. The<br />
resulting pulps were tested in Dresden and at VTT (KCL) in Finland according to the trial plan<br />
shown in Figure 6. Some part <strong>of</strong> the pulp was also refined in the laboratory refiner at PTS<br />
Heidenau/Germany.<br />
• Spec filtration resistance<br />
Pulp JOKRO 15, 45, 60 min<br />
• SR, CSF, WRV, spec. surface area<br />
• Rapid Köthen number (RK number)<br />
• FiberLab, coarseness<br />
• Grammage, thickness, bulk density<br />
• Tear strength Brecht‐Imset<br />
• Optical properties<br />
• Tensile strength<br />
• Zero‐span strength (dry)<br />
• Scott bond (mod. Huygen)<br />
• Conventional handsheets 60 g/m²<br />
VTT (KCL) Dresden University <strong>of</strong> Technology<br />
Figure 6. Testing program <strong>of</strong> refining resistance with laboratory equipment. Blue: Trials performed at<br />
VTT(KCL), red: trials performed at Dresden University <strong>of</strong> Technology<br />
• JOKRO mill<br />
The JOKRO mill is a laboratory device for classifying pulp characterization and quality control.<br />
It was developed approx. 80 years ago by Jonas and Kross (Jonas 1933). Several investigations<br />
were done with that laboratory apparatus in comparison with former laboratory beaters (Ekstam<br />
1957, Jayme and Buettel 1965, Hechler 1968), but in principle, this laboratory mill has not been<br />
changed neither in design nor in working procedure since more than 30 years (Kleinert 1977). It<br />
is a standardized machine (DIN 54360) and preferably used in German speaking regions <strong>of</strong><br />
Europe. Figure 7 shows the JOKRO mill design; Table 2 compares the applied standard beating<br />
conditions with those <strong>of</strong> the PFI mill. The only measurable variable <strong>of</strong> the JOKRO mill<br />
procedure is the treatment time.<br />
218
COST Action E54 Book<br />
The beating is performed at the upper limit <strong>of</strong> LC refining (6%). The beating pressure is<br />
determined by the centrifugal forces given by the rotational speed <strong>of</strong> the beating roll (2.85 rps),<br />
and the beating gap is determined by centrifugal forces and oven-dry sample mass.<br />
Figure 7. JOKRO mill – design<br />
Table 2. Standard design and procedure parameters <strong>of</strong> the JOKRO mill in comparison with the PFI mill<br />
Beating tool in scaled size<br />
JOKRO mill PFI mill<br />
External diameter <strong>of</strong> the beating roll 89.15 mm 201 mm<br />
Number <strong>of</strong> bars 35 33<br />
Bar width 2 mm 5 mm<br />
Groove width / groove depth 6 mm / 3 mm 14 mm / 30 mm<br />
Bar length 60 mm 50 mm<br />
Surface <strong>of</strong>t he container Knurled 55° Smooth<br />
Material <strong>of</strong>t he beating container Bronze Stainless steel<br />
Net beating pressure n.m. 3.33 N/mm<br />
Rotational speed <strong>of</strong> the beating roll 2.85 rps 24.3 rps<br />
Oven-dry pulp sample per run 6 x 16 g = 96 g 30 g<br />
Water quality 1) Distilled water, 20°C<br />
Standard water<br />
(ISO 14487), 20°C<br />
Initial pulp consistency 6 % (60 g/L) 10 % (100 g/L)<br />
• PTS Laboratory refiner<br />
The PTS laboratory refiner belongs to the small-scale pilot machines for simulation purposes. It<br />
is shown in Figure 8. Selected parameters applied for the performed pulp treatment are<br />
summarized in Table 3. Only one refining point was carried out.<br />
219
Figure 8. PTS laboratory refiner (courtesy <strong>of</strong> PTS)<br />
COST Action E54 Book<br />
Table 3. Selected parameters applied for the performed pulp treatment in the PTS Refiner<br />
Type Disc<br />
Consistency 4 %<br />
Specific edge load 2 Ws/m<br />
Cutting length per second 2.85 km/s<br />
Cutting angle 60°<br />
Specific refining energy 150 kWh/t<br />
Results and Discussion<br />
Unrefined samples<br />
• Microscopic appearance<br />
Unrefined unbleached fibers were inspected with FIB-SEM technology (Orlandi 2007). Clear<br />
differences were seen between moist (above) and dried (below) fibers in Figure 9.<br />
Straight fibers with smooth surfaces are found for the moist pulp. Dislocation regions can be<br />
specified (red arrows in Figure 9a).<br />
Free drying forms typically extremely twisted fibers (Figure 9c) with surface shrinkage and<br />
closed bordered pits (white arrows in Figure 9d).<br />
• Results from chemical and physical testing<br />
The results <strong>of</strong> pulp testing are summarized for the unbleached and the two bleached samples in<br />
Table 4. Table 4a contains the chemical characteristics, drainability data and parameters from<br />
automated fiber analysis with kajaani FiberLab. Table 4b collects the results <strong>of</strong> handsheet testing<br />
– parameters <strong>of</strong> strength and optical properties. The results from carbohydrate analysis are found<br />
in Table 4c.<br />
220
COST Action E54 Book<br />
Figure 9. FIB-SEM appearance <strong>of</strong> the unbleached pulp sample: initial wet (above), and dried (below).<br />
Dislocation regions (red arrows), surface shrinkage and closed bordered pits (white arrows) can be<br />
specified (see Orlandi 2007)<br />
221
COST Action E54 Book<br />
Table 4a. Characteristics <strong>of</strong> the unrefined common pulp – chemical and physicochemical parameters,<br />
drainability data, and parameters from dimensional measurements with automated fiber analyzer kajaani<br />
FiberLab<br />
Sample (set number)<br />
Unbleached (1) Bleached (1) Bleached (2)<br />
Sampling time<br />
May 2007 May 2007 June 2008<br />
Total charge/Carboxyl groups meq/kg 81 58<br />
Surface charge PolyDADMAC meq/kg 20 24<br />
Intrinsic viscosity mL/g 1109 728<br />
Kappa number 26.8 3.2<br />
Lignin % 4.0 --- ---<br />
Cleavage/fiber 3.62 6.11 ---<br />
SR units --- --- 12<br />
CSF mL 730 720 742<br />
Specific filtration resistance 10 8 m/g --- --- 16<br />
Specific surface area m²/g 1.02 1.16 1.09<br />
Water retention value TUD g/g 1.35 1.25 0.99<br />
Water retention value VTT g/g 1.59 1.43 1.16<br />
Fiber saturation point FSP g/g 1.25 1.18 ---<br />
Drainage time RK s --- --- 2.0<br />
Arithmetic central-line fiber<br />
length (FiberLab)<br />
µm 1200 1150 1100<br />
Length-w. central-line fiber<br />
length LC (FiberLab)<br />
µm 2460 2370 2370<br />
Fiber width W (FiberLab) µm 29.3 27.8 26.64<br />
Fiber wall thickness CWT<br />
(FiberLab)<br />
µm 8.2 7.9 8.18<br />
Aspect ratio (FiberLab) 40.96 41.37 41.291<br />
Mork's value (FiberLab) --- --- 1.593<br />
CSA (FiberLab) µm² --- --- 91.52<br />
Fiber wall index CWI<br />
--- --- 0.614<br />
(FiberLab)<br />
BMcNett R16 % 48.3 43.8 ---<br />
BMcNett R30 % 36.1 38.6 ---<br />
BMcNett R50 % 9.9 10.6 ---<br />
BMcNett R100 % 3.7 4.1 ---<br />
BMcNett D100 % 2 2.9 ---<br />
<strong>Fine</strong>s (FiberLab) % --- --- 33.37<br />
Length-w. fines (FiberLab) % 2.6 2.7 3.12<br />
Volume index VI (FiberLab) 10³ µm³ --- --- 96.2<br />
Coarseness µg/m --- --- 237<br />
Curl index (FiberLab) % 15.1 20.2 21.6<br />
Fibrillation index (FiberLab) % --- --- 3.253<br />
222
COST Action E54 Book<br />
Table 4b. Characteristics <strong>of</strong> the unrefined common pulp – parameters <strong>of</strong> strength and optical properties,<br />
measured from laboratory handsheets<br />
Sample (set number)<br />
Sampling time<br />
Unbleached (1)<br />
May 2007<br />
Bleached (1)<br />
May 2007<br />
Bleached (2)<br />
June 2008<br />
Apparent bulk density kg/m³ 528 559 455<br />
Bulk (stack) cm³/g 1.9 1.79 2.20<br />
Tensile index Nm/g 29.8 27.5 15.9<br />
Stretch % 2.1 3.4 2.4<br />
Tensile energy absorption<br />
index (TEA index)<br />
J/g 0.479 0.748 0.296<br />
Tensile stiffness index kNm/g 4.59 3.81 2.48<br />
Modulus <strong>of</strong> elasticity N/mm² 2420 2129 1128<br />
Breaking length km 3.04 2.81 1.62<br />
Tear-Index (Elmendorf) mNm²/g 20.2 20.3 ---<br />
Tear-Index (Brecht-Imset) mNm²/g --- --- 17.08<br />
Internal bond mod. Huygen J/m² 100 132 77<br />
Zero-span tensile index wet Nm/g 135 101 123<br />
Brightness R457 % --- --- 85.86<br />
Opacity % --- --- 74.42<br />
Transparency % --- --- 30.60<br />
Light-scattering coeff. m²/kg --- --- 33.41<br />
Light-absorption coeff. m²/kg --- --- 0.11<br />
CIELab L* --- --- 96.95<br />
CIELab a* (green) --- --- -0.62<br />
CIELab b* (yellow) --- --- 4.86<br />
Table 4c. Characteristics <strong>of</strong> the unrefined common pulps – Results from carbohydrate analysis, done by<br />
Stora Enso, Karlstad, Sweden<br />
Sample (set number)<br />
Sampling time<br />
Unbleached (1)<br />
May 2007<br />
Bleached (1)<br />
May 2007<br />
Bleached (2)<br />
June 2008<br />
Arabinose % 0.7 0.6 0.6<br />
Galactose % 0.4 0.2 0.2<br />
Glucose % 84.0 85.1 85.2<br />
Xylose % 7.9 7.5 7.3<br />
Mannose % 7.0 6.6 6.7<br />
Arabinose anhydro mass-% 0.6 0.6 0.6<br />
Galactose anhydro mass-% 0.4 0.2 0.2<br />
Glucose anhydro mass-% 78.8 83.7 83.8<br />
Xylose anhydro mass-% 7.3 7.2 7.0<br />
Mannose anhydro mass-% 6.6 6.5 6.5<br />
Total carbohydrates anhydro mass-% 93.6 98.1 98.2<br />
Klason lignin % 3.9 0.2 0.1<br />
Acid soluble lignin (205 nm) mass-% 0.5 0.5 0.6<br />
223
Refined samples<br />
Microscopic characterization<br />
COST Action E54 Book<br />
Figure 10. Microscopic appearance <strong>of</strong> pulp fibers in modified polarized light. a) cut earlywood pine fiber<br />
in the unrefined sample, b) smooth and untouched fiber surface in the unrefined sample, c) outer<br />
fibrillation starts slightly after 15 min JOKRO mill beating, d) more external fibrillation after 45 min<br />
JOKRO mill beating, e) strong peeling effects after 60 min JOKRO mill beating, f) strong internal<br />
fibrillation after 60 min JOKRO mill, fiber structure disappears partly<br />
Figure 10 shows special features seen in the light microscope developed with the refining<br />
treatment. Modified polarized light was used to improve the visibility <strong>of</strong> details (position <strong>of</strong><br />
polarization filters less than 90° and λ¼-filter).<br />
224
COST Action E54 Book<br />
Already in the unbeaten pulp, non-intact fibers were found to a certain extend. This could be<br />
caused by mechanical impact from disintegration which might affect the fibers in their weakest<br />
points (Figure 10a). But the greater part <strong>of</strong> the fibers was untouched with a smooth surface as<br />
seen in Figure 10b. Dislocation areas could easily be distinguished. After 15 minutes beating<br />
time, outer fibrillation started slightly (Figure 10c) and increased clearly when the treatment<br />
continued (Figure 10d, 45 minutes). After 60 minutes, external fibrillation can appear like partly<br />
peeled parts <strong>of</strong> the outer fiber wall (Figure 10e). That also internal fibrillation takes place, shows<br />
the fiber in Figure 10f, where the fiber wall structure partly disappeared. Even in this low<br />
magnification, the fibrilar structure <strong>of</strong> the total fiber wall can be recognized.<br />
Drainability behavior<br />
The development <strong>of</strong> pulp quality with any refining treatment is traditionally followed by the<br />
development <strong>of</strong> drainability using either Schopper-Riegler value or CSF. Although these<br />
parameters are so complex that they cannot react as sensitive to process effects as they should,<br />
also in this report, Schopper-Riegler is used as the basis parameter to follow the property<br />
development in the JOKRO beating.<br />
All results concerning drainability are summarized in Figure 11.<br />
As expected, JOKRO beating increased dewatering resistance. Linearity was found between RK<br />
number and Schopper-Riegler, non-linearity between CSF and Schopper-Riegler (Figure 11a).<br />
Specific filtration resistance and specific surface area increase with Schopper-Riegler, specific<br />
filtration resistance linearly like RK number (Figure 11b). Swelling occurred immediately after<br />
the treatment start as seen with water retention value (Figure 11c). This can be explained by<br />
immediate start <strong>of</strong> peeling reaction – removal or opening <strong>of</strong> the resistant outer fiber wall gives<br />
access for the water to the swellable inner fiber wall (see also Figure 12c, where peeling is<br />
explained as decrease <strong>of</strong> fiber wall thickness).<br />
PTS refining produced pulp with comparable parameters for Schopper-Riegler, CSF, RK<br />
number, specific filtration resistance and specific surface area (bright dots in Figure 11). But<br />
swelling was different, with the same explanation (see Figure 12c).<br />
Fiber dimensions and related parameters<br />
Fiber dimensions and calculated dimension-based parameters are summarized in Figure 12.<br />
Fiber length decreased gently with refining (Figure 12a). Fiber width decreased with refining as<br />
a result <strong>of</strong> the peeling (Figure 12b). Also Aspect Ratio decreased, which means that peeling<br />
exceeded fiber shortening – the fibers became slender with refining (Figure 12b). Fiber wall<br />
thickness decreased as result <strong>of</strong> peeling (Figure 12c). Mork’s value MV (Figure 12c) and Fiber<br />
wall index CWI (Figure 12d) show similar curve shapes – strong decrease in the beginning <strong>of</strong><br />
the treatment and then constancy throughout the rest <strong>of</strong> the refining process. Mork’s value MV<br />
and fiber wall index CWI are two-dimensional parameters. Cross-sectional area CSA is based on<br />
a three-dimensional model (annulus), and thus with somewhat different response on refining<br />
(Figure 12d).<br />
225
Canadian Standard Freeness CSF, mL<br />
Water retention value, g/g<br />
900<br />
600<br />
300<br />
0<br />
2.0<br />
1.5<br />
1.0<br />
0.5<br />
0.0<br />
0 20 40 60<br />
Schopper‐Riegler value<br />
0 20 40 60<br />
Schopper‐Riegler value<br />
9<br />
6<br />
3<br />
0<br />
Drainage time RK, s<br />
Specific filtration resistance, 10 8 m/g<br />
COST Action E54 Book<br />
180<br />
120<br />
60<br />
a b<br />
c<br />
0<br />
0 20 40 60<br />
Schopper‐Riegler value<br />
Figure 11. Development <strong>of</strong> drainability behavior versus Schopper-Riegler – Canadian Standard Freeness<br />
CSF and RK number (a), specific filtration resistance and specific surface area (b), and water retention<br />
value (c). Dark dots: JOKRO beating, bright dots: PTS refining<br />
Fiber length, µm<br />
Fiber wall thickness, µm<br />
3 000<br />
2 500<br />
2 000<br />
1 500<br />
1 000<br />
500<br />
0<br />
8.4<br />
8.2<br />
8.0<br />
7.8<br />
7.6<br />
7.4<br />
7.2<br />
arithmetic<br />
length‐weighted<br />
0 20 40 60<br />
Schopper‐Riegler value<br />
0 20 40 60<br />
Schopper‐Riegler value<br />
Fiber width, µm<br />
27<br />
26<br />
25<br />
a b<br />
1.8<br />
1.6<br />
1.4<br />
1.2<br />
1.0<br />
0.8<br />
0.6<br />
Mork's value<br />
CSA, µm²<br />
c d<br />
24<br />
93<br />
91<br />
89<br />
87<br />
85<br />
0 20 40 60<br />
Schopper‐Riegler value<br />
0 20 40 60<br />
Schopper‐Riegler value<br />
Figure 12. Fiber dimensions, measured with and calculated from kajaani FiberLab - Fiber length (a),<br />
fiber width and aspect ratio (b), fiber wall thickness and Mork’s value (c), and cross-sectional area CSA<br />
and cell wall index (d). Dark dots: JOKRO beating, bright dots: PTS refining<br />
226<br />
9<br />
6<br />
3<br />
0<br />
50<br />
40<br />
30<br />
20<br />
0.8<br />
0.7<br />
0.6<br />
0.5<br />
0.4<br />
Specific surface area, m²/g<br />
Aspect ratio<br />
Cell wall index
COST Action E54 Book<br />
PTS refining produced pulp with different swelling behavior (see Figure 11c). But this high<br />
swelling was not connected to lower fiber width or fiber wall thickness (Figure 12b and Figure<br />
12c). The fibers have obviously a hydroskin, which causes apparent higher values for crosssectional<br />
dimensions. This affects also the values <strong>of</strong> calculated data such as cross-sectional area<br />
CSA (Figure 12d). A slightly lower length-weighted fiber length and this apparent high fiber<br />
width lead to similar Aspect ratio (Figure 12b).<br />
Distribution curves <strong>of</strong> the length-weighted fiber length (Figure 13) show that there is no<br />
immediate response on refining considering fiber length. The distribution curves <strong>of</strong> the unrefined<br />
sample (SR 12) and that after 15 min JOKRO beating (SR 15) are rather similar.<br />
Percentage<br />
10<br />
8<br />
6<br />
4<br />
2<br />
0<br />
0 2000 4000 6000 8000<br />
Length‐w. fiber length, µm<br />
SR 12 SR 15 SR 33 SR 55<br />
Figure 13. Distribution <strong>of</strong> length-weighted fiber length, measured with kajaani FiberLab<br />
The peeling <strong>of</strong> the fiber wall as described in Figure 12 is one source for the fines production,<br />
which is a usual effect <strong>of</strong> chemical pulp refining. The development <strong>of</strong> fines is shown in Figure<br />
14a. Like the peeling occurred more in the beginning <strong>of</strong> refining, also the production <strong>of</strong> fines is<br />
higher in the beginning <strong>of</strong> the refining treatment (blue curve in Figure 14a). The strong increase<br />
in length-weighted fines (red curve in Figure 14a) corresponds to an increasing creation <strong>of</strong><br />
thread-like fibrilar fines. PTS refining produced lower fines amount.<br />
The refining type – fibrillating or cutting – can be characterized by fiber length (length-weighted<br />
fiber length) and bonding ability (specific surface area). Figure 14b gives a theoretical idea about<br />
the refining types. For the application <strong>of</strong> that theory to the sample pulp, relative values were<br />
calculated for length-weighted central-line fiber length and specific surface area, always based<br />
on the values <strong>of</strong> the unrefined pulp. The result is shown in Figure 14c. A slight decrease <strong>of</strong> fiber<br />
length and a strong increase <strong>of</strong> specific surface area stand for preferably fibrillation during the<br />
refining procedure.<br />
This fibrillation is confirmed by the increasing fibrillation index (Figure 15b).<br />
227
<strong>Fine</strong>s proportion, %<br />
b<br />
50<br />
40<br />
30<br />
20<br />
10<br />
0<br />
Length‐w. fiber length L C<br />
a<br />
0 20 40 60<br />
Schopper‐Riegler value<br />
fibers preferably<br />
fibrillated<br />
fibers preferably cut<br />
Specific surface area<br />
10<br />
8<br />
6<br />
4<br />
2<br />
0<br />
Lenght‐weighted fines proportion, %<br />
Rel. length‐weighted fiber length<br />
COST Action E54 Book<br />
1.0<br />
0.9<br />
0.8<br />
0.7<br />
0.6<br />
0.5<br />
0.4<br />
0.3<br />
0.2<br />
0.1<br />
0.0<br />
1 3 5 7 9<br />
Rel. specific surface area<br />
Figure 14. Development <strong>of</strong> the fines proportion (a). Characterization <strong>of</strong> the refining type by fiber<br />
dimensions (length-weighted fiber length) and bonding ability (specific surface area) – theoretically (b),<br />
and for the performed JOKRO beating (c). Dark dots: JOKRO beating, bright dots: PTS refining<br />
Volume index, 10³ µm³<br />
120<br />
100<br />
80<br />
60<br />
40<br />
20<br />
0<br />
0 20 40 60<br />
Schopper‐Riegler value<br />
360<br />
300<br />
240<br />
180<br />
120<br />
60<br />
0<br />
Coarseness, µg/m<br />
Curl index, %<br />
25<br />
23<br />
21<br />
19<br />
17<br />
a b<br />
15<br />
0 20 40 60<br />
Schopper‐Riegler value<br />
Figure 15. Further parameters from automated fiber analysis with kajaani Fiberlab - Volume index VI<br />
and coarseness (a), curl index and fibrillation index (b). Dark dots: JOKRO beating, bright dots: PTS<br />
refining<br />
Coarseness is a parameter that also tells something about the fiber response in refining.<br />
Considering the fiber wall density as constant, this value also can describe whether a refining is<br />
more <strong>of</strong> the cutting or <strong>of</strong> the fibrillation type. The smaller the change <strong>of</strong> coarseness the higher<br />
the proportion <strong>of</strong> cut fibers. The clear decrease <strong>of</strong> coarseness confirmed the preferably<br />
fibrillation treatment in the JOKRO mill (Figure 15a).<br />
For a reliable coarseness measurement, the initial sample concentration (oven-dry sample mass)<br />
has to be provided as exact as possible before the test, and the test itself has to be performed<br />
without blockage <strong>of</strong> the capillary system. Because this is not always possible, the parameter<br />
volume index VI can be used as well. The volume index VI developed in the same tendency<br />
228<br />
c<br />
5<br />
4<br />
3<br />
2<br />
1<br />
0<br />
Fibrillation index, %
COST Action E54 Book<br />
(Figure 15a). There is also a close connection between volume index and aspect ratio when<br />
calculated from the same basis data (see Figure 12b).<br />
The curl index describes the deviation <strong>of</strong> the fiber direction along the fiber length axis from a<br />
straight line. It is calculated from the relation between projected fiber length and central-line<br />
fiber length. Refining energy causes fiber straightening in the most cases, which can also be seen<br />
for the common pulp sample at the beginning <strong>of</strong> the treatment (Figure 15b). PTS refining did not<br />
cause fiber straightening.<br />
Strength properties<br />
Conventional handsheets were produced according to standard ISO 5269-1. From the sheets,<br />
strength parameters and optical properties were tested.<br />
Strength properties are summarized in Figure 16.<br />
Tensile index, zero-span wet tensile index (Figure 16a), tensile stiffness index and modulus <strong>of</strong><br />
elasticity (Figure 16b), stretch (Figure 16c), and internal bond (Figure 16d) increased with<br />
refining, especially at the beginning <strong>of</strong> the treatment. The development <strong>of</strong> bonding ability in zdirection<br />
is strongly correlating with the fibrilar character <strong>of</strong> the fines (see Figure 16a). Bulk<br />
decreases at the beginning <strong>of</strong> refining with decreasing fiber wall thickness and increasing fines<br />
proportion (Figure 16c). Unfortunately, the available dimension-based parameters cannot<br />
describe real fiber flexibility.<br />
Tear index was measured with the standardized Brecht-Imset apparatus (DIN 53115). This<br />
tearing test is more related to the practical tearing behavior <strong>of</strong> a paper than the Elmendorf-test<br />
(Brecht and Imset 1933, Seth and Blinco 1990). The common pulp sample shows the typical<br />
shape <strong>of</strong> a Brecht-Imset tearing curve (Figure 16d). The maximum occurs when long AND<br />
fibrillated fibers are in the sample, which happened in the beginning <strong>of</strong> the refining treatment.<br />
Tensile index, Nm/g<br />
Bulk, cm³/g<br />
100<br />
80<br />
60<br />
40<br />
20<br />
0<br />
2.5<br />
2.0<br />
1.5<br />
1.0<br />
0.5<br />
0.0<br />
0 20 40 60<br />
Schopper‐Riegler value<br />
0 20 40 60<br />
Schopper‐Riegler value<br />
200<br />
160<br />
120<br />
80<br />
40<br />
0<br />
Zero‐span tensile index wet, Nm/g<br />
Tensile stiffness index, kNm/g<br />
10<br />
8<br />
6<br />
4<br />
2<br />
a b<br />
2.8<br />
2.7<br />
2.6<br />
2.5<br />
2.4<br />
2.3<br />
Stretch, %<br />
Internal bond mod. Huygen, J/m²<br />
0<br />
500<br />
400<br />
300<br />
200<br />
100<br />
0 20 40 60<br />
Schopper‐Riegler value<br />
c d<br />
0<br />
10000<br />
8000<br />
6000<br />
4000<br />
2000<br />
0 20 40 60<br />
Schopper‐Riegler value<br />
Figure 16. Strength properties <strong>of</strong> handsheets – Tensile index and zero-span wet tensile index (a), tensile<br />
stiffness index and modulus <strong>of</strong> elasticity (b), bulk and stretch (c), and internal bond and tear index (d)<br />
229<br />
0<br />
50<br />
40<br />
30<br />
20<br />
10<br />
0<br />
Modulus <strong>of</strong> elasticity, N/mm²<br />
Tear index (Brecht‐Imset), mNm²/g
R 457, %<br />
87<br />
85<br />
83<br />
81<br />
79<br />
0 20 40 60<br />
Schopper‐Riegler value<br />
98<br />
97<br />
96<br />
95<br />
94<br />
CIELab L*<br />
Opacity, %<br />
COST Action E54 Book<br />
a b<br />
direction <strong>of</strong> property<br />
developmentby refining<br />
7.0<br />
6.0<br />
5.0<br />
4.0<br />
3.0<br />
2.0<br />
CIELab b* (yellow)<br />
Light‐scattering coeff., m²/kg<br />
80<br />
75<br />
70<br />
65<br />
60<br />
55<br />
50<br />
40<br />
30<br />
20<br />
10<br />
0 20 40 60<br />
Schopper‐Riegler value<br />
c 1.0<br />
d<br />
0.0<br />
0<br />
0.1<br />
‐1.50 ‐1.00 ‐0.50 0.00<br />
0 20 40 60<br />
CIELab a* (green)<br />
Schopper‐Riegler value<br />
Figure 17. Optical properties <strong>of</strong> handsheets – Brightness R457 and lightness L* (a), opacity and<br />
transparency (b), color position in the CIELab system (c), and light-scattering and light-absorption<br />
coefficients (d)<br />
Optical properties<br />
Optical properties <strong>of</strong> the handsheets are summarized in Figure 17. Refining decreases brightness,<br />
seen for the two corresponding parameters R457 and L* (Figure 17a). A drop in brightness is<br />
usually connected with an increase <strong>of</strong> the light-absorption coefficient (Figure 17d). Opacity,<br />
transparency and light-scattering coefficient are affected by the sheet structure. After the first<br />
value drop, these parameters remained constant throughout the subsequent refining process<br />
(Figure 17b and Figure 17d). The same tendency could be seen for the development <strong>of</strong> the<br />
handsheet density (bulk, Figure 16c): The denser the sheet the lower light scattering and<br />
porosity. The color position <strong>of</strong> the sample in the CIELab system was determined for the<br />
unrefined sample (Figure 17c). The name <strong>of</strong> the pulp brand “Södra green” was confirmed,<br />
because the color position was found for the green-yellow quadrant. The brightness drop and the<br />
increase <strong>of</strong> light absorption are also seen in the color development – with refining, the color<br />
position moves towards higher color saturation, i.e. the sample becomes darker.<br />
Conclusions<br />
A lot <strong>of</strong> data were collected from the common pulp samples. The focus in this paper was on<br />
refining behavior in laboratory scale (JOKRO mill).<br />
At the beginning <strong>of</strong> the refining treatment, fibers became more straight (strong decrease <strong>of</strong> curl<br />
index), and only cross-sectional dimensions were changed (strong decrease <strong>of</strong> fiber width and<br />
fiber wall thickness).<br />
230<br />
50<br />
45<br />
40<br />
35<br />
30<br />
25<br />
20<br />
0.3<br />
0.3<br />
0.2<br />
0.2<br />
Transparency, %<br />
Light‐absorption coeff., m²/kg
COST Action E54 Book<br />
Changes towards shorter fiber length occurred later in the refining procedure. But also the<br />
peeling effect continued, and fibrilar fines were produced. It cannot be proved whether the lower<br />
mean value for fiber length comes from fiber shortening (cutting) or whether it comes from a<br />
higher proportion <strong>of</strong> released coarse fibrils long enough to be classified as short fibers. The<br />
decrease in cross-sectional dimensions speaks for this possibility.<br />
The pulp response on mechanical treatment as performed in a JOKRO mill (and also in the PTS<br />
Refiner) is preferably fibrillation due to slight decrease in fiber length and significant increase in<br />
bonding ability (specific surface area).<br />
Acknowledgements<br />
The work reported in this article and done in COST Action E54 was performed using three<br />
Common Pulp samples obtained from Södra Cell, Sweden through Karin Sjöström at Södra Cell.<br />
We are very grateful for this support, which made it possible, in a unique way, to analyse<br />
s<strong>of</strong>twood pulp fibres in great detail. Lignin and sugar analysis <strong>of</strong> the pulps were performed at<br />
Stora Enso, Karlstad through Leif Boussard and Jennie Dufva at R&D services, which we<br />
acknowledge.<br />
The research <strong>of</strong> PA was carried out within CRUW (Cooperative Research on the Ultrastructure<br />
<strong>of</strong> Wood <strong>Fibres</strong>) with financial support from VINNOVA’s Branch Research Program and six<br />
supporting pulp and paper and chemical industries (Eka Chemicals, Holmen, SCA, Smurfit<br />
Kappa, Stora Enso and Södra Cell).<br />
References<br />
Ander P., Daniel G., Garcia-Lindgren C. and Marklund A. (2005): Characterization <strong>of</strong> industrial and<br />
laboratory pulp fibres using HCl, Cellulase and FiberMaster analyses. Nordic Pulp Paper Res. J. 20(1),<br />
115-120<br />
Ander P. and Daniel G. (2006): Dislocation counting and comparison <strong>of</strong> pulp fibre properties after HCltreatment<br />
and fibre length determination. Proc. 5th Plant Biomechanics Conference, Stockholm, Vol. I.<br />
August 28 – September 1, 2006. Ed.: L. Salmén. STFI-Packforsk, Stockholm, Sweden, ISBN 91-86018-<br />
12-4, pp. 169-174<br />
Ander P., Hildén L. and Daniel G. (2008): Cleavage <strong>of</strong> s<strong>of</strong>twood kraft pulp fibers by HCl and cellulases.<br />
BioResources 3(2), 477-490<br />
Ander P., Henniges, U. and Potthast A. (2011): SEC studies on HCl treated s<strong>of</strong>twood and birch kraft<br />
pulps. In COST Action E54 “Characterisation <strong>of</strong> the fine structure and properties <strong>of</strong> papermaking fibres<br />
using new technologies”. Eds: Ander P., Bauer W., Heinemann S., Kallio P., Passas R. and Treimanis A.<br />
Printed by: Swedish University <strong>of</strong> Agricultural Sciences, pp. 65-72. ISBN 978-91-576-9007-4.<br />
Brecht W. and Imset O. (1933): Ein neues Gerät zur Messung des Durchreisswiderstandes von Papieren<br />
(A new apparatus for assessment <strong>of</strong> tear strength <strong>of</strong> papers). Wochenbl. Papierfab. 64 (48), 848-853<br />
Brecht W. and Schanz D. (1957): Attempt to characterize mechanical pulp fines by assessing its specific<br />
surface area. Wochenbl. Papierfab. 85(23), 891-898<br />
Ekstam T. (1957): Investigations on beating with the "JOKRO-Mühle". Paperi ja Puu 39(6), 309-316<br />
Forgacs O.L. (1963): The characterization <strong>of</strong> mechanical pulps. Pulp Paper Mag. Can. 64(C), T89-T118<br />
Hechler E. (1968): Beating trials with the JOKRO mill. Das Papier 22(7), 396-406<br />
Heinemann S. (1985): Contribution to determine the mass-specific surface area and its effect on strength<br />
behavior <strong>of</strong> pulps. Doctoral Thesis, Dresden University <strong>of</strong> Technology, Faculty <strong>of</strong> Engineering<br />
231
COST Action E54 Book<br />
Heinemann S. and Neclaw A. (2011): Hydrodynamic specific surface area – The Dresden method and its<br />
results for pulps affected by different additives. In COST Action E54 “Characterisation <strong>of</strong> the fine<br />
structure and properties <strong>of</strong> papermaking fibres using new technologies”. Eds: Ander P., Bauer W.,<br />
Heinemann S., Kallio P., Passas R. and Treimanis A. Swedish University <strong>of</strong> Agricultural Sciences, pp.<br />
233-246. ISBN 978-91-576-9007-4<br />
Heinemann S. and Vehniäinen A. (2009): The character and properties <strong>of</strong> mechanical pulps. In<br />
Mechanical Pulping, Bd. 5 <strong>of</strong> the series <strong>Papermaking</strong> Science and Technology, 2nd edition, chapter 15, p.<br />
456 – 514, Lönnberg, B. (Ed.), Helsinki: Paperi ja Puu Oy, 2009 (ISBN 978-952-5216-35-6)<br />
Ingmanson W.L. (1952): An investigation <strong>of</strong> the mechanism <strong>of</strong> water removal from pulp slurries, Tappi<br />
Journal 35(10), 439-448<br />
Ingmanson W.L. and Andrews B.D. (1959): The effect <strong>of</strong> beating on filtration resistance and its<br />
components <strong>of</strong> specific surface and specific volume. Tappi J. 42 (1), 29-35<br />
Ingmanson W.L. and Whitney R.P. (1954): The filtration resistance <strong>of</strong> pulp slurries. Tappi J. 37(11), 523-<br />
534<br />
Jayme L.G. and Büttel H. (1965): Acquisition <strong>of</strong> fine deviations in pulp behavior during beating in the<br />
JOKRO mill. Atti del Congresso Europeo di Tecnica Cartaria Venedig 1965, Proceedings, p.131-146<br />
Jonas K.G. (1933): The beating actions in the hollaender and in the JOKRO mill. Der Papierfabrikant<br />
31(36), 473-483<br />
Kleinert R. (1977): Upgrading the JOKRO mill for standard laboratory beating. Zellst<strong>of</strong>f und Papier<br />
26(9), 261-266<br />
Mannström B. (1967): On the characterization and quality control <strong>of</strong> mechanical pulp. Paperi ja Puu<br />
49(4a), 137-146<br />
Mannström B. (1972): Characterization <strong>of</strong> refiner mechanical pulp. Das Papier 26(10A), 657-664<br />
Mason, S.G. (1950): Specific surface <strong>of</strong> fibers – Its measurement and application. Tappi J. 33(8), 403-409<br />
Mork E. (1928): Die Qualität des Fichtenholzes unter besonderer Rücksichtnahme auf Schleif- und<br />
Papierholz (The quality <strong>of</strong> spruce wood considering especially its use for ground wood and pulp wood).<br />
Der Papierfabrikant 26(48), 741-747<br />
Orlandi M. (2007): FIB Analysis <strong>of</strong> unbleached kraft pulp. COST E54 Workshop, 24-25 October 2007,<br />
Brussels/Belgium<br />
Robertson A. and Mason S.G. (1949): Specific surface <strong>of</strong> cellulose fibres by the liquid permeability<br />
method. Pulp Paper Mag. Can. 50(13), 103-110<br />
SCAN-M9 (1976): Mechanical pulp – Drainage time (withdrawn Scandinavian standard, informative<br />
only)<br />
Seth R.S. and Blinco K.M. (1990): Comparison <strong>of</strong> Brecht-Imset and Elmendorf tear strengths. Tappi J.<br />
73(1), 139-142<br />
TAPPI standard T221 cm-99 (1999): Drainage <strong>of</strong> pulp<br />
Zellcheming Technical Leaflet (1961): Common method for strength assessment <strong>of</strong> pulps, Part G:<br />
Testing <strong>of</strong> dewatering behaviour, Zellcheming Technical Leaflet V/7/61 (withdrawn as standard,<br />
informative only)<br />
232
COST Action E54 Book<br />
HYDRODYNAMIC SPECIFIC SURFACE AREA – THE DRESDEN<br />
METHOD AND ITS RESULTS FOR PULPS AFFECTED BY DIFFERENT<br />
ADDITIVES<br />
Abstract<br />
1 Sabine Heinemann and 2 Aleksandra Neclaw<br />
1 P.O. Box 1000, 02044 VTT (Espoo), Finland<br />
2 Eska Graphic Board, P.B. 90, 9610 AB Sappemeer, The Netherlands<br />
sabine.heinemann@vtt.fi<br />
a.neclaw@eskagraphicboard.com<br />
Hydrodynamic specific surface area and compressibility are suitable parameters to characterize<br />
the behavior <strong>of</strong> fibrous material in draining processes such as sheet forming and pressing as well<br />
as the strength <strong>of</strong> the resulting sheets. Obvious data differences caused by effects <strong>of</strong> raw material<br />
or pulping processes made the hydrodynamic specific surface area becoming a parameter <strong>of</strong><br />
interest in investigations <strong>of</strong> alternative additives based on commercial products from bio-based<br />
industries. The experiments and discussion presented in this paper were part <strong>of</strong> a Master Thesis<br />
with the objective to assess the impact <strong>of</strong> different, alternative papermaking additives on paper<br />
web dewatering intensity in the wet-end part <strong>of</strong> paper machine with a clear focus on the<br />
influence and the role <strong>of</strong> additives and fibers. Alternative bio-based additives which can be used<br />
as a valuable papermaking additive without negative effect on paper quality were targeted. The<br />
effect <strong>of</strong> those additives on the dewatering behavior <strong>of</strong> pulp suspensions with different<br />
papermaking alternative additives using process effects, and correlations between different<br />
dewatering methods were studied.<br />
The hydrodynamic specific surface area and compressibility parameters made clear distinctions<br />
between the applied alternative bio-based pulps, which could improve the dewatering <strong>of</strong> the<br />
mixed pulp slurry to a certain extend. The interactions between the pure reference made from<br />
recovered fibers and the character <strong>of</strong> the alternative pulps, described by properties such as e.g.<br />
dimensions, dimensional distribution, moisture content, and chemical composition, have a high<br />
variability. The results show that not always the optimal trial parameters could be applied, but at<br />
least some <strong>of</strong> the alternative materials such as the sugar-based Betacal, the wooden sawdust, but<br />
also deinking sludge have a potential to adjust suitable dewatering properties for certain base<br />
pulps. Additionally, citrus pulp and probably also potato peelings have a chance for application<br />
in this sense.<br />
Introduction<br />
Hydrodynamic specific surface area and compressibility are suitable parameters to characterize<br />
the behavior <strong>of</strong> fibrous material in draining processes such as sheet forming and pressing as well<br />
as the strength <strong>of</strong> the resulting sheets. The method as such was developed about 60 years ago<br />
(Robertson and Mason 1949; Mason 1950), and mainly applied on mechanical pulps (Brecht and<br />
Schanz 1957; Forgacs 1963). A lot <strong>of</strong> research has been focused on this measuring method<br />
during the following years about the permeability theory, optimization <strong>of</strong> the testing principle<br />
and suitable applications for pulp characterization and prediction <strong>of</strong> paper properties (Emerton<br />
1955; Robertson 1957; Ingmanson and Andrews 1959; Thode 1959; Ingmanson and Andrews<br />
1963; Campbell 1965; Grén and Hedström 1967; Labreque 1968; Han 1969; Cowan 1970; Grén<br />
1972; Schweizer 1975; Yan and El-Hosseiny 1978). A commercial device – the Pulmac<br />
233
COST Action E54 Book<br />
Permeability Tester – was launched at the end <strong>of</strong> that research period (Cowan 1970), but is not<br />
commercially available anymore.<br />
A next boom for the method has been in the middle eighties <strong>of</strong> the last century including new<br />
apparatus developments and applications (Ljungkvist 1983; Unger et al. 1983; Unger and<br />
Heinemann 1983a,b and 1985).<br />
Recent developments and applications have started in the late nineties (Kumar and Ramarao<br />
1995; Ramarao 1999; Das et al. 2001; Wang et al. 2002). Nevertheless, the method has its<br />
limitations for on-line application and is therefore not widely known or in use, although the<br />
testing results are more reliable and distinct testing pulps better than corresponding dewatering<br />
parameters such as Canadian Standard Freeness or Schopper-Riegler (Heinemann 1985).<br />
In the following discussion, hydrodynamic specific surface and specific volume by permeability<br />
method was measured with the Dresden Permeability apparatus (Unger et al. 1983; Heinemann<br />
1985 and 2010). Obvious data differences gained with this testing device and caused by effects<br />
<strong>of</strong> raw material or pulping processes made these parameters becoming <strong>of</strong> interest in<br />
investigations <strong>of</strong> alternative additives based on commercial products from bio-based industries.<br />
The experiments and discussion presented in this paper were part <strong>of</strong> a Master Thesis with the<br />
objective to assess the impact <strong>of</strong> different, alternative papermaking additives on paper web<br />
dewatering intensity in the wet-end part <strong>of</strong> paper machine with a clear focus on the influence and<br />
the role <strong>of</strong> additives and fibers (Judasz 2009). Alternative bio-based additives which can be used<br />
as a valuable papermaking additive without negative effect on paper quality were targeted. The<br />
effect <strong>of</strong> those additives on the dewatering behavior <strong>of</strong> pulp suspensions with different<br />
papermaking alternative additives using process effects, and correlations between different<br />
dewatering methods were studied.<br />
Theory and background <strong>of</strong> the permeability principle<br />
The hydrodynamic surface area <strong>of</strong> fibers is defined as fiber surface area in a compressed waterswollen<br />
fiber pad that is accessible for streaming water molecules, and its dimension is m²/g.<br />
The method is based on liquid permeability method first published by Robertson and Mason<br />
(1949), which is an application <strong>of</strong> the permeability principle by Kozeny (1927).<br />
For the porous fiber wall, an internal and an external surface can be defined. In water-swollen<br />
fibers, internal surface area is not accessible for water molecules which flow along the external<br />
fiber surface. Only the external surface is in contact with the streaming/flowing water.<br />
Therefore, the hydrodynamic specific surface area describes an external surface and is a function<br />
<strong>of</strong> flow rate through a compressed fiber pad under defined hydrostatic pressure, reflecting the<br />
flow resistance caused by fiber surface character (Emerton 1955; Heinemann 1985).<br />
According to Robertson and Mason (1949), the permeability behavior <strong>of</strong> a compressed pad <strong>of</strong><br />
water-swollen fibers is linear for a certain range <strong>of</strong> concentration at the given sample mass g.<br />
Linearity can be expressed by a straight-line equation (equation 1).<br />
1<br />
3<br />
1<br />
3<br />
2<br />
1 � 1 �<br />
3 ( KcF<br />
) � � �<br />
� 2<br />
2 S �<br />
� m �<br />
� 1 �<br />
�Vmc<br />
� �<br />
F � 2<br />
2 S �<br />
� m �<br />
(1)<br />
K permeability parameter<br />
cF fiber pad concentration<br />
Sm specific surface area<br />
specific volume<br />
Vm<br />
234
COST Action E54 Book<br />
This straight line is part <strong>of</strong> the so-called Kozeny-Carman plot, which is created by data pairs <strong>of</strong><br />
the value (KcF²) ⅓ versus cF. (Figure 1). The data pairs are gained from flow rate measurements<br />
through a stepwise further compressed fiber pad. Practically, a defined amount <strong>of</strong> oven-dry, airfree<br />
sample material is compressed in a vessel between 2 wire screens from which one is moving<br />
with a piston, and the other is fixed. For each compression step, hydrostatic pressure, flow rate,<br />
wire screen distance and liquid temperature is measured. After the full number <strong>of</strong> compression<br />
steps, the fiber pad is removed, and the oven-dry mass is determined. The fiber pad<br />
concentration cF and the permeability factor K are calculated using equations according to Darcy<br />
(flow rate through a porous material with unknown porosity) and according to Hagen-Poiseuille<br />
(flow rate through a material with known number <strong>of</strong> circle-cylindrical pores). From these<br />
calculated values, the parameters for the Kozeny-Carman plot – (KcF²) ⅓ and cF – are taken.<br />
Figure 1. The Kozeny-Carman plot, based on laboratory refining <strong>of</strong> s<strong>of</strong>twood kraft pulp, with<br />
extrapolation <strong>of</strong> the straight-line part to the y-axis (ŷ) for calculation <strong>of</strong> the specific surface area Sm, and<br />
extrapolation to the x-axis (cF max) for calculation <strong>of</strong> the specific volume Vm.. (See Heinemann 2010)<br />
The shape <strong>of</strong> the Kozeny-Carman plot (Figure 1) is reflecting different states <strong>of</strong> the particle-flow<br />
interaction depending on the concentration <strong>of</strong> the compressed fiber pad. At concentrations<br />
smaller than 0.07 g/cm³, fibers can freely move under hydrostatic pressure, and the flow rate<br />
increases with increasing pad consistency. At about cF=0.07 g/cm³, fibers cannot flow anymore<br />
with hydrostatic pressure, they start to find their “best place” under compression pressure. This<br />
concentration is the starting point <strong>of</strong> the straight-line part in the Kozeny-Carman plot. The upper<br />
concentration limit for the linearity, cF = 0.15 g/cm³, was defined due to construction limits <strong>of</strong><br />
the first testing apparatus ever built (Robertson and Mason 1949; Brecht and Schanz 1957). It<br />
was found that the straight-line equation can be applied also for higher fiber pad concentrations,<br />
especially for pulps with less compressible fibers. In other cases, fibers cannot move anymore<br />
under compression pressure and start to collapse – the flow rate increases again, and the Kozeny-<br />
Carman plot flattens (Heinemann 1985).<br />
In a compressed fiber pad, all particles are in contact with their neighbours, and only part <strong>of</strong> the<br />
fiber surface is free to be in contact with flowing water. For the total specific surface area,<br />
particles are assumed NOT to be in contact with any neighbour. Computation <strong>of</strong> specific surface<br />
area is carried out by extrapolation <strong>of</strong> the straight-line part to the y-axis (CF=0, i.e. no contact to<br />
any neighbour). From the y-intercept (ŷ), specific surface area Sm is calculated according to<br />
equation 2.<br />
235
COST Action E54 Book<br />
1<br />
Sm � (2)<br />
3<br />
5.<br />
55 yˆ<br />
Extrapolation <strong>of</strong> the same straight-line part to the x-axis ((KcF²) ⅓ =0, i.e. no flow through the<br />
fiber pad) describes the theoretical situation, that all fibers are in full contact to each other and<br />
no free fiber surface is left in the fiber pad. At this intercept, the specific volume <strong>of</strong> all fibers Vm<br />
can be calculated just by reversing the intercept value cFmax (equation 3).<br />
1<br />
Vm � (3)<br />
c<br />
F max<br />
Specific surface area is a good tool to characterize refining behavior <strong>of</strong> chemical pulps when<br />
expressed together with length-weighted fiber length (Figure 2).<br />
A gradual increase in specific surface area with moderate decrease <strong>of</strong> fiber length stands for<br />
preferably fibrillation treatment during laboratory beating (valid for all tested kraft pulps – pine,<br />
Douglas fir, eucalyptus, and birch). A strong decrease <strong>of</strong> fiber length immediately after the<br />
beginning <strong>of</strong> treatment without any noticeable increase <strong>of</strong> specific surface area stands for all<br />
pulps with low refining resistances, which are preferably shortened in laboratory beating (spruce<br />
sulfite pulp, straw kraft pulp). Figure 2 shows also, that a development <strong>of</strong> specific surface area<br />
occurs also for such pulps, but only later in the refining process, and at much lower fiber length.<br />
Figure 2. Relative length-weighted central-line fiber length versus relative hydrodynamic specific surface<br />
area for laboratory beating <strong>of</strong> chemical pulps in the JOKRO mill. Basis for relativization was always the<br />
unbeaten reference pulp (See Heinemann 2010)<br />
Although it has <strong>of</strong>ten been postulated, there is neither a clear correlation between specific<br />
surface area and Schopper-Riegler value nor with Canadian Standard Freeness (Unger and<br />
Heinemann 1983a).<br />
236
COST Action E54 Book<br />
Figure 3. Development <strong>of</strong> tensile index for 6 samples differing in raw material, pulping and refining<br />
processes, versus Schopper-Riegler units (left), and versus specific surface area (right) (See Heinemann<br />
2010)<br />
For parameters, which describe the bonding behavior (like tensile index), a better correlation can<br />
be found with specific surface area than with the Schopper-Riegler value (Figure 3). For some<br />
samples, drainability expressed in Schopper-Riegler units might already be enough to describe<br />
the development <strong>of</strong> tensile index (sample 2 in Figure 3), but for other samples, a better sample<br />
distinction can be made with specific surface area than with Schopper-Riegler (or Canadian<br />
Standard Freeness).<br />
The compressibility is a complex property depending on dimensions, stiffness and swelling<br />
degree <strong>of</strong> the fibers. An empirical equation (equation 4) based on fiber pad concentration and<br />
compression pressure was found suitable for papermaking fibers (Ingmanson 1953; Wilder<br />
1960; Grén 1972). Especially the parameter n was found to describe the compressibility behavior<br />
<strong>of</strong> the tested pulp sample.<br />
c c � m�<br />
p<br />
F<br />
cF<br />
cF0<br />
pK<br />
F 0<br />
n<br />
K<br />
� (4)<br />
Concentration <strong>of</strong> the fiber pad in g/cm³<br />
Initial concentration <strong>of</strong> the fiber pad in g/cm³<br />
Compression pressure in kPa<br />
m, n Conformability parameters<br />
An application <strong>of</strong> this compressibility assumption was made with the Dresden Permeability<br />
Tester (Figure 4, Heinemann 1985). The values for the parameter n (0.31 for groundwood and<br />
0.35 for s<strong>of</strong>twood kraft pulp respectively) were close to values found earlier elsewhere (Grén<br />
1972), and demonstrate that the unbeaten kraft pulp fibers with their higher flexibility are better<br />
compressible than the groundwood material containing not only rather stiff fibers but also other<br />
material broken down from the wood matrix in a wide dimensional distribution.<br />
237
Fiber pad concentration c Fmax, g/cm³<br />
0.6<br />
0.4<br />
0.2<br />
0.0<br />
s<strong>of</strong>twood kraft pulp<br />
y = 0.1114x 0.3465<br />
spruce groundwood<br />
y = 0.0860x 0.3100<br />
COST Action E54 Book<br />
0 20 40 60 80<br />
Compression pressure p K, kPa<br />
Figure 4. Maximum fiber pad concentration cFmax depending on compression pressure pK for unbeaten<br />
s<strong>of</strong>twood kraft pulp and spruce groundwood, measured with the Dresden Permeability Tester (see<br />
Heinemann 1985). Trend lines with equations describe the compressibility behavior in the medium<br />
compression range between 20 and 50 kPa<br />
Experimental<br />
Tested materials<br />
Experiments were performed to investigate the effect <strong>of</strong> alternative additives on drainability and<br />
flow behavior respectively.<br />
The reference pulp was made from pure recovered fibers, using fluting from Smurfit Kappa<br />
Roermond Paper, consisting in 60% OCC and 40% MOW (mixed <strong>of</strong>fice waste).<br />
Commonly available substances from the papermaking industry and collaborating bio-based<br />
industries were used as alternative additives (in alphabetical order): apple pulp, Betacal (a sideproduct<br />
from sugar industry), beer fines fresh and dried, citrus pulp, deinking sludge, onion<br />
skins, potato pulp (potato peelings), and sawdust with diameters <strong>of</strong> 100µm and 320 µm. The<br />
main components <strong>of</strong> some <strong>of</strong> these materials are given in Table 1.<br />
Table 1. Main components <strong>of</strong> selected alternative additives<br />
Alternative<br />
additives<br />
Cellulose [g/kg] Hemicellulose [g/kg] Lignin [g/kg] Ash [g/kg]<br />
Apple pulp 285 25<br />
Betacal - - - 43<br />
Beer fines 220 480 60<br />
Sawdust C100 450-550 100-200 250-300 5<br />
Sawdust C320 474 214 246 2<br />
Citrus pulp 130 40<br />
Deinking sludge 356 94 205 250<br />
Onion skins 245 90<br />
238
COST Action E54 Book<br />
The samples for the permeability tests were prepared by adding 5%, 10%, and 15% <strong>of</strong> oven-dry<br />
alternative additives to oven-dry reference pulp, resulting in two sample groups. One group<br />
included the samples which were measured almost immediately after preparation. The other<br />
group contained samples with at least 2 hours <strong>of</strong> swelling time between sample preparation and<br />
sample testing. In opposite to the normally applied permeability method, the pulp samples were<br />
not air-free.<br />
Testing equipment<br />
No commercial device for testing hydrodynamic specific surface area is available. The trials<br />
were performed with the unique Dresden Permeability Tester, first published by Heinemann<br />
(1985). Figure 5 shows the simplified testing principle for permeability measurements (=<br />
measurement <strong>of</strong> the flow rate through a more or less compressed fiber pad). Additionally,<br />
compression tests can be performed to a certain extent with the same device as part <strong>of</strong> the<br />
permeability measurements (Figure 6). Constant device parameters are summarized in Table 2.<br />
Figure 5. Simplified testing principle <strong>of</strong> the Dresden Permeability Tester (see Heinemann 2008)<br />
Table 2. Constant and adjustable device parameters<br />
Cross-sectional area <strong>of</strong> the compression vessel 12.57 cm²<br />
Hydrostatic pressure 0 – 8.8 kPa (0 – 88 mbar)<br />
Sample mass oven-dry 1.8 – 2.5g<br />
Minimum compression pressure (applied for flow-rate measurements during<br />
step-wise fiber pad compression<br />
1.56 kPa (15.6 mbar)<br />
Maximum compression pressure applied for compressibility tests 67.1 kPa (0.67 bar)<br />
Step size for compression pressure in compressibility tests 9.37 kPa (93.7 mbar)<br />
Number <strong>of</strong> compression steps At least 3<br />
239
COST Action E54 Book<br />
Figure 6. Lever system for compression tests. The conformability <strong>of</strong> the fibers in the compressed fiber<br />
pad is defined as the maximum fiber pad concentration which can be reached with maximum<br />
compression pressure <strong>of</strong> 67.1 kPa after a number <strong>of</strong> defined compression steps for flow rate<br />
measurements at compression pressure <strong>of</strong> 1.56 kPa (see Heinemann 1985)<br />
Trial performance including sample preparation<br />
The following steps were performed for repeatable assessment <strong>of</strong> specific surface area and<br />
compressibility:<br />
- Grinding the alternative additive materials in a kitchen c<strong>of</strong>fee grinder if necessary<br />
- Placing the recovered paper into the disintegrator<br />
- Adding the alternative pulps in proper proportion to the disintegrator<br />
- Disintegrating <strong>of</strong> the material mix with 15000 revolutions at 2% consistency<br />
- Filling those samples which needed to swell into special containers (consistency 2%)<br />
- Placing the pulp either directly after disintegration or after swelling into a dilution tank,<br />
filling the tank up to a volume <strong>of</strong> 10 liters, and determining the slurry consistency<br />
- Taking the proper sample amount corresponding to 2 g oven-dry material from the dilution<br />
tank<br />
- Performing the permeability test with six compression steps<br />
- Performing the conformability test with compression pressure <strong>of</strong> 67.1 kPa<br />
The applied procedure parameters are summarized in Table 3.<br />
240
Table 3. Applied procedure variables<br />
COST Action E54 Book<br />
Hydrostatic pressure (lowest pressure applied to avoid undesired effects<br />
on the internal fiber pad structure)<br />
Sample mass oven-dry 2 g<br />
Minimum compression pressure (applied for flow-rate measurements<br />
during step-wise fiber pad compression<br />
1.0 – 1.5 kPa (10 – 15 mbar)<br />
1.56 kPa (15.6 mbar)<br />
Maximum compression pressure applied for compressibility tests 67.1 kPa (0.67 bar)<br />
Swelling time for selected samples At least 2 h<br />
Number <strong>of</strong> compression steps 6<br />
Range <strong>of</strong> fiber pad concentration during the 6 compression steps 0.069-0.143 g/cm³<br />
Range <strong>of</strong> achieved maximum fiber pad concentration 0.45 to 0.60 g/cm³<br />
Testing results<br />
The tests were performed to precise the effect <strong>of</strong> adding alternative materials to the reference<br />
pulp from recovered fibers on the dewatering behavior <strong>of</strong> the resulting pulp suspensions.<br />
Hydrodynamic specific surface area and compressibility was measured for three different<br />
proportions <strong>of</strong> oven-dry additives, partly also a 2-hours-swelling was performed.<br />
Figure 7. Relative specific surface area versus added proportion <strong>of</strong> alternative pulp. Alternative additives<br />
increasing specific surface area (left), and decreasing specific surface area (right). For relative values,<br />
the surface area <strong>of</strong> the pure reference pulp (1.73 m²/g) was set as 1.<br />
Deviations in pulp behavior compared with the pure reference pulp depend on shape and size <strong>of</strong><br />
the added particles and their distributions. Wide distributions can cause insignificant changes <strong>of</strong><br />
the specific surface area.<br />
Apple pulp, deinking sludge and onion pulp increase the hydrodynamic specific surface up to an<br />
added proportion <strong>of</strong> 10%. Further addition (15% alternative pulp) reverses this tendency, but the<br />
resulting data are still higher than those <strong>of</strong> pure reference pulp. Of these alternative materials,<br />
only deinking sludge seems to decrease the specific surface area and thus improve dewatering to<br />
241
COST Action E54 Book<br />
certain extent when added in minor proportions (5%) (Figure 7 left). The added alternative<br />
materials with tendency to decrease specific surface area and thus increase drainability are<br />
assembled in Figure 7 right. Sawdust C100 and citrus pulp improve drainability only at higher<br />
added proportions (15% and 10% respectively). Beer fines both dry and wet have the highest<br />
data deviation, but with decreasing tendency, too.<br />
From these results, the alternative additives with the best effect considering dewatering<br />
(=decreasing specific surface area) are Betacal and sawdust C320. Both are rather granular<br />
materials as seen from microscopic images (Figure 8), and they seem to act like mineral fillers.<br />
Figure 8. Microscopic images <strong>of</strong> tested pulps in modified polarized light – Recovered pulp with Betacal<br />
(above left), with sawdust C320 (above right), with beer fines dry (below left) and with beer fines moist<br />
(below right). Length bar: 50 µm<br />
In the lower part <strong>of</strong> Figure 8, the high variety <strong>of</strong> beer fines is visible which causes the very wide<br />
deviation <strong>of</strong> the testing results.<br />
Considering the effect <strong>of</strong> swelling on dewatering, no clear tendency was seen. For apple pulp<br />
(Figure 9 left), swelling seems to decrease the data deviation, however, the swelling <strong>of</strong> the pulp<br />
had no positive effect on drainability. From the tested materials, which decreased specific<br />
surface area in dry state, only Betacal and sawdust C320 showed a clear tendency (Figure 9<br />
right) – swelling <strong>of</strong> Betacal increased specific surface area and was thus detrimental for<br />
dewatering improvement, except the high proportion <strong>of</strong> added material (15%).<br />
242
COST Action E54 Book<br />
Figure 9. The effect <strong>of</strong> swelling on drainability depending on the added proportion <strong>of</strong> alternative pulps.<br />
Material increasing specific surface area (left), and material decreasing specific surface area without<br />
swelling (right). For relativization, the surface area <strong>of</strong> the pure reference pulp after 2h swelling<br />
(1.79 m²/g) was set as 1.<br />
Swelling <strong>of</strong> sawdust even improved drainability for the lower added proportions (5%, and 10%).<br />
Further swelling <strong>of</strong> moist beer fines decreased the data deviation with falling tendency, and for<br />
sawdust C100, swelling was positive in the sense <strong>of</strong> dewatering improvement only at higher<br />
added proportions.<br />
Due to the wide variation <strong>of</strong> material character in the pulp mixtures and the resulting high<br />
deviation in measuring data, the compression test was modified. Instead <strong>of</strong> the power function<br />
and the parameters m and n, only the compression graphs were interpreted (Figure 10).<br />
Figure 10. Compressibility behavior <strong>of</strong> pure recovered fiber (left), Betacal (center), and sawdust C320<br />
(right), for different added proportions and affected by swelling (dotted lines)<br />
The higher the compression pressure the larger is the reachable concentration <strong>of</strong> the fiber pad.<br />
Swelling decreases the compressibility <strong>of</strong> fibrous material, only smaller fiber pad concentration<br />
can be reached with the highest compression pressure. Figure 10 proves this basic knowledge.<br />
Besides the pure reference pulp (Figure 10 left), those samples were selected which had the best<br />
impact on dewatering. For Betacal (Figure 10 center), no significant difference between non-<br />
243
COST Action E54 Book<br />
swollen (solid lines) and swollen samples (dotted lines) was found. For the coarse sawdust C320<br />
(Figure 10 right), swelling was always detrimental for the compressibility <strong>of</strong> the pulp mixture.<br />
Conclusions<br />
Permeability tests were found to be suitable laboratory trials to characterize the drainability and<br />
dewatering behavior <strong>of</strong> pulps. Alternative additives from bio-based industries could improve the<br />
dewatering to a certain extent. The interactions between the pure reference and the character <strong>of</strong><br />
the alternative pulps – described by properties such as e.g. dimensions, dimensional distribution,<br />
moisture content, and chemical composition – have a high variability. The results show that not<br />
always the optimal trial parameters could be applied, but at least some <strong>of</strong> the alternative<br />
materials such as the sugar-based Betacal, the wooden sawdust, but also deinking sludge have a<br />
potential to adjust suitable dewatering properties for certain base pulps. Additionally, citrus pulp<br />
and probably also potato peelings have a chance for application in this sense.<br />
Acknowledgment<br />
The Master Thesis <strong>of</strong> A. Judasz (now A. Neclaw) was part <strong>of</strong> a larger project performed in<br />
the framework <strong>of</strong> the following projects: ’Briljant’, ‘Susprise – Green biorefinery’, ‘Biorefinery<br />
program <strong>of</strong> Energy Transition’ as well as the ‘Fibre Raw Material program’ <strong>of</strong> the Centre <strong>of</strong><br />
Competence Paper and Board (KCPK) and Bumaga BV in The Netherlands, in co-operation with<br />
the Polish Institute <strong>of</strong> <strong>Papermaking</strong> and Printing (PIP).<br />
The measurements <strong>of</strong> hydrodynamic surface were performed in co-operation <strong>of</strong> Dresden<br />
University <strong>of</strong> Technology, Pr<strong>of</strong>essorship <strong>of</strong> Paper Technology, in Germany, and VTT in Finland<br />
as Short Term Scientific Mission titled “The effect <strong>of</strong> alternative additives on the hydrodynamic<br />
surface area and volume”.<br />
References<br />
Brecht W. and Schanz D. (1957): Attempt to characterize mechanical pulp fines by assessing its specific<br />
surface area. Wochenbl. Papierfab. 85(23): 891-898<br />
Campbell N.F. (1965): The surface area <strong>of</strong> wood pulp. The Papermaker 150(2): 53-57, 61<br />
Cowan W.F. (1970): Wet pulp characterization by means <strong>of</strong> specific surface, specific volume and<br />
compressibility. Pulp Paper Mag. Can. 71(9): 63-66<br />
Das S., Cresson T. and Ramarao B.V. (2001): Pulp characterization using permeability measures: effect<br />
<strong>of</strong> refining. 6th Int. Conf. Pulp Refining, Toronto/ON, Canada. PIRA International, Leatherhead, Surrey,<br />
UK<br />
Emerton R.W. (1955): The specific external surface <strong>of</strong> fibre – Some theoretical considerations. Pulp<br />
Paper Mag. Can. 56(2): 65-68<br />
Forgacs O.L. (1963): The characterization <strong>of</strong> mechanical pulps. Pulp Paper Mag. Can. 64(C): T89-T118<br />
Grén U. (1972): Compressibility and permeability <strong>of</strong> packed beds <strong>of</strong> cellulose fibres. Svensk<br />
Papperstidning 75(19): 785-793<br />
Grén U. and Hedström B. (1967): Fluid flow and pressure drops in thick beds <strong>of</strong> cellulose fibres. Svensk<br />
Papperstidning 70(10): 339-346<br />
244
COST Action E54 Book<br />
Han S.T. (1969): Compressibility and permeability <strong>of</strong> fibre mats. Pulp Paper Mag. Can. 70(5): T134-<br />
T146<br />
Heinemann S. (1985): Contribution to determine the mass-specific surface area and its effect on strength<br />
behavior <strong>of</strong> pulps. Doctoral Thesis, Dresden University <strong>of</strong> Technology, Faculty <strong>of</strong> Engineering<br />
Heinemann S. (2010): Hydrodynamic specific surface area, Lecture material PAPHYS, Part 6.2, Dresden<br />
University <strong>of</strong> Technology/VTT Finland<br />
Ingmanson W.L. (1953): Filtration resistance <strong>of</strong> compressible materials. Chemical Engineering Progress,<br />
49(11): 577–584<br />
Ingmanson W.L. and Andrews B.D. (1959): The effect <strong>of</strong> beating on filtration resistance and its<br />
components specific surface and specific volume. Tappi J. 42(1): 29-35<br />
Ingmanson W.L. and Andrews B.D. (1963): High-velocity water flow through fiber mats. Tappi J. 46(3):<br />
150-155<br />
Judasz A. (2009): Estimation <strong>of</strong> impact <strong>of</strong> alternative papermaking additives on paper web dewatering<br />
intensity and paper properties. Master Thesis, Institute <strong>of</strong> <strong>Papermaking</strong> and Printing, Lodz/Poland<br />
Judasz A. and Heinemann S. (2009): The effect <strong>of</strong> alternative additives on the hydrodynamic surface area<br />
and volume. STSM-Report within COST Action E54 “Characterization <strong>of</strong> the fine structure and<br />
properties <strong>of</strong> papermaking fibres using new technologies”<br />
Kozeny J. (1927): About capillary flow <strong>of</strong> water through soil� Meeting report <strong>of</strong> Austrian Academy <strong>of</strong><br />
Science, IIa, 136, 271-306<br />
Kumar P. and Ramarao B.V. (1995): Characterization <strong>of</strong> specific surface area, specific volume,<br />
compressibility and specific filtration resistance <strong>of</strong> papermaking pulps. Proc. TAPPI Papermakers’ Conf.,<br />
465–488<br />
Labreque R.P. (1968): The effect <strong>of</strong> fiber cross-sectional shape on the resistance to the flow <strong>of</strong> fluids<br />
through fiber mats. Tappi J. 51(1): 8-15<br />
Ljungkvist K. (1983): Pulp characterization by permeability measurements. Doctoral Thesis, Chalmers<br />
University <strong>of</strong> Technology Göteborg, Sweden<br />
Mason S.G. (1950): Specific surface <strong>of</strong> fibers – Its measurement and application. Tappi J. 33(8): 403-409<br />
Ramarao B.V. (1999): Method and apparatus for determining pulp permeability and compressibility for<br />
controlling papermaking process. US Patent 5,954,922. September 21, 1999<br />
Robertson A.A. (1957): A note on the permeability method for determining surface development and<br />
swelling during beating and refining. In: Bolam, F. Fundamentals <strong>of</strong> papermaking fibres, Transactions <strong>of</strong><br />
the FRC Symposium in Cambridge, UK<br />
Robertson A. and Mason S.G. (1949): Specific surface <strong>of</strong> cellulose fibres by the liquid permeability<br />
method. Pulp Paper Mag. Can. 50(13), 103-110<br />
Schweizer G. (1975): Study about characterization <strong>of</strong> fibrous material for paper manufacturing by its<br />
specific surface area. Das Papier 29(1): 9-15<br />
Thode E.F. (1959): Factors contributing to the strength <strong>of</strong> paper. Tappi J. 42(1): 74-83<br />
Unger E.-W., Heinemann S. and Strassberger K. (1983) Apparatus to determine specific surface area <strong>of</strong><br />
coarse disperse material systems. Former GDR Patent 224 941, November 3, 1983<br />
245
COST Action E54 Book<br />
Unger E.-W. and Heinemann S. (1983a): Comparing investigations <strong>of</strong> different methods for determining<br />
the specific surface area <strong>of</strong> fibers from pulp slurries. Zellst<strong>of</strong>f und Papier 32(4): 154-157<br />
Unger E.-W. and Heinemann S. (1983b): Contribution to model the paper strength from morphological<br />
pulp properties. Zellst<strong>of</strong>f und Papier 32(2): 50-55<br />
Wang J., Hrymak A.N. and Pelton R.H. (2002): Specific surface and effective volume <strong>of</strong> water-swollen<br />
pulp fibers by a permeability method� J. Pulp Pap. Sci. 28(1): 3–16<br />
Wilder H.D. (1960): The compression creep properties <strong>of</strong> wet pulp mats. Tappi J. 43(8): 715-720<br />
Yan J.F. and El-Hosseiny F. (1978): Freeness, specific surface and drainage time <strong>of</strong> pulps. Tappi J. 61(8):<br />
89<br />
246
Abstract<br />
COST Action E54 Book<br />
BEHAVIOUR OF CELLULOSE FINE STRUCTURES<br />
IN PAPERMAKING TESTS<br />
1 Tiemo Arndt, Gert Meinl, Klaus Erhard<br />
1 Papiertechische Stiftung, Pirnaer Str. 37, 01809 Heidenau;<br />
E-mail: tiemo.arndt@ptspaper.de<br />
In this work the influence <strong>of</strong> micr<strong>of</strong>ibrillated cellulose (MFC) on sheet forming and final paper<br />
properties was investigated. In order to reveal more information about the behaviour <strong>of</strong> these<br />
cellulose fine structures a top-down approach from macro-scale to nano-scale was used based on<br />
the fibre morphology, dewatering properties and the Page equation. A hydrodynamic specific<br />
surface area (SSA) <strong>of</strong> 182.79 m²/g was calculated for MFC. By addition <strong>of</strong> 5% MFC to the<br />
refined pulp the surface area <strong>of</strong> the pulp increased from 3.6 m²/g to 12.56 m²/g. Derived from<br />
SSA, the retention <strong>of</strong> MFC was estimated to be 63.5%. In connection with the paper properties<br />
measured, it was concluded that behaviour and effectiveness <strong>of</strong> MFC are not comparable with<br />
fines produced during refining because only a minor increase in apparent density was observed<br />
due to MFC. However based on the simplified reference fibre network, the bonding strength<br />
between fibres was calculated to be 9 MPa for an addition <strong>of</strong> 5% MFC, which is twice as much<br />
as for the pulp starting material.<br />
Introduction<br />
The paper strength is influenced, among other parameters, by the fine structure <strong>of</strong> pulp fibres.<br />
The most frequent method in papermaking to change the fine fibre structure is refining. Fibre<br />
fibrillation takes place during refining and increases the surface area <strong>of</strong> fibres. At the same time<br />
different types <strong>of</strong> fine structures are produced. This influences not only the final paper strength<br />
but also optical properties and dewatering properties during sheet forming. The common<br />
definition <strong>of</strong> fines is the fraction that passes through a 200 mesh screen. The largest fines<br />
particles are fibre fragments and the smallest are fibrils, whose size can be below 1µm.<br />
Depending on the pulp source and treatment the chemical and structural properties <strong>of</strong> the fines<br />
are different. Chemical pulps contain primary fines, which are small particles originally present<br />
in the wood, such as, shortened fibres, vessel elements, and secondary fines produced during<br />
refining. The content <strong>of</strong> the primary fines in unrefined pulp is in the range <strong>of</strong> 2-4%. They have a<br />
specific surface area <strong>of</strong> about 4-6m²/g. The content <strong>of</strong> secondary fines increases during refining<br />
up to 20%. Retulainen et al. (2002) have characterised and analysed secondary fines with BET<br />
(Brunauer et al. 1938) and found that the specific surface area <strong>of</strong> freeze dried bleached s<strong>of</strong>twood<br />
kraft fines was in the range <strong>of</strong> 15-25 m²/g. Also mechanical pulps contain fine particles, which<br />
are produced during the mechanical pulping process. These fines particles are lignin containing<br />
material peeled out <strong>of</strong> the middle lamella. Because <strong>of</strong> their small size and large surface area<br />
particularly secondary fines produced in the refining can bind more water and swell more. In this<br />
work the influence <strong>of</strong> micro-fibrillated cellulose (MFC) as a special cellulosic fine material on<br />
sheet forming and final paper properties was investigated. This MFC is completely different to<br />
common known pulp fines, because <strong>of</strong> their much smaller size on the connected material<br />
properties. MFC was invented in the early 1980-ies by Herrick (1983) and Turbak (1983) by<br />
mechanical disintegration <strong>of</strong> the fibre wall down to the cellulose fibril aggregates as building<br />
blocks <strong>of</strong> the fibre wall. Since that time many patents and applications were introduced based on<br />
MFC. However due to the high energy consumption during homogenization <strong>of</strong> the fibre wall, the<br />
preparation <strong>of</strong> MFC has so far been <strong>of</strong> limited interest in view <strong>of</strong> large production costs. In<br />
recent years main breakthrough to reduce the energy consumption was made by Lindström and<br />
247
COST Action E54 Book<br />
co-workers (2007) by improvement <strong>of</strong> the pulp preparation before final homogenization. Today<br />
MFC is one <strong>of</strong> the most interesting nano-materials not only in the papermaking science<br />
community, but also in composite materials.<br />
Although MFC is also cellulosic fine material from the fibre wall, this material is completely<br />
different compared with primary and secondary fines, because MFC is a fibrillar network <strong>of</strong><br />
entangled fibrils. The size <strong>of</strong> the fibrils varies in a broad wide range from 20-30 nm in width, but<br />
also larger fibril bundles are present. Alince et al. (2002) compared the behaviour <strong>of</strong> MFC with<br />
fines <strong>of</strong> high and low specific surface area and microcrystalline cellulose on paper properties.<br />
The obtained results indicated that the improvement in strength properties is much higher with<br />
MFC. Particularly on bleached kraft pulp a different effectiveness was observed, because the<br />
light scattering coefficient was almost unaffected by MFC in contrary to other fines, where an<br />
increased light scattering coefficient indicated that a higher relative bonded area (RBA) is<br />
responsible for the improvement in strength properties. Due to the nano-scale level and the<br />
similarity <strong>of</strong> MFC to other fines and fibres it is difficult to characterize the effectiveness <strong>of</strong> MFC<br />
in sheet forming. In order to reveal more about the effectiveness and the interaction <strong>of</strong> MFC with<br />
fibres, a top-down approach was used supported by model assumption and calculation methods.<br />
The bonding strength was calculated based on the PAGE equation and also the hydrodynamic<br />
mass-specific surface area (SSA) <strong>of</strong> the MFC was calculated.<br />
Materials and methods<br />
Raw materials<br />
A mixture <strong>of</strong> dried bleached hardwood and s<strong>of</strong>twood pulp (ratio 5:1) where used as pulp source<br />
together with 2% suspension <strong>of</strong> micro-fibrillated cellulose (MFC) delivered by Innventia,<br />
Sweden. The MFC was prepared according to Pääkkö et al. (2007). In order to support the<br />
retention <strong>of</strong> fines and MFC, a retention aid based on a high molecular polyethylenimine (PEI)<br />
was used.<br />
Technical methods<br />
The dried market pulp was disintegrated 15 minutes in 40°C water at a consistency <strong>of</strong> 5%. The<br />
obtained pulp suspension was refined in a pilot refiner at a consistency <strong>of</strong> 4% with a specific<br />
refining energy <strong>of</strong> 65 kWh/t and at a specific edge load <strong>of</strong> 0.1 Ws/m. After refining the fibre<br />
dimensions were analyzed with a FiberLab 3.0 device. A special method was used to<br />
characterize the fibre fraction and dimensions <strong>of</strong> collapsed and dried fibres in the fibre network<br />
according to Meinl and Erhard (2006). Sheets were formed in a Rapid Köthen former according<br />
to ISO 5269-2 at a consistency <strong>of</strong> 0.3%. The MFC used was stirred for 10 minutes at 2 g/l<br />
consistency and treated with an ultra-turrax blender for 2 minutes. MFC were added to the stock<br />
container <strong>of</strong> the Rapid Köthen sheet per sheet, to a pulp consistency <strong>of</strong> 0.3%. When PEI was<br />
used as retention agent, it was also added in the stock container after the MFC addition. Before<br />
sheet forming the SR value was measured. The dried sheets were characterized according to<br />
standard methods for light scattering coefficient Sy, Scott bond z-strength, apparent density,<br />
tearing resistance, tensile index, and air permeability.<br />
Mathematical methods<br />
For calculation the mass-specific surface area (SSA) an empirical formula was used based on the<br />
SR value.<br />
248
SSA � c SSA<br />
�<br />
SR<br />
100<br />
�<br />
�<br />
4<br />
SR<br />
COST Action E54 Book<br />
The factor cSSA is about 6.24 when applying known corresponding values <strong>of</strong> SR and SSA from<br />
Heinemann (1985 and 2001). Equation 2 is only valid if no chemical additives are used which<br />
could influence the pulp viscosity. The SSA value is additive. If SSAPulp / SSAMFC, are the<br />
specific surface areas <strong>of</strong> the pulp / micr<strong>of</strong>ibrillated cellulose and wMFC is the mass-weighted<br />
MFC share then the specific surface area SSAMFC :<br />
SSA<br />
MFC<br />
SSA<br />
�<br />
Total<br />
� ( 100%<br />
� w<br />
w<br />
MFC<br />
MFC<br />
) � SSA<br />
Pulp<br />
To estimate the relative bonded area (RBA) - a critical value for applying the Page equation - in<br />
a given sheet, one can use a regular fibre network reference which is made up <strong>of</strong> the same fibres<br />
and which has the same apparent density like the original fibre network. The RBA was assumed<br />
as ratio between bonded area (AB) and total area (AT) in accordance with the following equation:<br />
AB<br />
4D RBA � �<br />
A 4d<br />
� D � 4d<br />
� H<br />
2<br />
T<br />
The values D (diameter) and H (height) <strong>of</strong> the collapsed and dried fibres in the network were<br />
calculated by using the fibre morphology data from the FiberLab 3.0 according to Meinl and<br />
Erhard (2006). We have yet to calculate the distance d (distance <strong>of</strong> neighbouring fibres in a<br />
layer, which equals the length and width <strong>of</strong> the elementary cell) according to Equation 4. This<br />
Equation ensures that the apparent density <strong>of</strong> the elementary cell equals the apparent density � <strong>of</strong><br />
the sheet.<br />
D � �<br />
d �<br />
AD<br />
W<br />
Bonding strength b can now be calculated via the Page equation (Equation 5, Page 1969) for<br />
given values <strong>of</strong> mean fibre length FL, tensile index T and zero-span tensile index ZI. The cross<br />
sectional fibre area ACSA equals D�H and the fibre perimeter P equals 2(D+H). For the Zero-span<br />
tensile index a value <strong>of</strong> 150 Nm/g was assumed.<br />
1 9 12�<br />
ACSA<br />
� �W<br />
� �<br />
T 8ZI<br />
b � P � FL � RBA<br />
Results and Discussion<br />
The sheet properties are listed in Table 1. As expected the dewatering <strong>of</strong> the pulp mat decreased.<br />
The SR dramatically increased from 28 to 86 with 5% MFC. The addition <strong>of</strong> PEI caused<br />
agglomeration <strong>of</strong> MFC and fines on the fibre surface and helped to reduce the SR. At the same<br />
time the strength properties were improved to the same extend. But it is obvious that not all<br />
MFC had been retained in the paper sheet, because the PEI containing sheets were always higher<br />
in strength properties in comparison with non PEI containing sheets due to better fines and MFC<br />
retention. The tensile index increased up to 70% and also the Scott bond z-strength increased up<br />
to 170% in comparison with the reference pulp. However one can see that the apparent density<br />
249<br />
(1)<br />
(2)<br />
(3)<br />
(4)<br />
(5)
COST Action E54 Book<br />
was almost unaffected. That indicates that the strength improvement was not due to a higher<br />
RBA as usually expected from common fines. By contrast the light scattering Sy as an indicator<br />
for the unbonded area was reduced.<br />
Table 1. Sheet properties <strong>of</strong> MFC containing papers<br />
MFC % 0 0 1 3 5 1 3 5<br />
PEI on dry pulp % 0 0.25 0 0 0 0.25 0.25 0.25<br />
Schopper Riegler 28 28 44 68 86 32 55 77<br />
Density g/cm³ 0.61 0.59 0.60 0.62 0.66 0.62 0.63 0.66<br />
Air permeability ml/min 1873 1924 603 185 25 1203 214 19<br />
Tensile-Index Nm/g 36.7 37.9 44.1 49.4 57.0 42.1 50.5 62.3<br />
Internal bond type<br />
J/m² 229 305 345 421 453 223 463 551<br />
“Scott Bond” 1)<br />
Tearing resistance mNm/m 1275 1349 1447 1533 1724 1422 1576 1833<br />
Light-scattering coeff. m²/kg 40.6 39.1 39.8 37.1 34.3 40.3 36.8 33.6<br />
1) e.g. according to TAPPI standard T569<br />
In order to reveal more about the effectiveness <strong>of</strong> MFC the SSA was calculated based on the<br />
dewatering properties. In Table 2 the results for calculation <strong>of</strong> the SSA is listed. It is obvious the<br />
SSA <strong>of</strong> the whole pulp had been increased by MFC. With 5% MFC the SSA <strong>of</strong> the pulp was<br />
12.6 m²/g. This value is in a range usually obtained only by intensive refining. The increase<br />
shows that with MFC more OH-groups are available for forming more H-bonds between the<br />
pulp fibres. The SSA <strong>of</strong> the MFC was around 170.7 - 182.8 m²/g. This value is consistent in<br />
comparison with other authors working with nan<strong>of</strong>ibrillar cellulose aerogels. Hoepfner et al.<br />
(2008) estimated the BET surface area <strong>of</strong> freeze dried MFC at 160 m²/g and by supercritical<br />
drying in the range <strong>of</strong> 200-220 m²/g.<br />
Table 2. Mass-specific surface area (SSA) <strong>of</strong> pulp and MFC<br />
WMFC SRTotal SSATotal SSAMFC<br />
% m²/g m²/g<br />
0 28 3.6 -<br />
1 44 5.3 170.7<br />
3 68 8.8 177.7<br />
5 81 12.6 182.8<br />
Furthermore the influence <strong>of</strong> MFC on bonding strength b between the fibres was calculated<br />
according to (Eq. 5). The bonding strength for the reference pulp was calculated to be 4.76MPa.<br />
With 5% MFC the bonding strength increased to 9MPa. As mentioned above PEI as retention<br />
agent improved the retention <strong>of</strong> MFC. This is also obvious in the bonding strength, where the b<br />
was calculated to be 10.62. In Figure 1 the calculated bonding strength was plotted against the<br />
Scott bond z-strength <strong>of</strong>ten used for describing the bonding degree in the paper sheet. It is<br />
obvious there is a clear correlation between these two different approaches to estimate the<br />
bonding properties. This indicates that the applied method for calculating the bonding strength is<br />
useful to describe the bonding behaviour <strong>of</strong> MFC containing paper sheets. The results suggest<br />
that the high surface area and the available OH-groups led to much more H-bonds between the<br />
fibres in their contact areas. This can explain why the density and bulk properties were retained<br />
by application <strong>of</strong> MFC.<br />
250
Scott bond [J/m²]<br />
600<br />
500<br />
400<br />
300<br />
200<br />
MFC (0% PEI) MFC (0.25% PEI)<br />
R 2 = 0.9485 R 2 = 0.8307<br />
0% MFC<br />
COST Action E54 Book<br />
5% MFC<br />
100<br />
0 2 4 6 8 10 12<br />
bonding strength b [MPa] (calculated)<br />
Figure 1.Ccalculated bonding strength in comparison to Scott bond z-strength<br />
Conclusions<br />
The high specific surface area SSA <strong>of</strong> the MFC led to an improved interaction <strong>of</strong> fines and<br />
fibres. Increased number <strong>of</strong> H-bonds gave increased bonding strength. It may be concluded that<br />
the bonding strength is not only improved, because <strong>of</strong> a higher bonding area due to a better fines<br />
retention, but also by a higher number <strong>of</strong> H-bonds in the contact areas. However the behavior <strong>of</strong><br />
MFC is ambiguous and difficult to explain, because the decrease in light scattering properties<br />
indicates an increase in RBA, mostly connected to an increase in apparent density. But this was<br />
not observed.<br />
Acknowledgement<br />
Parts <strong>of</strong> the present work were achieved within the project SUSTAINPACK. The authors want<br />
to thank the EU-commission for funding the project SUSTAINPACK within the FP6 research<br />
program, because Parts <strong>of</strong> the present work were achieved within deliverable D2.76<br />
“Improvement <strong>of</strong> model based optimisation <strong>of</strong> demonstrator process conditions”.<br />
References<br />
Alince B., Porubská J. and van de Ven T.G.M. (2002): The Science <strong>of</strong> <strong>Papermaking</strong> 12th Fund. Res.<br />
Symp., Oxford and Cambridge Series. 1343-1355<br />
Brunauer S., Emmett P.H. and Teller E. (1938): Adsorption <strong>of</strong> gases on multimolecular layers. J. Am.<br />
Chem. Soc. 60(2) 309-319<br />
Herrick F.W., Casebier R.L., Hamilton J.K. and Sandberg K.R (1983): Micr<strong>of</strong>ibrillated cellulose:<br />
morphology and accessibility. In: A. Sarko (Ed.). Proc. Ninth Cellulose Conf. Applied Polymer Symp.<br />
37. New York City: Wiley. pp. 797–813. ISBN 0-471-88132-5<br />
Heinemann S. (1985): Contribution to determine the mass-specific surface area and its effect on strength<br />
behavior <strong>of</strong> pulps. Doctoral Thesis, Dresden University <strong>of</strong> Technology, Faculty <strong>of</strong> Engineering<br />
Heinemann S. (2001): Evaluation <strong>of</strong> Specific Surface – History or new opportunity? Int. Mech. Pulping<br />
Conf., Helsinki 2001, Finland<br />
251
COST Action E54 Book<br />
Hoepfner S., Ratke L. and Milow B. (2008): Synthesis and characterisation <strong>of</strong> nan<strong>of</strong>ibrilar cellulose<br />
aerogels. Cellulose 15 (1), 121-129<br />
Lindström T., Ankerfors M. and Henriksson G. (2007): Method for the manufacturing <strong>of</strong> micr<strong>of</strong>ibrillated<br />
cellulose. Patent Int. Publ. No.WO 2007/091942 A1<br />
Meinl G. and Erhard K. (2006): Use <strong>of</strong> numerical models for simulation <strong>of</strong> refining behaviour and<br />
resulting paper properties. 9th PIRA Int. Ref. Conf., 22-23 February 2006, Vienna, Austria<br />
Page D.H. (1969): A theory for the tensile strength <strong>of</strong> paper. Tappi J. 52 (4), 674-681<br />
Pääkkö M., Ankerfors M., Kosonen H., Nykänen A., Ahola S., Österberg M., Ruokolainen J., Laine J.,<br />
Larsson T., Ikkala O. and Lindström T. (2007): Enzymatic hydrolyis combined with mechanical shearing<br />
and high-pressure homogenization for nanoscale cellulose fibrils and strong gels. Biomacromolecules 8<br />
(6), 1934-194<br />
Retulainen E., Luukko K., Fagerholm K., Pere J., Laine J. and Paulapuro, H. (2002): <strong>Papermaking</strong> quality<br />
<strong>of</strong> fines from different pulps: the effect <strong>of</strong> size, shape and chemical composition. Appita J. 55 (6), 457-<br />
460<br />
Turbak A.F., Snyder F.W. and Sandberg, K.R (1983): Micr<strong>of</strong>ibrillated cellulose, a new cellulose product:<br />
Properties, uses and commercial potential. J. Appl. Polym. Sci.: Appl. Polym. Symp. 37: 815-827<br />
252
COST Action E54 Book<br />
STRUCTURAL AND MORPHOLOGICAL CHARACTERIZATION OF<br />
UNMODIFIED AND GRAFTED UNBLEACHED AND BLEACHED<br />
SOFTWOOD KRAFT PULP FIBERS<br />
1 Carmen-Mihaela Popescu, 1 Marian I. Totolin, 2 Carmen Mihaela Tibirna,<br />
1 Maria-Cristina Popescu, 3 Paul Ander and 1 Cornelia Vasile<br />
1 Romanian Academy “P.Poni” Institute <strong>of</strong> Macromolecular Chemistry, 41A Gr. Ghica Voda<br />
Alley, Ro.700487, IASI, Romania<br />
2 Laval University, Département de Génie Chimique, Faculté des Sciences et de Génie, Sainte-<br />
Foy, Québec (Québec) G1V 0A6 Canada.<br />
3 Department <strong>of</strong> Forest Products / Wood Science, Swedish University <strong>of</strong> Agricultural Sciences,<br />
Uppsala, Sweden<br />
Abstract<br />
E-mail: cvasile@icmpp.ro<br />
mihapop@icmpp.ro<br />
The processing <strong>of</strong> wood determines some structural modifications in its components, depending<br />
on wood type and on applied procedure. The ATR-FT-IR and XPS results supported the idea<br />
that the amount <strong>of</strong> oxygen atoms was higher on the surface <strong>of</strong> the bleached kraft pulp fibers than<br />
on the unbleached kraft pulp fibers. The decrease in the O/C ratio and the increase in the<br />
Cox/Cunox suggest the removal <strong>of</strong> the carbon-containing compounds from the pulp fiber surfaces<br />
at bleaching.<br />
The grafting degrees were <strong>of</strong> about 15 % and 56 % for unbleached kraft pulp grafted with<br />
butyric acid and oleic acid, and about 3% and 9 % for bleached kraft pulp grafted with butyric<br />
acid and oleic acid, respectively.<br />
The differences between unbleached, bleached and grafted s<strong>of</strong>twood kraft pulp fibers were<br />
dependent on the characteristic temperatures and mass losses during various thermogravimetric<br />
steps, and to the overall activation energies <strong>of</strong> decomposition.<br />
Introduction<br />
Pulp is a fibrous material prepared by chemically or mechanically separating fibers from wood,<br />
fiber crops or waste paper. Wood pulp is the most common material used to make paper. The<br />
pulp produced can be bleached to give a white paper product. The chemicals used to bleach pulp<br />
have been a source <strong>of</strong> environmental concern, and in the early 1990s the pulp industry<br />
abandoned chlorine, and are now using chlorine dioxide, oxygen, ozone, hydrogen peroxide<br />
(Gellerstedt 2003) and enzymes (Viikari and Lantto 2002) for pulp bleaching. Paper made from<br />
bleached kraft or sulfite pulps does not contain significant amounts <strong>of</strong> lignin and is therefore<br />
better suited for books, documents and other applications where high brightness <strong>of</strong> the paper is<br />
essential.<br />
Risen et al. (2004) showed that the surface <strong>of</strong> s<strong>of</strong>twood and hardwood kraft pulp fibers contain<br />
larger lignin and extractive amounts than in the fiber walls. Chemical esterification <strong>of</strong> cellulose<br />
with fatty acids in special solvents, in the presence <strong>of</strong> acid chlorides, pyridine and trifluoroacetic<br />
253
COST Action E54 Book<br />
acid was developed by Vaca-Garcia et al. (1998). In such cases, the pollution is high, so a<br />
physical functionalization <strong>of</strong> vegetable fiber was recommended by Ludwick et al. (2002). Cold<br />
plasma (low temperature and low pressure) technique appears as a useful and suitable technique<br />
to: (a) increase wettability <strong>of</strong> the treated surface; (b) increase surface adhesion <strong>of</strong> different<br />
coating lacquers and binders; (c) render the surface hydrophilic or hydrophobic, e.g.<br />
compatibilization <strong>of</strong> the material with non-polar matrices such as polypropylene; (d) to stabilize<br />
wood against weathering; (e) to induce grease barrier properties.<br />
The present paper deals with characterization <strong>of</strong> the structural, morphological and thermal<br />
properties <strong>of</strong> s<strong>of</strong>twood kraft pulp fibers for elucidating, on a molecular basis, the differences<br />
observed after pulp bleaching and grafting.<br />
Materials and methods<br />
The unbleached (UBP) and bleached (BP) s<strong>of</strong>twood kraft pulps, delivered to the partners <strong>of</strong> the<br />
COST Action E54, were commercial batch cooked pulps, supplied by Södra Cell, Sweden. The<br />
spruce (Picea abies) to pine (Pinus sylvestris) ratio was 79:21. The unbleached pulp was<br />
sampled after the oxygen delignification stage. The bleaching sequence was Q-OP-Q + Paa-PO,<br />
where Q represents the chelating agent; OP is oxygen + peroxide and Paa is peracetic acid. The<br />
kappa numbers were 26.8 for unbleached and 3.2 for bleached pulps. Different working groups<br />
involved in COST Action E54 have determined the pulp properties. The average properties <strong>of</strong><br />
the unbleached and bleached kraft pulps are presented in Table 1.<br />
Table 1. Properties <strong>of</strong> s<strong>of</strong>twood kraft pulp fibers<br />
Property Unbleached Bleached<br />
Wall thickness, μm 8.2 7.8<br />
Intrinsic viscosity, ml/g 1109 728<br />
Kappa number 26.8 3.2<br />
Dry matter content, % 32.3 32.8<br />
Bulk density, cm 3 /g 1.9 1.79<br />
Tensile strength, kN/m 1.92 1.74<br />
Stretch, % 2.1 3.4<br />
Tensile energy absorption, J/m 2 30.9 47.3<br />
Tensile stiffness, kN/m 296 241<br />
Modulus <strong>of</strong> elasticity, N/mm 2 2420 2129<br />
The butyric (BA) and oleic (OA) acids used for fibers impregnation were purchased from Merck<br />
and Aldrich, respectively. The experimental set-up for cold plasma fiber grafting has been<br />
previously presented (Totolin et al. 2008). The investigation methods applied were both bulk<br />
and surface characterization methods. The bulk methods <strong>of</strong> characterization were the following:<br />
FT-IR spectroscopy, X-ray diffraction, differential scanning calorimetry and thermogravimetry<br />
(see also Popescu et al. 2008; Totolin et al. 2008), while the surface methods were: ATR FT-IR<br />
spectroscopy, X-ray photoelectron spectroscopy (XPS) and scanning electron microscopy.<br />
Results and Discussion<br />
Bulk characterization <strong>of</strong> s<strong>of</strong>twood kraft pulp fibers before and after grafting FT-IR<br />
spectroscopy<br />
Figure 1 shows the IR spectra and their second derivative in the 3800-2700 cm -1 region <strong>of</strong><br />
unbleached and bleached pulp fiber samples. In this region the bands have lower intensities in<br />
the spectrum <strong>of</strong> the bleached pulp fiber than in the unbleached one. The most significant<br />
254
COST Action E54 Book<br />
absorbance bands in the 3800-2700 cm -1 region are those assigned to valence vibrations <strong>of</strong> the<br />
OH groups forming inter- and intramolecular H–bonds in pulp fiber samples and to valence<br />
vibration <strong>of</strong> the C-H groups.<br />
(a) (b)<br />
Figure 1. FT-IR spectra (a) and second derivative (b) in the 3800-2700 cm -1 <strong>of</strong> the studied samples:<br />
unbleached (black line) and bleached (grey line) kraft pulp fibres<br />
A broad band, with a maximum around 3410 cm -1 , was observed in the spectrum <strong>of</strong> the<br />
unbleached pulp sample. The intensity <strong>of</strong> this band decreased after bleaching. These<br />
observations reflect variations in the hydrogen-bond structure <strong>of</strong> cellulose after bleaching. At<br />
least six peaks were identified in the second derivative spectra in the 3700-3000 cm -1 region.<br />
According to literature data, an intramolecular hydrogen bond vibration, derived from O2–<br />
H2···O6, could be expected between 3460 and 3410 cm -1 . As the O2–H2···O6 distance is larger<br />
than that <strong>of</strong> the O5–H5···O3 intra-molecular bonded system, this appeared at a higher frequency.<br />
A strong band was found in this range, emphasizing that the O5–H5···O3 hydrogen bonds have a<br />
smaller influence on load distribution. In kraft pulp fibres, two bands were found in this region,<br />
at 3462 and 3431 cm -1 . The inter-chain hydrogen bonds, involving the C6 position (primary<br />
hydroxyl groups), result in the formation <strong>of</strong> crystalline regions and contribute to the O-H band at<br />
3430 cm -1 . In addition, the fact that the maximum wavenumber for the O-H stretching band was<br />
below 3400 cm -1 indicates that the crystalline domains in both samples have a type I lattice.<br />
These bands shifted to 3469 and 3425 cm -1 in the spectrum <strong>of</strong> the bleached pulp. The<br />
frequencies for the O5–H5···O3 intramolecular hydrogen bonds were between 3350 and 3375<br />
cm -1 , while in the spectra <strong>of</strong> kraft pulp fibres, they occurred at 3345 cm -1 . A shift to lower<br />
frequencies can probably be explained by the stretching <strong>of</strong> cellulose molecules, parallel to the<br />
main fiber direction. Both bands <strong>of</strong> cellulose I were found at slightly lower frequencies in the<br />
pulp fiber spectra, at 3267 cm -1 for cellulose Iβ and at 3222 cm -1 for cellulose Iα, as shown in<br />
Figure 1. The O–H stretching region was deconvoluted into Gaussian pr<strong>of</strong>iles, which allows<br />
comparing the band positions between spectra, when the band widths and the extent <strong>of</strong> the<br />
overlap differ (Figure 2).<br />
Table 2. Energy <strong>of</strong> hydrogen bonding for the unbleached and bleached pulp samples<br />
Sample<br />
3565 cm<br />
Energy <strong>of</strong> the hydrogen bonds (EH) (kJ/mol)<br />
-1 3465 cm -1 3430 cm -1 3350 cm -1 3269 cm -1 3222 cm -1<br />
Unbleached 6.08 13.44 15.66 21.74 26.67 30.61<br />
Bleached 6.65 12.94 16.09 21.18 26.60 30.61<br />
After deconvolution as seen in Figure 2, six O–H stretching bands were identified and used to<br />
calculate energy (Table 2; Struszczyk 1986) and hydrogen bonding distance. The calculated<br />
255
COST Action E54 Book<br />
energies (Table 2) were higher for both hydrogen bonds <strong>of</strong> the free OH and O2–H2···O6 intramolecular<br />
H–bonds in cellulose for the bleached pulps. The hydrogen bonding distances values<br />
were the same in both samples for all six types <strong>of</strong> H–bonds from cellulose.<br />
a. b.<br />
Figure 2. Deconvoluted spectra <strong>of</strong> the 3800-2800 cm -1 regions for unbleached (a) and bleached (b) pulp<br />
samples<br />
In the “fingerprint region”, the spectra <strong>of</strong> the pulp samples were very complex, containing many<br />
bands assigned to cellulose and to the residues <strong>of</strong> lignin and hemicelluloses - Figures 3a and b.<br />
In normal spectra <strong>of</strong> kraft pulp fibers, small differences could be observed.<br />
The occurrence <strong>of</strong> low intensity bands at 1694, 1586, 1512, 1406 and 1259 cm -1 is undoubtedly<br />
due to the presence <strong>of</strong> small amounts <strong>of</strong> lignin in a fiber preparation with complex composition.<br />
The band at 1694 cm -1 indicates a C=O stretching in unconjugated ketones, carbonyl and ester<br />
groups, while the bands at 1586 and 1512 cm -1 indicate the aromatic skeleton vibrations in<br />
lignin. Also, syringyl and guaiacyl ring and CO stretching appears at 1259 cm -1 and CH2<br />
scissoring at 1406 cm -1 . All these bands are very small in the spectrum <strong>of</strong> bleached pulp fibers,<br />
indicating a very low amount <strong>of</strong> lignin in this sample. The absorbancies at 1453, 1373, 1340,<br />
1318, 1282, 1163, 1128, 1113, 1069, 1032 and 1000 cm -1 , seen in both spectra, are associated<br />
with different stretching vibrations or deformations in cellulose and hemicelluloses. These bands<br />
decreased after bleaching, meaning that hemicelluloses were removed during bleaching. A<br />
confirmation that both samples have a type I cellulose lattice is supplied by the wavenumber <strong>of</strong><br />
the CH2 scissoring mode at 1428 cm -1 .<br />
Figure 3. FT-IR spectra (left) and second derivative (right) at 1800-800 cm -1 <strong>of</strong> the studied samples:<br />
unbleached (black) and bleached (grey) kraft pulp fibers<br />
256
COST Action E54 Book<br />
The crystallinity values <strong>of</strong> both samples from FT-IR spectra were estimated by a rapid method,<br />
proposed by Hulleman et al. (1994) for cellulose I, based on the observation that the band at<br />
1280 cm -1 , assigned to the C–H bending mode, increases with increasing crystallinity, whereas<br />
the band assigned to the C–O–C stretching mode <strong>of</strong> the pyranose ring, at 1200 cm -1 , is sensitive<br />
to that parameter. The ratio between the absorption intensities <strong>of</strong> these two bands<br />
(Rc,h=I1280/I1200) was used to determine cellulose crystallinity. This correlation is valid only over<br />
the 0.26 ≤ xc ≤ 0.75 range, expressing the limits <strong>of</strong> cellulose crystallinity used by Hulleman et al.<br />
(1994). The values obtained were 56 ± 1% and 58 ± 1% for unbleached and bleached pulp<br />
fibers, respectively.<br />
In case <strong>of</strong> pulps grafted with butyric acid the IR spectrum was approximately the same as that<br />
for untreated sample. This fact indicates a low amount <strong>of</strong> butyric acid grafted upon the pulp fiber<br />
surfaces. The effect <strong>of</strong> plasma treatment can be assessed by observing the 1715 and 1610 cm -1<br />
bands. The intensities <strong>of</strong> the two peaks increased after plasma grafting with fatty acids especially<br />
in the case <strong>of</strong> oleic acid. The increase <strong>of</strong> the grafted amount results in an increase <strong>of</strong> the<br />
intensities <strong>of</strong> the peaks 1735 and 2855 + 2923 cm -1 . The integrated intensities <strong>of</strong> the peak 1735<br />
cm -1 can be used to predict the percentage <strong>of</strong> grafting. These are 16.13 % for UBP and 13.97 %<br />
for BP, increasing up to 17.74 % for UBP+BA, 37.08 % for UBP+OA and 14.44 % for BP+BA,<br />
16.32 % for BP+OA, respectively. Thus, considering the values <strong>of</strong> these integrated intensities <strong>of</strong><br />
the bands, the grafting degrees were estimated to be about 15 % and 56 % for UBP+BA and<br />
UBP+OA, and at about 3% and 9 % for BP+BA and BP+OA, respectively.<br />
X-Ray diffraction (XRD)<br />
Isogai et al. (1994) established that cellulose I, typically shows peaks at 2θ <strong>of</strong> 15, 16.5 and 23 o<br />
due to (101), (10Ī) and (002) reflections, respectively. A shoulder at 2θ <strong>of</strong> 20 o due to (102)<br />
reflection was also noted by Rowland (1974) and Kumar (1999) in certain cellulose materials.<br />
The X-ray peaks at 2� <strong>of</strong> 15 o and 2� <strong>of</strong> 16.5 o merged into a broad band, which is consistent with<br />
literature data.<br />
The unbleached and bleached s<strong>of</strong>twood kraft pulp fibers display typical X-ray pattern <strong>of</strong><br />
cellulose I - Figure 4. The peak for the (002) plane in the intensity pr<strong>of</strong>iles <strong>of</strong> the bleached pulp<br />
fibers became sharper than that <strong>of</strong> the unbleached one, and the shoulder at around 20 o has a<br />
tendency to increase in intensity during bleaching. In order to examine the intensities <strong>of</strong><br />
diffraction bands and to establish the crystalline and the amorphous areas more exactly, the<br />
diffractograms were deconvoluted using Gaussian pr<strong>of</strong>iles.<br />
Figure 4. X-ray diffractograms <strong>of</strong> unbleached (left) and bleached (right) wood pulp samples<br />
257
COST Action E54 Book<br />
After deconvolution, five bands were observed, namely: one around 2� <strong>of</strong> 15.2-15.5 o reflection<br />
assigned by Silva et al. (2008) and other researchers to the (101) crystallographic plane, the 2� =<br />
16.8-17.0 o reflection, assigned to the (10Ī) crystallographic plane, the 2� = 18.8 o reflection,<br />
assigned to amorphous phases, the 2� = 20.6 o reflection, assigned to the (102) crystallographic<br />
plane, and the 2� = 22.6 o reflection, assigned to the (002) crystallographic plane <strong>of</strong> cellulose I.<br />
The position <strong>of</strong> the peaks <strong>of</strong> cellulose crystalline form I, were found to be slightly shifted to<br />
higher theta degree in bleached pulp fibers than in unbleached pulp fibers indicating a decrease<br />
in d-spacing.<br />
In Table 3 the calculated parameters for the studied samples are presented. The degree <strong>of</strong><br />
crystallinity (CrI) using both FT-IR spectroscopy and X-ray diffraction was found to increase<br />
slightly after bleaching. The more crystalline the cellulose is, the larger the micr<strong>of</strong>ibril lateral<br />
size is. On the other hand, values determined by SEM were six times higher, even for samples<br />
which appear to be single micr<strong>of</strong>ibrils, which might suggest that in fact they are composed <strong>of</strong><br />
several individual micr<strong>of</strong>ibrils.<br />
Table 3. The calculated parameters for the studied samples<br />
Parameters Unbleached UBP+ OA Bleached BP+OA<br />
Cr. I. 60 57 62 59<br />
Cr. I’ 56 -- 58 --<br />
L101 (nm) 3.26 3.29 3.36 3.39<br />
L10Ī (nm) 5.57 5.96 5.86 5.97<br />
L002 (nm) 4.08 4.76 4.18 4.36<br />
X 0.52 0.57 0.53 0.55<br />
Cellulose fraction 0.86 0.81 0.88 0.84<br />
Cr.I – crystalline index evaluated by XRD, Cr.I’ - crystalline index evaluated by FT-IR spectroscopy, L - apparent<br />
crystallite size, X - proportion <strong>of</strong> crystallite interior chains<br />
The observed lower values <strong>of</strong> the apparent crystallite size for unbleached pulp fibers as<br />
compared with bleached pulp fibers may be due to the presence <strong>of</strong> defects in the crystalline<br />
region <strong>of</strong> the cellulose fiber. Increase in the apparent crystallite size <strong>of</strong> cellulosic particles after<br />
bleaching may indicate that the number <strong>of</strong> small crystallites decreased, resulting in improvement<br />
<strong>of</strong> the crystallinity <strong>of</strong> the fiber. The full width at half maximum <strong>of</strong> the diffraction peaks<br />
decreased after bleaching for all deconvoluted bands.<br />
As seen in Table 3, both determination methods show that the degree <strong>of</strong> crystallinity (CrI)<br />
decreased after plasma grafting and was much more important for unbleached pulp fibers grafted<br />
with oleic acid affecting also the bulk morphology. For the bleached pulp fibers the effect <strong>of</strong><br />
grafting was less obvious for the small size alkyl chain such as butyric acid than for oleic acid<br />
with C-18 alkyl chain. The comparison <strong>of</strong> bleached versus unbleached pulp is interesting since<br />
the difference in crystallinity <strong>of</strong> the initial samples can be attributed to the residual lignin<br />
(presence as fine particles) which becomes particularly evident when comparing the crystallinity<br />
<strong>of</strong> grafted unbleached and bleached pulp samples.<br />
Thermogravimetry<br />
The mass loss (TG) and derivative (DTG) curves <strong>of</strong> unbleached, bleached and grafted s<strong>of</strong>twood<br />
pulp fibers are shown in Figure 5. The degradation characteristics <strong>of</strong> pulp fibers can be<br />
quantified through several parameters, which are related to the temperature ranges <strong>of</strong> the<br />
different steps <strong>of</strong> mass loss and residual yield as given in Table 4.<br />
258
COST Action E54 Book<br />
In general, TG/DTG curves have two steps <strong>of</strong> mass loss, easily observed from DTG curves. The<br />
first step seen in Figure 5 corresponds to loss <strong>of</strong> physically or chemically bound water and<br />
certain volatile substances. In Step I, combustion <strong>of</strong> hemicelluloses and amorphous and<br />
crystalline cellulose and also complete combustion <strong>of</strong> residual compounds and lignin occurs.<br />
The first process occurs from 45 o C to 150 o C with maximum at 76 o C for unbleached pulp and<br />
59 o C for bleached pulp (Step I in Table 4). The mass loss was about 2.1 wt % for unbleached<br />
pulp fibers and larger for bleached ones. As the temperature increased the mass remained<br />
constant until 210 o C at beginning <strong>of</strong> the thermal degradation. The main mass loss was obtained<br />
in the 210-425 o C temperature range for unbleached pulp and at 200-420 o C for bleached pulp<br />
(Figure 5 and Table 4) as a consequence <strong>of</strong> cellulose decomposition.<br />
Figure 5. TG/DTG curves for wet unbleached, bleached and plasma grafted kraft pulp fibers<br />
The temperature for the maximum decomposition rate <strong>of</strong> Step II was approximately the same in<br />
both UBP and BP, namely 354 and 356 °C as seen in Table 4. A similar result has also been<br />
found by Yang (2006). The mass loss (about 76 mass- %) was higher for unbleached pulp fibers,<br />
while for bleached pulp fibers it was about 73.2 mass- % (Table 4). This behavior corroborate<br />
with the more compact and more oriented structure <strong>of</strong> the bleached pulp fibers studied by<br />
Carrillo (2004).<br />
In Step II, the initial temperatures for grafted fibers were mostly higher than those for the<br />
untreated pulps. The initial temperatures shifted to higher temperatures, indicating an increase in<br />
thermal stability. Furthermore, the grafted samples yielded a residual mass which decreased for<br />
unbleached pulp fibers treated with butyric acid and were constant for that treated with oleic<br />
acid, and increased for both treated bleached pulps fibers.<br />
Although not shown, the residual mass increased from 21.9 mass-% to 32.4 mass-% for butyric<br />
acid treated unbleached pulp fibers and decreased by 19.9 mass-% for oleic acid treated<br />
unbleached pulp fibers; while for bleached pulp fiber grafted with butyric and oleic acids<br />
decreased from 22.5 mass-% to 17.5 mass-% and 17.6 mass-%, respectively. The residual mass<br />
was calculated by substracting from 100% the mass losses for the first and second processes<br />
which are presented in Table 4.<br />
259
COST Action E54 Book<br />
Table 4. Thermogravimetric data for the studied unbleached and bleached pulps ± BA or OA<br />
Step<br />
no.<br />
Step I<br />
Step II<br />
TG<br />
characteristic<br />
UBP UBP + BA UBP + OA BP BP + BA BP + OA<br />
Ti ( 0 C) 36.0 32.0 28.0 36.0 31.8 30.5<br />
Tm ( 0 C) 75.8 56.0 51.5 59.2 55.4 54.4<br />
Tf ( 0 C) 152.0 126.7 127.7 153.7 121.4 133.9<br />
Wi (mass-%) 2.1 1.8 3.4 4.3 2.5 2.3<br />
Ti ( 0 C) 210.9 193.9 211.3 198.8 203.1 227.1<br />
Tm ( 0 C) 354.3 351.3 361.9 355.8 361.7 362.4<br />
Tf ( 0 C) 424.5 407.6 419.1 421.8 417.5 420.9<br />
Wi (mass-%) 76.0 65.8 76.7 73.2 80.0 80.1<br />
Ti – initial temperature, Tm - temperature corresponding to the maximum rate <strong>of</strong> mass loss and Tf - end<br />
temperature; w - mass loss<br />
The overall kinetic parameters obtained by Coats Redfern, Flynn – Wall and Urbanovici – Segal<br />
methods (Popescu et al. 2008), are in accordance with our results in Table 5. The overall<br />
activation energy <strong>of</strong> the first thermogravimetric step was higher for unbleached pulp fibers<br />
(52 kJ/mol) than for bleached pulp fibers (43 kJ/mol). The reaction orders (nCR or nFW or nUS)<br />
gave values around 1.3. It can be supposed that this is a chemical process <strong>of</strong> elimination <strong>of</strong><br />
chemically bound water or other low molecular weight compounds (Table 5).<br />
Table 5. Overall kinetic parameters <strong>of</strong> the thermogravimetric steps for UBP and BP ± OA<br />
Step no.<br />
Step I<br />
Step II<br />
Kinetic<br />
parameters<br />
Unbleached UBP + OA Bleached BP +OA<br />
ECR kJ/mol 51.86 75.2 42.80 77.1<br />
nCR 1.30 1.7 1.20 1.7<br />
EFW kJ/mol 51.51 76.9 46.55 78.7<br />
nFW 1.20 1.7 1.20 1.8<br />
EUS kJ/mol 44.77 75.9 38.67 78.0<br />
nUS 1.00 1.7 1.00 1.7<br />
ECR kJ/mol 126.4 156.5 132.1 156.1<br />
nCR 1.30 1.4 1.40 1.1<br />
EFW kJ/mol 126.3 158.0 134.7 157.9<br />
nFW 1.20 1.4 1.40 1.1<br />
EUS kJ/mol 125.0 159.6 130.2 157.2<br />
nUS 1.2 1.4 1.3 1.2<br />
The activation energies <strong>of</strong> the first thermogravimetric step decreased for plasma grafted sample<br />
for both unbleached and bleached pulps. The reaction orders gave values around 1.6-1.7 for pulp<br />
fibers grafted with butyric acid and 1.7-1.8 for those grafted with oleic acid, so this can be<br />
considered as an order controlled reaction.<br />
The overall activation energy in Table 5 for Step II was 126 kJ/mol for unbleached pulp fibers,<br />
and around 132 kJ/mol for the bleached pulp fibers. In this case the reaction order was 1.3 for<br />
unbleached and 1.4 for bleached pulp fibers. In the second thermogravimetric step, significant<br />
changes in the kinetic parameters were obtained for fibers grafted with oleic acid (OA).<br />
Differential Scanning Calorimetry (DSC) results<br />
In Table 6 are given DSC data for untreated and plasma treated unbleached and bleached pulp<br />
fibers.<br />
260
COST Action E54 Book<br />
Table 6. DSC results for UBP and BP untreated and plasma treated samples<br />
Property UBP UBP+ OA BP BP+OA<br />
T ( 0 C), 158.3 155.3 158.5 159.2<br />
�H (J/g) -123.3 -83.9 -202.5 -83.0<br />
Tinfl ( 0 C), 144.4 -- 136.6 133.2<br />
T is peak temperature and Tinfl is inflexion temperature<br />
A broad endothermic peak observed in the temperature range <strong>of</strong> 60–160 o C in plasma treated<br />
pulp fibers corresponds to vaporization heat for water absorbed in the fibers and/or evolution <strong>of</strong><br />
some volatile compounds. Due to different strength values <strong>of</strong> water binding in the case <strong>of</strong> grafted<br />
fibers, the characteristic temperatures and the enthalpies vary with the nature <strong>of</strong> the grafts.<br />
Surface characterization<br />
Attenuated Total Reflectance FT-IR spectroscopy<br />
The ATR FT-IR spectra <strong>of</strong> the unbleached and bleached pulp fibers and unbleached kraft pulp<br />
grafted with oleic acid samples are presented in Figure 6.<br />
Figure 6. ATR FT-IR spectra for unbleached pulp, bleached pulp and unbleached pulp grafted with oleic<br />
acid<br />
IR spectra <strong>of</strong> grafted fibers with oleic acid showed a shift and splits <strong>of</strong> the bands found at 2901<br />
cm -1 in two bands located at 2850 cm -1 and 2923 cm -1 assigned to the asymmetric and symmetric<br />
CH2 vibrations. The ester bonds in plasma-grafted samples became obvious at 1715 and 1610<br />
cm -1 . The presence <strong>of</strong> the spectral bands located at 1715, 2850, and 2923 cm -1 indicates that the<br />
oleic acid was efficiently grafted onto the pulp fiber surface.<br />
X-ray photoelectron spectroscopy (XPS)<br />
XPS analysis <strong>of</strong> unbleached and bleached s<strong>of</strong>twood pulp fibers revealed the presence <strong>of</strong> oxygen<br />
and carbon from the pulp fibers surface (Figure 7), which give the relative composition <strong>of</strong> O and<br />
C atoms and the calculated oxygen to carbon (O/C) ratio for all species.<br />
261
COST Action E54 Book<br />
Figure 7. XPS spectra unbleached (UBP) and oleic acid grafted (UBP+OA) pulp fibers<br />
The percentage <strong>of</strong> oxygen detected (Table 7) was higher for bleached pulp (37.5 %) than for<br />
unbleached pulp (35.7%), while treatment with oleic acid gave 16.7% and 32.3%, respectively).<br />
The percentage <strong>of</strong> carbon atoms was lower on the surface <strong>of</strong> the untreated pulp fibers. These<br />
changes were more evident in case <strong>of</strong> unbleached pulp fibers.<br />
The O/C ratio increased from 0.56 to 0.61 after bleaching. The high carbon content in the pulp<br />
samples was reported to be an indication <strong>of</strong> the presence <strong>of</strong> lignin and extractives on the pulp<br />
fiber surfaces. The increase in O/C following bleaching is due to partial removal <strong>of</strong> carbon-rich<br />
extractives such as fatty acids, terpenes, and phenolics. The modification with oleic acid gave<br />
rise to a significant change in the O/C ratio, as well as in the amount <strong>of</strong> non oxygenated C bonds<br />
that was significantly higher for unbleached grafted pulp fibers. This confirms successful<br />
attachment <strong>of</strong> oleic acid chains to the cellulose surface.<br />
Table 7. Atomic composition (%) and O/C ratio obtained by XPS analysis <strong>of</strong> pulp samples<br />
Sample % C % O O/C<br />
UBP 63.2 35.7 0.56<br />
UBP+OA 82.7 16.7 0.20<br />
BP 61.6 37.5 0.61<br />
BP+OA 67.6 32.3 0.48<br />
C1s peaks were deconvoluted into 4 components, C1, C2, C3 and C4. The C1 corresponds to a<br />
carbon atom bound only to other carbon atoms and/or hydrogen atoms. It has been established<br />
by Kamdem (1991) that this component arises mainly from lignin and wood extractives. The C2<br />
component is due to a carbon bound to a single non-carbonyl oxygen atom, which has been<br />
shown to be mainly derived from cellulose. The C3 peak represents a carbon atom bound to a<br />
carbonyl oxygen or to two non-carbonyl oxygen atoms. The C4 represents a carbon atom linked<br />
to one carbonyl oxygen and one non-carbonyl oxygen.<br />
The signals for the C1-C4 shifted to higher binding energies after bleaching. The height <strong>of</strong> the<br />
C1 peak decreased, while the C2 peak increased during bleaching <strong>of</strong> the pulp fibers – Table 8.<br />
This can be explained by a higher quantity <strong>of</strong> cellulosic component, after removal <strong>of</strong><br />
hemicelluloses and lignin. The C3 peak shows a slight increase and the C4 peak was<br />
insignificant in both samples (only 1.0 and 0.83%). This is explained by a possible low<br />
concentration <strong>of</strong> carboxylic groups on the pulp fiber surfaces.<br />
262
COST Action E54 Book<br />
Table 8. Integrated area (%) <strong>of</strong> the C1-C4 peaks obtained by XPS analysis <strong>of</strong> pulp samples<br />
Sample C1 C2 C3 C4<br />
UBP 20.93 57.42 20.63 1.00<br />
BP 14.54 54.93 29.70 0.83<br />
BP+OA 26.22 48.07 20.99 4.72<br />
The C1 shape for bleached pulp fibers grafted with oleic acid was similar to ungrafted pulp, but<br />
with differences appearing in peak intensities and areas. The areas <strong>of</strong> C1 and C4 peaks increased,<br />
while the areas <strong>of</strong> C2 and C3 peaks decreased after grafting, see Table 8.<br />
It has been previously shown by Barry (1990) and Hua (1993) that the O1 fraction can be<br />
associated with lignin and extractives, the elimination <strong>of</strong> which decreased the O1 fraction and<br />
increased the O1 fraction originating from cellulose and hemicelluloses. The same pattern was<br />
observed in our case in the bleached pulps.<br />
The oxygen peaks for the unbleached and bleached pulp fibres treated with oleic acid showed a<br />
decrease <strong>of</strong> the O1 peak. At the same time, the O2 and O3 peaks increased, thus the state <strong>of</strong> the<br />
oxygen containing groups changed after grafting.<br />
Considering the content <strong>of</strong> hydroxyl groups in the superficial layers <strong>of</strong> the cellulose fibers (up to<br />
~ 10 nm in depth) – determined to be 57.4 % for unbleached pulp fibers and 54.9 % for bleached<br />
pulp fibers respectively – and also the variation <strong>of</strong> the C2 groups, which decreased after cold<br />
plasma treatment with oleic acid, and the increase <strong>of</strong> the C4 groups for treated samples, a<br />
grafting degree <strong>of</strong> the superficial layers was estimated to be about 55 % for unbleached pulp<br />
fibres and 15% for bleached pulp fibres, which is in good accordance with ATR-IR results.<br />
Scanning electron microscopy<br />
The unbleached material was quite heterogeneous and the individual fibers were intact as seen in<br />
Figure 8a. As is evident from the micrographs, the bleached s<strong>of</strong>twood pulp fibers had a fibrous<br />
structure similar to that <strong>of</strong> unbleached fibers, but the diameter <strong>of</strong> the fibers seemed to be smaller<br />
after bleaching. Thus, the average diameter <strong>of</strong> the fibers in the unbleached pulp was 29.9 ± 2.3<br />
µm, while the bleached fibers only were 27.5 ± 1.6 µm in diameter. After grafting (Figures 8c<br />
and d) with butyric acid the pulp fibers showed a rough surface, were fragmented and showed<br />
formation <strong>of</strong> pits on the fiber surface, while the pulp fibers grafted with oleic acid had a more<br />
pronounced roughness <strong>of</strong> the surface, a deposition <strong>of</strong> oleic acid on the fiber surfaces was<br />
evident.<br />
a. b. c d<br />
Figure 8. SEM micrographs <strong>of</strong> unbleached (a) bleached (b) and UBP + BA (c), UBP + OA (d) pulp<br />
fibers<br />
263
Conclusions<br />
COST Action E54 Book<br />
Unmodified and modified (plasma treated) COST E54 pulp fibers were characterized regarding<br />
their structural, morphological and surface characteristics in order to find differences introduced<br />
by the different pre- and post-treatment.<br />
The increase in the apparent crystal size and crystallinity index determined by XRD <strong>of</strong> cellulosic<br />
particles after bleaching showed that the number <strong>of</strong> small crystallites decreased, resulting in<br />
improvement <strong>of</strong> fiber crystallinity, an effect intensified by the removal <strong>of</strong> the amorphous portion<br />
<strong>of</strong> hemicelluloses and lignin during bleaching.<br />
The differences between unbleached and bleached s<strong>of</strong>twood pulp fibers appeared also in<br />
characteristic temperatures, mass losses and overall activation energies. A decrease in O/C ratio<br />
and an increase in the Cox/Cunox suggests the removal <strong>of</strong> carbon compounds from the pulp fibers<br />
surface during bleaching, giving that more cellulose is exposed on the surface after bleaching.<br />
The content <strong>of</strong> C atoms decreased and the content <strong>of</strong> O atoms increased after bleaching. The<br />
unbleached material was quite heterogeneous and entangled and the individual fibers intact.<br />
After bleaching the surface <strong>of</strong> the individual fibers changed and appeared smooth and the<br />
cellulose fibers were oriented in one direction. The diameter <strong>of</strong> the fibers seemed to become<br />
smaller after bleaching.<br />
This work clearly shows that cellulose macromolecules can be grafted successfully by fatty acids<br />
using a “green” process (cold plasma). Such treatment can be transferred to practical<br />
technologies, particularly in papermaking and textile applications, in which the hydrophobizing<br />
<strong>of</strong> the tissues or paper-based packaging materials is an important issue.<br />
Acknowledgements<br />
The EU COST Action E54 “Characterisation <strong>of</strong> the fine structure and properties <strong>of</strong><br />
papermaking fibres using new technologies” and Romanian ANCS and CNCSIS by IDEI<br />
17/2007 are acknowledged for financial support. Karin Sjöström, Södra Cell, Sweden is<br />
acknowledged for supplying the s<strong>of</strong>twood kraft pulp samples and some pulp specifications. Pulp<br />
chemical composition was analysed at Stora Enso, Karlstad, Sweden.<br />
References<br />
Barry A. O. and Zoran Z. (1990): Surface analysis by ESCA <strong>of</strong> sulfite post-treated CTMP. J. Appl.<br />
Polym. Sci. 39(1), 31-42<br />
Carrillo F., Colom X., Sunol J. J. and Saurina J. (2004): Structural FTIR analysis and thermal<br />
characterisation <strong>of</strong> lyocell and viscose-type fibres. Eur. Polym. J. 40(9), 2229-2234<br />
Gellerstedt (2007): Chemistry <strong>of</strong> bleaching. In: The Ljungberg Textbook Wood Chemistry and Wood<br />
Biotechnology, 3D1058, Ch. 26. Printed by Fibre and Polymer Technology, KTH. ISSN 1652-2443<br />
Hua X., Kaliaguine S., Kokta B. V. and Adnot A. (1993): Surface analysis <strong>of</strong> explosion pulps by ESCA.<br />
Wood Sci. Technol. 28, 1-15<br />
Hulleman S. H. D., van Hazendonk J. M. and van Dam J. E. G. (1994): Determination <strong>of</strong> crystallinity in<br />
native cellulose by Fourier transform infrared spectroscopy. Carbohydr. Res. 261, 163-171<br />
Isogai I. (1994). Allomorphs <strong>of</strong> cellulose and other polysaccharides, In R. D. Gilbert (Ed), Cellulosic<br />
Polymers, Blends and Composites. Hanser/Garner Publications, Cincinnati, OH, 5-23<br />
264
COST Action E54 Book<br />
Kamdem D. P., Riedl B., Adnot A. and Kaliaguine S. (1991): ESCA spectroscopy <strong>of</strong><br />
poly(methylmetacrylate) grafted onto wood fibers. J. Appl. Polym. Sci. 43, 1901-1912<br />
Kumar V. and Kothari S. H. (1999). Effect <strong>of</strong> compressional force on the crystallinity <strong>of</strong> directly<br />
compressible cellulose excipients. Int. J. Pharmaceutics. 177, 173-182<br />
Ludwick A.G., Aglan A.H., Abdalla M.A., Badran B., Ashour M., Morcos V., Hassan R. and Mahmoud<br />
M. (2002). Chemical and engineering modifications <strong>of</strong> bagasse for oil absorption. In: G.A. Uzochukwu,<br />
K. Schimmel, G. Reddy, S.Y. Chang and V. Kabah (Eds.), Proc. 2002 National Conf. Environ. Sci.<br />
Technol., Greensboro, North Carolina, USA, September 8 - 10<br />
Popescu C.-M., Tibirna C. M., Raschip I. E., Popescu M. C., Ander P. and Vasile C. (2008): Bulk and<br />
surface characterization <strong>of</strong> unbleached and bleached s<strong>of</strong>twood kraft pulp fibres. Cellulose Chem.<br />
Technol. 42(9-10), 525-547<br />
Risen J., Heijnesson-Hultén A. and Paulsson M. (2004): Surface characterization <strong>of</strong> s<strong>of</strong>twood and<br />
hardwood kraft pulp fibers from different stages in a bleaching sequence. J. Wood Chem. Technol. 24(4),<br />
307-321<br />
Rowland P. R. and Roberts E. J. (1974): Availibity <strong>of</strong> hydroxyl groups for reaction in fibrous cotton<br />
cellulose II and hydrocellulose II. J. Polym. Sci. 12, 96-101<br />
Silva M. C., Lopes O. R., Colodette J. L., Porto A. O., Rieumont J., Chaussy D., Belgacem M. N. and<br />
Silva G. G. (2008): Characterization <strong>of</strong> three non-product materials from a bleached eucalyptus kraft pulp<br />
mill, in view <strong>of</strong> valorising them as a source <strong>of</strong> cellulose fibres. Ind. Crops Prod. 27, 288-295<br />
Struszczyk H. (1986): Modification <strong>of</strong> lignins. III. Reaction <strong>of</strong> lignosulfonates with chlorophosphazenes.<br />
J. Macromol. Sci. A-23, 973-980<br />
Totolin M. I., Vasile C., Tibirna C. M. and Popescu M.-C. (2008): Grafting <strong>of</strong> Spanish broom (Spartium<br />
junceum) fibers with fatty acids under cold plasma conditions. Cellulose Chem. Technol. 42(7-8), 317-<br />
333<br />
Vaca-Garcia C., Thiebaud S. and Borredon M. (1998): Cellulose esterification with fatty acids and acetic<br />
anhydride in lithium chloride / N,N -dimethylacetamide medium. J. American Oil Chemists Society. 75,<br />
315-319<br />
Viikari L. and Lantto R. (2002): BIOTECHNOLOGY IN THE PULP AND PAPER INDUSTRY: 8 th<br />
ICBPPI MEETING. Progress in Biotechnology 21. Elsevier Science B.V., Amsterdam, pp. 332<br />
Yang H., Yan R., Chen H., Zheng C., Lee D. H. and Liang D. T. (2006): In-depth investigation <strong>of</strong><br />
biomass pyrolysis based on three major components: hemicellulose, cellulose and lignin. Energy & Fuels<br />
20, 388-393<br />
265
COST Action E54 Book<br />
266
COST Action E54 Book<br />
SWELLING AND ELECTROKINETIC PROPERTIES OF<br />
UNBLEACHED/BLEACHED SOFTWOOD KRAFT CELLULOSE FIBERS<br />
Abstract<br />
Georgeta Cazacu, Anamaria Sdrobis, Manuela Pintilie, Dan Rosu,<br />
Diana Ciolacu, Marian Totolin and Cornelia Vasile<br />
“Petru Poni” Institute <strong>of</strong> Macromolecular Chemistry, Iasi, Romania<br />
E-mail: gcazacu@icmpp.ro<br />
This work presents some results regarding the behavior <strong>of</strong> cellulose fibers in alkaline solutions.<br />
The influence <strong>of</strong> UV radiation treatments on swelling and electrokinetic properties <strong>of</strong> the<br />
cellulose fibers was also investigated. The assessment <strong>of</strong> changes in the molecular structures was<br />
based by FT-IR spectroscopy, differential scanning calorimetry (DSC), optical microscopy and<br />
scanning electronic microscopy (SEM). The electrokinetic properties were analyzed by zeta<br />
potential measurements. Based on the obtained results, it can be concluded that the treatments<br />
cause certain changes <strong>of</strong> the fiber properties which are reported.<br />
Introduction<br />
In many applications cellulosic materials require certain pretreatments, which can be based on<br />
physical or chemical methods <strong>of</strong> swelling and activation. The alkaline treatments have been used<br />
for many years to modify fiber structure and properties such as swelling degree, crystallinity and<br />
orientation <strong>of</strong> fibrils in cellulosic fibers (Vicker et al. 2001), all having an effect on physicomechanical<br />
properties <strong>of</strong> the substrates. The interactions taking place between cellulosic fibers<br />
and alkaline solutions determine an increase <strong>of</strong> fiber diameter (swelling) and a decrease <strong>of</strong> their<br />
length (contraction) (Rozmarin (1984; Good and Mueller 1980). The reorganization <strong>of</strong> cellulose<br />
fibers by swelling treatments in alkaline solutions results in numerous structural modifications,<br />
causing changes <strong>of</strong> their accessibility and/or reactivity (Bui et al. 2008). These treatments have a<br />
great influence also on the electrokinetic properties <strong>of</strong> cellulosic materials (Freundenberg et al.<br />
2007). The new properties are important for using cellulose products in biomedical applications<br />
(dialysis membranes, wound dressings and skin substitutes and for drug delivery systems), for<br />
adsorption <strong>of</strong> heavy metals (dietary fibers, production <strong>of</strong> the nanomaterials and colored textile<br />
fibers (Freundenberg et al. 2007; Öztürk et al. 2009), and in different chemical reactions <strong>of</strong><br />
cellulose such as acetylation (Safy El-Din and Abd El-Megeid 1994).<br />
In the present work, the effect <strong>of</strong> alkaline treatments on kraft pulp fiber characteristics,<br />
especially <strong>of</strong> the swelling degree was investigated. The unbleached/bleached pulps were<br />
subjected to the action <strong>of</strong> various aqueous alkaline solutions at different temperatures and with<br />
or without UV irradiation.<br />
Materials and Methods<br />
Pulps<br />
Two types <strong>of</strong> chemical pulp fibers have been used: the unbleached (UBP) and bleached kraft<br />
pulps (BP) fibers from s<strong>of</strong>t wood (spruce:pine wood ratio=79:21) (supplied by Södra Cell,<br />
Sweden). The chemical composition is presented in Table 1, while sugar and lignin content is<br />
given by Heinemann and Ander (2011).<br />
267
COST Action E54 Book<br />
Table 1. Lignin and �- and �+� cellulose content <strong>of</strong> pulp samples<br />
Sample<br />
Unbleached<br />
pulp - UBP<br />
Bleached<br />
pulp - BP<br />
Relative<br />
humidity<br />
(%)<br />
Dry<br />
matter<br />
content<br />
(%)<br />
Intrinsic<br />
viscosity<br />
(mL/g)<br />
Klason<br />
lignin<br />
(%)<br />
Kappa<br />
number<br />
�-<br />
cellulose<br />
(%)<br />
�+�<br />
cellulose<br />
(%)<br />
65.1 32.3 1109 3.9 25.9 74.42 7.39<br />
65.3 32.8 728 0.75 3.0 86.97 11.17<br />
A. Swelling <strong>of</strong> the pulp samples was done in water and alkaline solutions (NaOH and KOH<br />
solution) <strong>of</strong> different concentrations (5, 10 and 40 weight %), for 72 h at room temperature. The<br />
treated samples were firstly dried at room temperature.<br />
B. Alkaline activation <strong>of</strong> pulp: The pulp samples were frozen in 8.5% NaOH solution at minus<br />
30 o C during 3 to 71 days (UBP1-11 and BP1-12, respectively). The treated pulp was thawed at<br />
room temperature, successively washed with 1% NaOH solution, water, dilute acetic acid, water,<br />
acetone and ether. The samples were weighed after drying at room temperature. The dried pulps<br />
were immersed in water for 24 h to determine swelling degree.<br />
C. UV radiation treatment: The pulp samples were exposed to UV radiation under artificial<br />
conditions with different kinds <strong>of</strong> UV lamps (xenon tube and mercury lamp) as the sources <strong>of</strong><br />
radiation. The samples, in the form <strong>of</strong> tablets, were subjected to irradiation on two-faces, using<br />
two wavelengths (�=254 nm and 365 nm, respectively). Changes in the fiber molecular and<br />
surface properties were observed after 20 h and 40 h <strong>of</strong> exposure <strong>of</strong> each face. The pulp samples<br />
were UV irradiated in order to see color development versus irradiation time. To determine the<br />
influence <strong>of</strong> UV treatment on the fiber swelling degree, the samples were immersed in 10%<br />
NaOH or KOH solutions at room temperature for 72 h.<br />
Methods <strong>of</strong> investigation<br />
The structural modifications which appeared during treatments were investigated by: ATR FT-<br />
IR spectroscopy (FT-IR Bruker Vertex 70 spectrometer), microscopy (optical microscopy –<br />
microscope type LEICA DM 2500M; SEM - scanning electron microscope type VEGA II<br />
TESCAN), differential scanning calorimetry (Mettler DSC-12E instrument), ζ potential<br />
measurements (SurPASS Electrokinetic Analyzer).<br />
From FT-IR spectra, the following information were obtained: H-bonds energy (Struszczyk<br />
1986); H-bond formation enthalpy (Kadla and Satoshi 2004; Purcell and Drago 1967); Hbounding<br />
distance (Pimentel and Sederholm 1956); relative value <strong>of</strong> optical density (RVDO)<br />
(Simionescu et al. 1973); asymmetric index (a/b) (Kotelnikova 1992). The information on the<br />
crystalline index (χIR) <strong>of</strong> the cellulosic materials was obtained from the absorbance ratio X IR =<br />
A1370 / A2900.<br />
The diameter (D) <strong>of</strong> swollen fibers was determined by a Leica projection microscope with a<br />
magnification <strong>of</strong> 200x using the relation: D = [� df] / n, were df – swollen fiber diameter (mm)<br />
and n – number <strong>of</strong> fibers measured. Results are expressed as the mean <strong>of</strong> at least ten measured<br />
fibers. The degree <strong>of</strong> swelling is generally defined as the amount <strong>of</strong> water or other solvents taken<br />
up under specified chemical conditions. Therefore, swelling degree (Q) <strong>of</strong> the treated samples<br />
was determined by weighing and calculated using the relation: Qmax = [(m – m0)/ m0]*100 (%),<br />
where: m0 - dry hydrogels mass (g); m - swollen hydrogel mass (g).<br />
268
COST Action E54 Book<br />
The color changes during the photochemical treatment <strong>of</strong> the specimens can be described using<br />
CIEL * a * b * system, where L * can be thought as a lightness factor, a * is the redness factor and b * is<br />
the yellowing index (McLaren 1976). The L * , a * and b * parameters were measured with a color<br />
comparison device (Pocket Spec Color QA, SUA). These values were used to calculate the color<br />
change �Eab as a function <strong>of</strong> the UV irradiation time, according to the following equation:<br />
Results and Discussion<br />
E ab<br />
Swelling <strong>of</strong> the pulp samples UBP and BP<br />
�<br />
�<br />
� � � � � � 2<br />
* * 2 * * 2 * *<br />
L � L � a � a � b � b<br />
2<br />
1<br />
The interactions between cellulose fibers and alkaline solutions give an increase <strong>of</strong> fiber<br />
diameter due to fibre swelling. These changes were characterized by optical microscopy, FT-IR<br />
spectroscopy and swelling degree (Sdrobis et al. 2010). Optical micrographs showed the<br />
increase <strong>of</strong> the pulp volume (especially fiber diameter) by immersion <strong>of</strong> the pulp samples in<br />
alkaline solutions for a determined time period (Figure 1). A first observation showed that a<br />
larger increase in diameter was observed for UBP samples in all solvents in comparison with BP<br />
samples. This can be explained by the presence <strong>of</strong> more amorphous domains due to lignin and<br />
hemicellulose present in UBP, which were removed by the bleaching process. Increase in<br />
diameter <strong>of</strong> the swollen fibers, as seen in optical microscopy images, is given in Table 2.<br />
Unbleached pulp<br />
2<br />
Bleached pulp<br />
Blank samples 10% KOH 10% NaOH<br />
Figure 1. Optical microscopy images <strong>of</strong> swollen samples (200 x)<br />
269<br />
1<br />
2<br />
1
COST Action E54 Book<br />
Table 2. Percent change <strong>of</strong> kraft pulp fiber diameter in alkaline solutions<br />
Sample KOH solution NaOH solution<br />
5% 10% 40% 5% 10% 40%<br />
Dry fibers<br />
UBP 8.82 35.29 19.35 35.29 26.47 35.29<br />
BP 10.71 42.85 32.14 53.57 50.00 64.28<br />
Conditioned fibers<br />
UBP 100 80.64 61.29 70.96 51.61 80.64<br />
BP 100 78.57 53.57 53.57 42.85 57.14<br />
Both dried and conditioned fibers swelled in KOH solution and showed the highest increase in<br />
diameter for the 10% solution, while NaOH gave maximum swelling <strong>of</strong> the fibers in 5% and<br />
40% solutions. As expected, the increase in fiber diameter was a consequence <strong>of</strong> the swelling<br />
process which is seen by the swelling degree presented in Table 3.<br />
Table 3. Maximum swelling degree in alkaline solutions <strong>of</strong> the kraft pulp fibers<br />
Sample KOH NaOH<br />
5% 10% 40% 5% 10% 40%<br />
UBP 140.2 146.0 157.1 135.3 140.4 169.2<br />
BP 135.1 139.2 156.0 103.5 132.2 161.8<br />
The swelling degree in NaOH and KOH solutions was higher for UBP than for BP (Table 3) in<br />
accordance with data obtained by optical microscopy. For samples swollen in 5% and 10%<br />
solutions the highest swelling degree was observed for KOH solutions.<br />
The hydration energies are ΔHNa+ = -98 kcal/mol and ΔHK+ = -77 kcal/mol. As known the<br />
hydration energies <strong>of</strong> ions decrease when increasing ion volume that is why a larger swelling<br />
degree was observed for the samples swollen in solutions <strong>of</strong> 40 mass-% NaOH. Generally, the<br />
swelling degree <strong>of</strong> the fibers increased with increased concentration <strong>of</strong> alkaline solutions.<br />
Due to the heterogeneous cellulose structure containing both crystalline and amorphous domains<br />
and semi-crystalline un-ordered areas, swelling can also be inter- and intracrystalline. Below<br />
20% alkaline solutions, swelling occurs predominantly in amorphous and un-ordered regions,<br />
while with higher concentration <strong>of</strong> alkali, the swelling process gives an intramicelar reaction<br />
type with changes <strong>of</strong> the molecular network as seen by X-ray and FT-IR spectroscopy<br />
(Rozmarin 1984).<br />
The FT-IR spectra <strong>of</strong> both unbleached and bleached kraft pulp samples after swelling in alkaline<br />
solutions are presented in Figure 2.<br />
Figure 2. FT-IR spectra for unbleached and bleached samples<br />
270
COST Action E54 Book<br />
A small shift <strong>of</strong> OH FT-IR bands to higher wave-number values was observed during the<br />
cellulose swelling process. The shift increased with increasing solution concentration being more<br />
obvious in the case UBP and BP swollen in 40% KOH and NaOH.<br />
The changes which took place in the cellulose structure during alkaline treatment were deduced<br />
from the spectral data in Table 4. The modifications recorded could be due to breaking <strong>of</strong> some<br />
inter- and intra-molecular bonds. The decrease <strong>of</strong> H-bond energy after swelling in alkaline<br />
solutions shows that the structural order was disturbed, which was also shown by the increase in<br />
hydrogen bonding distances.<br />
Table 4. Spectral characteristics <strong>of</strong> pulps before and after swelling in alkaline solutions<br />
Sample<br />
OH - band<br />
position (cm -1 )<br />
a/b ratio<br />
EH<br />
(kJ)<br />
∆H<br />
(kJ/mol)<br />
R (Å)<br />
Unbleached pulp<br />
UBP 3335 1.023 21.575 46.96 2.780<br />
KOH 10% 3336 0.971 21.507 47.92 2.780<br />
NaOH 10% 3338 1.000 21.370 47.67 2.781<br />
KOH 40% 3339 0.754 21.301 48.93 2.781<br />
NaOH 40% 3341 0.920 21.164 48.43 2.782<br />
Bleached pulp<br />
BP 3335 1.000 21.644 46.91 2.780<br />
KOH 10% 3336 0.958 21.507 47.59 2.780<br />
NaOH 10% 3337 0.969 21.438 47.29 2.781<br />
KOH 40% 3339 0.944 21.301 48.17 2.781<br />
NaOH 40% 3340 0.953 21.233 47.92 2.781<br />
The increased values <strong>of</strong> hydrogen bonding enthalpy can be due to the increase <strong>of</strong> crystallinity<br />
index (Table 5).<br />
Table 5. The AOH/ACH 2 ratio and other relative values <strong>of</strong> optical density <strong>of</strong> pulps before and after swelling<br />
in alkaline solutions<br />
Sample<br />
χIR (%) AOH/ACH2 ratio RVOD<br />
A1370/A2900 A1420/A900 A1315/A1370 A1315/A2900 A1505/A1425<br />
Unbleached pulp<br />
UBP 0.656 1.158 0.780 0.634 0.180<br />
KOH 10% 0.760 1.320 0.960 0.696 0.093<br />
NaOH 10% 0.739 1.168 0.813 0.648 0.088<br />
KOH 40% 0.892 1.751 1.147 0.880 0.129<br />
NaOH 40% 0.796 1.500 1.122 0.869 0.097<br />
Bleached pulp<br />
BP 0.682 0.912 0.810 0.586 0.210<br />
KOH 10% 0.800 1.291 1.052 0.740 0.088<br />
NaOH 10% 0.723 0.965 0.863 0.690 0.075<br />
KOH 40% 0.935 1.633 1.222 0.877 0.161<br />
NaOH 40% 0.853 1.416 1.194 0.758 0.098<br />
The alkaline solutions have two effects on the pulp fibers: one is swelling <strong>of</strong> the pulp fibers,<br />
especially in volume, and the second is lignin removal (amorphous compound). The increase in<br />
crystallinity index (χIR≈ A1370/A2900 or A1420/A900) and <strong>of</strong> the AOH/ACH2 ratio indicates that the<br />
271
COST Action E54 Book<br />
treated samples have an ordered structure due to swelling <strong>of</strong> the cellulose fibers. The low relative<br />
values <strong>of</strong> optical density indicate that some lignin fragments were removed from the fiber<br />
samples during alkaline treatment.<br />
B. Alkaline activation <strong>of</strong> pulps<br />
Both cellulosic samples (UBP and BP pulps), treated with 8.5% NaOH at -30 ○ C, behaved similar<br />
during dissolution (Cazacu et al. 2008). In the first stage, the solubility <strong>of</strong> the samples in NaOH<br />
solution increased achieving a plateau, and then decreased at prolongation <strong>of</strong> the freezing time<br />
(Figure 3). This can be explained by crystallization <strong>of</strong> water in the samples causing disruption <strong>of</strong><br />
intermolecular bonds, which made it possible to gradually dissolve the cellulose in the alkaline<br />
solution.<br />
The removal <strong>of</strong> short chains and amorphous fragments, lead to an increase <strong>of</strong> domains with a<br />
high order and large dimensions <strong>of</strong> cellulose chains (Isogai and Atalla 1998; Kamide et al. 1984;<br />
1992), which determines the decrease <strong>of</strong> solubility.<br />
Figure 3. Variation solubility <strong>of</strong><br />
pulp samples UBP and BP vs.<br />
freezing time<br />
FT-IR spectroscopy shows that during alkaline treatments at low temperature structural<br />
modifications occur due to breakage <strong>of</strong> inter- and intra-molecular bonds and to removal <strong>of</strong> small<br />
chains from amorphous domains <strong>of</strong> the fibers (Cazacu et al. 2008). Thus, after 200 h, a decrease<br />
<strong>of</strong> the EH was recorded, and simultaneously H-bond energy started to increase, giving breakage<br />
<strong>of</strong> H-bonds in the first stage and then the formation <strong>of</strong> new H-bonds (Figure 4). A similar<br />
behavior <strong>of</strong> H-bond formation enthalpy was observed (Figure 5).<br />
Figure 4. Variation <strong>of</strong> H-bond energy vs.<br />
freezing time<br />
Figure 5. Variation <strong>of</strong> H-bond<br />
formation enthalpy vs. freezing time<br />
The high values <strong>of</strong> the hydrogen bond formation enthalpy (UBP=11.15-11.44 kcal/mol and<br />
BP=11.07-11.58 kcal/mol) and <strong>of</strong> the H-bond energy values (UBP=5.055-5.21 kcal and<br />
BP=5.08-5.23 kcal) indicate formation <strong>of</strong> a product with high structural order. This is confirmed<br />
by the increase <strong>of</strong> the crystallinity index values (calculated from A1370/A2900 ratio) (Figure 6).<br />
272
COST Action E54 Book<br />
The decrease <strong>of</strong> the AOH/ACH ratio indicates that during alkaline treatment removal <strong>of</strong> short<br />
fragments <strong>of</strong> cellulose and lignin occur (Figure 7). The removal <strong>of</strong> small fragments <strong>of</strong> lignin<br />
from UBP samples was also confirmed by the low relative values <strong>of</strong> optical density<br />
(RVOD=0.13-0.16 in comparison with 0.45 for control UBP sample). The spectral data<br />
demonstrate that during alkaline treatment at low temperature structural modifications occur,<br />
with new arrangement <strong>of</strong> molecular chains and establishment <strong>of</strong> new intra- and intermolecular<br />
bonds.<br />
Figure 6. Variation <strong>of</strong> the �IR vs<br />
crystallinity index vs. freezing time<br />
Figure 7. Variation <strong>of</strong> the AOH/ACH2 ratio<br />
vs. freezing time<br />
The cellulose fibers were analyzed by scanning electronic microscopy and it was observed that<br />
control fibers (UBP and BP pulps) had an oblate aspect, and in the case <strong>of</strong> the bleached control<br />
fibers, removal <strong>of</strong> primary wall layers took place by the bleaching (Figure 8a and b).<br />
Unbleached pulp Bleached pulp<br />
UBP – 5<br />
UBP-11<br />
BP - 5<br />
BP - 11<br />
Figure 8a (left) and b (right). SEM images for the pulps treated in alkaline<br />
solution at low temperature<br />
After alkaline treatment the fibers were swollen, and the fiber surfaces became smooth and<br />
ordered fibrils were observed. The effect <strong>of</strong> alkaline treatment at low temperature on the<br />
cellulosic fibers observed by FT-IR spectroscopy and SEM were confirmed also by differential<br />
scanning calorimetry (DSC) data.<br />
273
COST Action E54 Book<br />
In the DSC diagrams (Figure 9), the changes <strong>of</strong> the endothermic peak area at 90-100 ○ C was<br />
observed which is attributed to heat <strong>of</strong> dehydration <strong>of</strong> bound water. This demonstrates the<br />
swelling <strong>of</strong> fibers during treatment with NaOH at low temperature. Simultaneously, an increase<br />
<strong>of</strong> the decomposition peak was observed probably due to change <strong>of</strong> cellulose crystallinity, the<br />
melting process being overlapped with decomposition. Thermal disruption <strong>of</strong> cellulose<br />
crystalline domains is therefore believed to be the reason for appearance <strong>of</strong> a high endothermic<br />
peak (Pedersoli 2000).<br />
Figure 9. DSC curves <strong>of</strong> alkaline treated pulp fibers<br />
Generally, the swelling degree in water <strong>of</strong> the dried treated fibers increased with freezing time.<br />
From Figure 10 it can be seen that in the first period (until 200h), an increase <strong>of</strong> swelling degree<br />
was recorded followed by a slow decrease. This decrease can be explained by the appearance <strong>of</strong><br />
new arrangements <strong>of</strong> the molecular structure and by establishing <strong>of</strong> new H-bonds.<br />
Figure 10. Swelling<br />
behavior in water <strong>of</strong><br />
the treated pulps<br />
The unbleached pulp gave the highest swelling degree, probably due to the presence <strong>of</strong> many<br />
amorphous domains. The alkaline treatment <strong>of</strong> the bleached pulp destroyed a portion <strong>of</strong> intra-<br />
and inter-molecular bonds leading to dissolution <strong>of</strong> short chains especially from amorphous<br />
domains.<br />
C. UV irradiation treatment<br />
The UV-treated pulp samples were investigated by FT-IR spectroscopy, zeta potential<br />
measurements and swelling degree determination in various alkaline solutions (Cazacu et al.<br />
(2009). The IR spectra with or without UV irradiation were very similar and only a small change<br />
274
COST Action E54 Book<br />
<strong>of</strong> bands in the range 1800-1500 cm -1 was seen in Figure 11. The ratio values <strong>of</strong> A1730/A1050 and<br />
A1634/A1050 indicate structural modifications during UV irradiation <strong>of</strong> the pulp fibers (Table 6 in<br />
Appendix). In the range <strong>of</strong> non-conjugated carbonyl groups a broad absorption appeared around<br />
1740 cm −1 , as a result <strong>of</strong> irradiating the samples (cf. Alvarez et al. 2006). A decrease in<br />
absorbance around 1630 cm −1 (conjugated carbonyl groups and adsorbed water in cellulose<br />
fibers) was recorded in the spectra for low irradiation wavelength and can be attributed to the<br />
loss <strong>of</strong> water. At higher energies the absorbance increases due to the increase <strong>of</strong> conjugated<br />
carbonyl groups number.<br />
The results indicate that there are several processes in the OH-band region during irradiation in<br />
the 3400 - 3500 cm -1 range (Appendix Table 6). Thus, the decrease in absorbance band intensity<br />
corresponding to -OH indicates the possible transformation <strong>of</strong> these groups to aldehyde or<br />
carboxylic groups and the formation <strong>of</strong> new intermolecular bonding with the participation <strong>of</strong><br />
these groups.<br />
Figure 11. IR spectra <strong>of</strong> UV irradiated UBP and BP in the 1800-900 cm -1 domain<br />
Important color variations were observed by UV irradiation for up to 120 h (Figure 12). The<br />
overall tendency <strong>of</strong> the color differences (�E*) was an increase with irradiation time, but each<br />
sample had a particular behavior (Figure 12 and Appendix Table 7). For unbleached pulp (UBP)<br />
the color differences were greater, with increase <strong>of</strong> wavelength and exposure time. This can be<br />
attributed to the formation and accumulation <strong>of</strong> chromophore functional groups such as<br />
carboxylic acids, quinone-like structures and hydroperoxy radicals due to depolymerization and<br />
oxidation <strong>of</strong> lignin during irradiation. The bleached cellulose (BP) gave a maximum <strong>of</strong> the �E*.<br />
The use <strong>of</strong> UV radiation at �=365 nm lead to lower values for �E*, than for �=254 nm, probably<br />
due to a more intense photodegradation process <strong>of</strong> the cellulose material.<br />
275
COST Action E54 Book<br />
Figure 12. Color variations vs. irradiation time and UV radiation wavelength for UBP and BP<br />
The ΔE* values (Appendix Table 7) were in a large range (1.5-10 for I & II faces), indicating a<br />
significant variation in visibility <strong>of</strong> the color change. Thus, exposure <strong>of</strong> the BP samples to UV<br />
radiation showed a greater accumulation <strong>of</strong> chromophore groups than the UBP samples.<br />
Variation <strong>of</strong> different color parameters indicates the accumulation <strong>of</strong> chromophores on the two<br />
faces <strong>of</strong> the studied samples, and at exposure <strong>of</strong> BP samples a slight tendency for accumulation<br />
<strong>of</strong> green and yellow chromophores on both surfaces was found. For the UBP samples, UV<br />
irradiation caused accumulation <strong>of</strong> different chromophores with low stability and transforming<br />
to other chromophores after prolonged exposure time (λ=254 nm: red - green chromophores, and<br />
λ=365 nm: yellow - blue chromophores), probably due to a cellulose pulp degradation process<br />
taking place by a complicated mechanism.<br />
The irradiated pulps were swollen in alkaline solutions (NaOH and KOH, 10%) for 72 h. As<br />
given in Appendix Table 8, the swelling degree <strong>of</strong> the irradiated pulp samples were influenced<br />
by type <strong>of</strong> alkaline solution, by UV radiation wavelength and by type <strong>of</strong> irradiated cellulose<br />
pulp. Due to the presence <strong>of</strong> amorphous lignin and hemicellulose, UBP gave a higher swelling<br />
degree than BP. Increase in wavelength and exposure time lead to a decrease <strong>of</strong> swelling degree,<br />
probably due to a crosslinking-coupled degradation process which took place on the cellulose<br />
surface during UV irradiation.<br />
KOH gave a larger swelling degree due to a lower hydration energy compared with NaOH<br />
solution (ΔHNa+ = -98 kcal/mol and ΔHK+ = -77 kcal/mol). Also, the presence <strong>of</strong> carboxyl groups<br />
which can be converted to Na + salts, may lead to a decrease <strong>of</strong> the swelling degree (Scallan<br />
1983; Grignon and Scallan 1980).<br />
By the determination <strong>of</strong> the zeta potential, the structural modification which takes place during<br />
UV irradiation <strong>of</strong> the kraft pulps was confirmed. As shown in Figure 13, the evolution <strong>of</strong> zeta<br />
potential with pH shows a plateau in the pH=5-9 range, where the maximal zeta potential for<br />
irradiated and control cellulose samples differed. The ζ potential in absolute value for BP<br />
increased with UV exposure time and wavelength. For UBP, increase <strong>of</strong> wavelength and<br />
irradiation time decreased the ζ potential in comparison with control pulp fibers. This can be<br />
explained by an intense oxidation process <strong>of</strong> the polymeric support which leads to accumulation<br />
<strong>of</strong> chromophoric structures capable <strong>of</strong> formation <strong>of</strong> intermediary colored products. The behavior<br />
276
COST Action E54 Book<br />
<strong>of</strong> ζ potential at different pHs may also be related to the chemical properties <strong>of</strong> the fibers.<br />
Bleached pulp showed a higher degree <strong>of</strong> crystallinity (XIR=0.757) and a higher content <strong>of</strong> �cellulose<br />
(87 %), while UBP exhibited a lower content <strong>of</strong> crystalline parts (XIR=0.631) and a<br />
high content <strong>of</strong> non-cellulose compounds (LK=17.55 %).<br />
Figure 13. Variation <strong>of</strong> ζ potential vs. pH in solution for UBP and BP<br />
Conclusions<br />
The behavior <strong>of</strong> unbleached and bleached kraft pulp fibers during some alkaline treatments<br />
including direct treatment with KOH and NaOH solutions, treatment with NaOH at low<br />
temperature and treatment with KOH and NaOH after UV irradiation <strong>of</strong> the pulps was studied.<br />
The structural modifications <strong>of</strong> the treated pulp fibers were demonstrated by FT-IR<br />
spectroscopy, while further change in properties were investigated by differential scanning<br />
calorimetry, optical and electronic microscopy, zeta potential measurements, and color<br />
modifications.<br />
The swelling degree depends on type <strong>of</strong> pre-treatment, nature <strong>of</strong> the samples and used alkaline<br />
solution. Thus, UV irradiation <strong>of</strong> the kraft pulps lead to a higher swelling degree in comparison<br />
with only NaOH and KOH treatment. The irradiated samples had a higher susceptibility in KOH<br />
as compared with NaOH. During alkaline treatment <strong>of</strong> cellulosic samples (UBP and BP) at low<br />
temperature, a swelling and dissolution processes took place.<br />
The results give new insights on the stability <strong>of</strong> kraft s<strong>of</strong>twood pulp fibers under UV irradiation<br />
and in aggressive environments which are useful both in pulp and paper production and for<br />
textile industries.<br />
277
References<br />
COST Action E54 Book<br />
Alvarez J., Lipp-Symonowicz B. and Kardas I. (2006): The examination <strong>of</strong> molecular and supermolecular<br />
structure changes <strong>of</strong> man-made cellulose fibres under the influence <strong>of</strong> UV radiation. AUTEX Research J.<br />
6(4), 191-195<br />
Bui H.M., Lenninger M., Manian A.P., Abu-Rous M., Schimper C.B., Schuster K. C. and Bechtold T.<br />
(2008): Treatment in swelling solutions modifying cellulose fiber reactivity. 2: Accessibility and<br />
reactivity. Macromol. Symp. 262, 50–64<br />
Cazacu G., Ciolacu D., Vlad - Bubulac T. and Drobota M. (2008): Swelling kinetics study <strong>of</strong> E54 pulp<br />
samples. COST E54 –5 th Meeting Graz, Austria, April 10-11<br />
Cazacu G., Rosu D., Pintilie M., Totolin M., Ciolacu D. and Vasile C. (2009): Electrokinetic properties<br />
<strong>of</strong> COST E54 samples. COST Action E54, Tampere, Finland, 4-6 May<br />
Freundenberg U., Zimmermann R., Schmidt K., Behrens S.H. (2007): Charging and swelling <strong>of</strong> cellulose<br />
films. J. Coll. Interf. Sci. 309, 360-365<br />
Good W.R. and Mueller K.F. (1980): A new family <strong>of</strong> monolithic hydrogels for controlled release<br />
applications. In: Controled Release <strong>of</strong> Bioactive Materials, Ed. R. Baker, Academic Press, New York, p.<br />
155<br />
Grignon J. and Scallan A.M. (1980): Effect <strong>of</strong> pH and neutral salts upon the swelling <strong>of</strong> cellulose gels. J.<br />
Appl. Polym. Sci. 25, 2829-2843<br />
Heinemann S. and Ander P. (2011): Standard pulp and paper tests. In COST Action E54<br />
“Characterisation <strong>of</strong> the fine structure and properties <strong>of</strong> papermaking fibres using new technologies”.<br />
Eds: Ander P., Bauer W., Heinemann S., Kallio P., Passas R. and Treimanis, A. Swedish University <strong>of</strong><br />
Agricultural Sciences. p. 211-232. ISBN 978-91-576-9007-4<br />
Isogai A. and Atalla R.H. (1998): Dissolution <strong>of</strong> cellulose in aqueous NaOH solutions. Cellulose 5, 309-<br />
319<br />
Kadla J.F. and Satoshi K. (2004): Lignin-based polymer blends: analysis <strong>of</strong> intermolecular interactions in<br />
lignin–synthetic polymer blends. Composites Part A, 35, 395-400<br />
Kamide K., Okajima K., Kowsaka K. (1992): Dissolution <strong>of</strong> natural cellulose into aqueous alkali<br />
solution: Role <strong>of</strong> super-molecular structure <strong>of</strong> cellulose. Polym. J. 24(1), 71-86<br />
Kamide K., Okajima K., Matsui T. and Kowsaka K. (1984): Study on the solubility <strong>of</strong> cellulose in<br />
aqueous alkali solution by deuteration IR and 13C NMR. Polym. J. 16(12), 857-866<br />
Kotelnikova N.I. (1992): In: Lignocellulosics, Science, Technology, Development and Use. Ed. J.F.<br />
Kennedy, G.O. and Phillips, P.A. Williams, Ellis Horwood Limited, p. 597<br />
McLaren K. (1976): The development <strong>of</strong> the CLE 1976 (L*a*b*) uniform color space and color different<br />
formula. J. Soc. Dyers Colors 92, 338-341<br />
Öztürk H.B., Vu-Manh H. and Bechtold T. (2009): Interaction <strong>of</strong> cellulose with alkali metal ions and<br />
complexed heavy metals. Lenzinger Berichte 87, 142-150<br />
Pedersoli J.L. (2000): Effect <strong>of</strong> cellulose crystallinity on the progress <strong>of</strong> thermal oxidative degradation <strong>of</strong><br />
paper. J. Appl. Polym. Sci. 78, 61-66<br />
Pimentel G.C., Sederholm C.H., (1956): Correlation <strong>of</strong> infrared stretching frequencies and hydrogen<br />
bond distances in crystals. J. Chem. Phys. 24, 639-641<br />
278
COST Action E54 Book<br />
Purcell K.F. and Drago R.S. (1967): Theoretical aspects <strong>of</strong> linear enthalpy wavenumber shift relation<br />
for hydrogen-bonded phenols. J. Am. Chem. Soc. 89(12), 2874–2881<br />
Rozmarin G. (1984): Macromolecular basis <strong>of</strong> wood chemistry. Technical Ed., Bucuresti, Romania, p.<br />
154<br />
Safy El-Din N.M. and Abd El-Megeid F.F. (1994): The effect <strong>of</strong> cold alkali preatreatment on the<br />
reactivity <strong>of</strong> some cellulosic pulps towards acetylation. Holzforschung, 48, 496-500<br />
Scallan A.M. (1983): The effect <strong>of</strong> acidic groups on the swelling <strong>of</strong> pulps: a review. Tappi J. 66 (11), 73-<br />
75<br />
Sdrobiş A., Cazacu G., Totolin M. and Vasile C. (2010): Alkaline solution swelling <strong>of</strong> grafted unbleached<br />
and bleached cellulose. Iasi Academic Days “Progress in Organic and Polymer Chemistry”. Iasi,<br />
Romania. October 8-10<br />
Simionescu C., Grigoras M., Cernatescu-Asandei A. and Rozmarin G. (1973): Wood chemistry from<br />
Romania: poplar and willow. Academy Ed., Bucuresti, Romania, p. 118-122<br />
Struszczyk H. (1986): Modification <strong>of</strong> lignins. III. Reaction <strong>of</strong> lignosulfonates with chlorophosphazenes.<br />
J. Macromol. Sci. A-23 (8), 973-992<br />
Vicker M. E., Briggs N. P., Ibbet R. N., Payne J. J. and Smith S. B. (2001): Small angle X-ray scattering<br />
on lyocell cellulosic fibers: the effects <strong>of</strong> drying, re-wetting and changing coagulation temperature.<br />
Polymer, 42, 8241-8248<br />
279
Appendix<br />
COST Action E54 Book<br />
Table 6. Spectral characteristics determined for the irradiated pulp samples<br />
Sample �OH<br />
(cm -1 �H EH A1730/ A1634/ A1315/<br />
) (kcal/mole) (kcal) A1050 A1050 A1050 A2900<br />
BP 3335 11.246 5.141 0.035 0.104 0.250 0.757<br />
BP<br />
(�=254 nm, 20h)<br />
3335 11.042 5.141 0.032 0.069 0.237 0.754<br />
BP<br />
(�=254 nm, 40 h)<br />
3331 11.314 5.204 0.022 0.071 0.255 0.753<br />
BP<br />
(�=365 nm, 20 h)<br />
3336 11.450 5.125 0.037 0.210 0.226 0.788<br />
BP<br />
(�=365 nm, 40h)<br />
3335 10.974 5.141 0.024 0.171 0.250 0.747<br />
UBP 3335 11.382 5.141 0.012 0.084 0.240 0.631<br />
UBP<br />
(�=254 nm, 20h)<br />
3336 11.246 5.125 0.050 0.075 0.244 0.784<br />
UBP<br />
(�=254 nm, 40 h)<br />
3332 11.518 5.188 0.047 0.078 0.250 0.789<br />
UBP<br />
(�=365 nm, 20 h)<br />
3336 10.497 5.125 0.035 0.097 0.216 0.884<br />
UBP<br />
(�=365 nm, 40h)<br />
3332 11.654 5.188 0.029 0.103 0.236 0.792<br />
Table 7. Variation <strong>of</strong> the ΔE* and L*, a* and b* parameters during UV treatment<br />
Sample<br />
BP<br />
(�=254 nm, 20h)<br />
BP<br />
(�=254 nm, 40h)<br />
BP<br />
(�=365 nm, 20h)<br />
BP<br />
(�=365 nm, 40h)<br />
UBP<br />
(�=254 nm, 20h)<br />
UBP<br />
(�=254 nm, 40h)<br />
UBP<br />
(�=365 nm, 20h)<br />
UBP<br />
(�=365 nm, 40h)<br />
�IR= A1370/<br />
I Face II Face<br />
ΔE* ΔL* Δa* Δb* ΔE* ΔL* Δa* Δb*<br />
5,998 -2,179 -0,551 5,561 7,703 -1,440 -2,382 7,183<br />
7,903 -5,539 -0,896 5,565 7,975 0,468 2,993 7,377<br />
5,410 0,767 -3,743 3,829 4,635 2,514 -2,334 3,140<br />
5,634 -0,567 -3,196 4,605 10,815 -0,853 -6,535 8,575<br />
6,723 -0,482 5,974 3,046 4,307 -0,703 1,888 3,807<br />
2,289 -0,630 0,935 -1,992 1,507 0,043 1,424 0,493<br />
2,243 -0,908 -1,992 0,489 1,494 -0,029 1,494 0,014<br />
4,967 -4,797 -0,677 -1,098 1,498 -0,897 -0,191 -1,185<br />
280
COST Action E54 Book<br />
Table 8. Influence <strong>of</strong> the UV irradiation on the swelling degree (Qmax)<br />
Sample NaOH, 10% KOH, 10%<br />
BP (�=254 nm, 20h) 125.7 140.0<br />
BP (�=254 nm, 40h) 128.9 147.3<br />
BP (�=365 nm, 20h) 171.5 186.6<br />
BP (�=365 nm, 40h) 133.4 159.6<br />
UBP (�=254 nm, 20h) 137.3 151.6<br />
UBP (�=254 nm, 40h) 131.4 142.9<br />
UBP (�=365 nm, 20h) 183.5 196.1<br />
UBP (�=365 nm, 40h) 141.2 156.5<br />
As shown in Figure 14, the zeta potential tended to have much more electronegative values with<br />
increase <strong>of</strong> conductivity.<br />
Figure 14. Variation <strong>of</strong> ζ potential vs conductivity solution<br />
Based on these data, zeta potential decreased at both acidic and basic pH values. This suggests<br />
that the ζ potential may be pH-independent at variable conductivity. The effect <strong>of</strong> conductivity<br />
on ζ potential depends on the nature <strong>of</strong> the pulp and treatment conditions.<br />
281
<strong>Fine</strong> <strong>Structure</strong> <strong>of</strong> <strong>Papermaking</strong> <strong>Fibres</strong><br />
COST Action E54 “Characterisation <strong>of</strong> the fine structure and properties <strong>of</strong> papermaking<br />
fibres using new technologies”<br />
The main objective <strong>of</strong> COST Action E54 was to generate new knowledge on the micro- and<br />
nanostructure <strong>of</strong> papermaking fibres and relevant properties required for the efficient and<br />
sustainable use <strong>of</strong> fibres in traditional, advanced and future products. Action E54 comprised<br />
three working groups:<br />
WG1: <strong>Structure</strong> and chemical composition <strong>of</strong> papermaking fibres after different types <strong>of</strong><br />
treatment. The objectives j <strong>of</strong> this WG were to develop p methods for the characterisation <strong>of</strong> ppulp p<br />
fibres, and to generate new data on the fine structure <strong>of</strong> fibres for papermaking, and other<br />
important purposes.<br />
WG2: Treatment and characterisation <strong>of</strong> individual fibres by microsystem technologies.<br />
This WG focused on the development <strong>of</strong> new instruments, namely, microrobotic platforms, by<br />
which individual fibres can be treated and investigated. Using these platforms new possibilities<br />
for testing <strong>of</strong> single fibres have been created.<br />
WG3: The impact <strong>of</strong> the fine structure <strong>of</strong> fibres on their papermaking properties and their<br />
chemical and enzymatic reactivity. The participants <strong>of</strong> the WG exchanged their experience<br />
with respect to the impact <strong>of</strong> the fine structure <strong>of</strong> fibres and their modification on the quality <strong>of</strong><br />
paper and handsheets. The fibre and paper properties were assessed mainly by strength and<br />
optical indices as well as interfibre bonding.<br />
Chapters in this Book are:<br />
Advanced analyses <strong>of</strong> wood pulp fibres<br />
New and emerging methods such as microrobotics and microscopic techniques<br />
Results <strong>of</strong> standard pulp and paper tests on Common pulps I and II and other fibre<br />
material<br />
The 23 articles in the book written by renown scientists are <strong>of</strong> interest for chemists, physicists,<br />
biologists and technologists working with papermaking fibres. It is also hoped that the book will<br />
be useful for undergraduate and graduate students.<br />
Formal publisher: ©COST Office 2011<br />
Book Title: <strong>Fine</strong> <strong>Structure</strong> <strong>of</strong> <strong>Papermaking</strong> <strong>Fibres</strong><br />
Printed by: Swedish University <strong>of</strong> Agricultural Sciences 2011; ISBN: 978-91-576-9007-4<br />
978 91 576 9007 4<br />
Available from Dept. <strong>of</strong> Wood Science, Swedish University <strong>of</strong> Agricultural Sciences, PO Box<br />
7008, SE- 75007, Uppsala, Sweden. Tel.: +46 18 67 10 00; Fax: +46 18 67 34 89 and from the<br />
Web: http://www.slu.se/skogensprodukter<br />
Cover photos<br />
Upper left: High resolution image (100 000 x) <strong>of</strong> the complex branching structure that connects the fractal scaffold<br />
with ith the th micro-fibrils i fib il iin th the underlying d l i S1 l layer (T (Turner et t al., l p. 14)<br />
Upper right: Latewood kraft pulp fibre in polarized light after cleavage by HCl (Ander et al., p. 67)<br />
Lower left: Effect <strong>of</strong> beating on fibre cross-sections prepared in hand sheets (Kritzinger et al., p. 185)<br />
Lower right: Fibrilar structure <strong>of</strong> free dried fibre bond from unrefined s<strong>of</strong>twood kraft pulp, 2400 x (courtesy by<br />
Bartenwerfer, AMiR Oldenburg/ Germany, and Heinemann, VTT/Finland)