indian education - National Council Of Educational Research And ...
indian education - National Council Of Educational Research And ... indian education - National Council Of Educational Research And ...
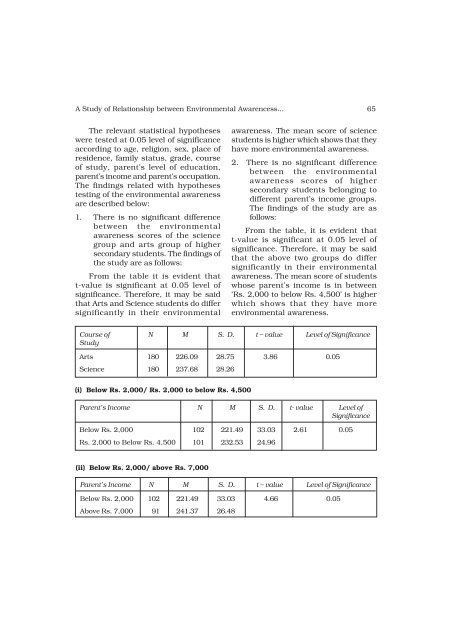
A Study of Relationship between Environmental Awarencess... 65 The relevant statistical hypotheses were tested at 0.05 level of significance according to age, religion, sex, place of residence, family status, grade, course of study, parent’s level of education, parent’s income and parent’s occupation. The findings related with hypotheses testing of the environmental awareness are described below: 1. There is no significant difference between the environmental awareness scores of the science group and arts group of higher secondary students. The findings of the study are as follows: From the table it is evident that t-value is significant at 0.05 level of significance. Therefore, it may be said that Arts and Science students do differ significantly in their environmental awareness. The mean score of science students is higher which shows that they have more environmental awareness. 2. There is no significant difference between the environmental awareness scores of higher secondary students belonging to different parent’s income groups. The findings of the study are as follows: From the table, it is evident that t-value is significant at 0.05 level of significance. Therefore, it may be said that the above two groups do differ significantly in their environmental awareness. The mean score of students whose parent’s income is in between ‘Rs. 2,000 to below Rs. 4,500’ is higher which shows that they have more environmental awareness. Course of N M S. D. t – value Level of Significance Study Arts 180 226.09 28.75 3.86 0.05 Science 180 237.68 28.26 (i) Below Rs. 2,000/ Rs. 2,000 to below Rs. 4,500 Parent’s Income N M S. D. t- value Level of Significance Below Rs. 2,000 102 221.49 33.03 2.61 0.05 Rs. 2,000 to Below Rs. 4,500 101 232.53 24.96 (ii) Below Rs. 2,000/ above Rs. 7,000 Parent’s Income N M S. D. t – value Level of Significance Below Rs. 2,000 102 221.49 33.03 4.66 0.05 Above Rs. 7,000 91 241.37 26.48
66 Journal of Indian Education August 2007 From the table, it is evident that t-value is significant at 0.05 level of significance. Therefore, it may be said that the above two groups do differ significantly in their environmental awareness. The mean score of students whose parent’s income is in between ‘above Rs. 7,000’ is higher which shows that they have more environmental awareness. From the table, it is evident that t-value is significant at 0.05 level of significance. Therefore, it may be said that the above two groups do differ significantly in their environmental (iii) Rs. 2,000 to below Rs. 4,500/ above Rs. 7,000 awareness. The mean score of students whose parent’s income is in between ‘above Rs. 7,000’ is higher which shows that they have more environmental awareness. 3. There is no significant difference between the environmental awareness scores of higher secondary students having parents in government service and private service. The findings of the study are as follows: From the table, it is evident that t-value is significant at 0.05 level of significance. Therefore, it may be said that the above two groups do differ significantly in their environmental awareness. The mean score of students having parents in government service is higher which shows that they have more environmental awareness. Therefore, the null hypothesis that course of study, parent’s income, parent’s occupation have no effect on environmental awareness of higher secondary students, are rejected at 0.05 level of significance. Parent’s income N M S. D. t- value Level of Significance Rs. 2,000 to Below Rs. 4,500 101 232.53 24.96 2.58 0.05 Above Rs. 7,000 91 241.37 26.48 Objective II To study the relationship between the environmental awareness and scientific attitudes among higher secondary students. H : Environmental awareness has R3 relationship with scientific attitudes among higher secondary students. Environmental awareness and different dimensions or areas of scientific attitude were positively correlated and Parent’s Occupation N M S. D. t- value Level of Significance Government Service 190 238.33 25.89 4.57 0.05 Private Service 170 224.69 30.74
- Page 7 and 8: 14 Journal of Indian Education Augu
- Page 9 and 10: 16 Journal of Indian Education Augu
- Page 11 and 12: 18 Journal of Indian Education Augu
- Page 13 and 14: 20 Journal of Indian Education Augu
- Page 15 and 16: 22 Journal of Indian Education Augu
- Page 17 and 18: 24 Journal of Indian Education Augu
- Page 19 and 20: 26 Journal of Indian Education Augu
- Page 21 and 22: 28 Journal of Indian Education Augu
- Page 23 and 24: 30 Journal of Indian Education Augu
- Page 25 and 26: 32 Journal of Indian Education Augu
- Page 27 and 28: 34 Journal of Indian Education Augu
- Page 29 and 30: 36 Journal of Indian Education Augu
- Page 31 and 32: 38 Journal of Indian Education Augu
- Page 33 and 34: 40 Journal of Indian Education Augu
- Page 35 and 36: 42 Journal of Indian Education Augu
- Page 37 and 38: 44 Journal of Indian Education Augu
- Page 39 and 40: 46 Journal of Indian Education Augu
- Page 41 and 42: 48 Journal of Indian Education Augu
- Page 43 and 44: 50 Journal of Indian Education Augu
- Page 45 and 46: 52 Journal of Indian Education Augu
- Page 47 and 48: 54 Journal of Indian Education Augu
- Page 49 and 50: 56 Journal of Indian Education Augu
- Page 51 and 52: 58 Journal of Indian Education Augu
- Page 53 and 54: 60 Journal of Indian Education Augu
- Page 55 and 56: 62 Journal of Indian Education Augu
- Page 57: 64 Journal of Indian Education Augu
- Page 61 and 62: 68 Journal of Indian Education Augu
- Page 63 and 64: 70 Journal of Indian Education Augu
- Page 65 and 66: 72 Journal of Indian Education Augu
- Page 67 and 68: 74 Journal of Indian Education Augu
- Page 69 and 70: 76 Journal of Indian Education Augu
- Page 71 and 72: 78 Journal of Indian Education Augu
- Page 73 and 74: 80 Journal of Indian Education Augu
- Page 75 and 76: 82 Journal of Indian Education Augu
- Page 77 and 78: 84 Journal of Indian Education Augu
- Page 79 and 80: A Study of the Present Scenario of
- Page 81 and 82: A Study of the Present Scenario of
- Page 83 and 84: A Study of the Present Scenario of
- Page 85 and 86: 98 Journal of Indian Education Augu
- Page 87 and 88: 100 Journal of Indian Education Aug
- Page 89 and 90: 102 Journal of Indian Education Aug
- Page 91 and 92: 104 Journal of Indian Education Aug
- Page 93 and 94: 106 Journal of Indian Education Aug
- Page 95 and 96: 108 Journal of Indian Education Aug
- Page 97 and 98: 110 Journal of Indian Education Aug
- Page 99 and 100: 112 Journal of Indian Education Aug
- Page 101 and 102: 114 Journal of Indian Education Aug
A Study of Relationship between Environmental Awarencess... 65<br />
The relevant statistical hypotheses<br />
were tested at 0.05 level of significance<br />
according to age, religion, sex, place of<br />
residence, family status, grade, course<br />
of study, parent’s level of <strong>education</strong>,<br />
parent’s income and parent’s occupation.<br />
The findings related with hypotheses<br />
testing of the environmental awareness<br />
are described below:<br />
1. There is no significant difference<br />
between the environmental<br />
awareness scores of the science<br />
group and arts group of higher<br />
secondary students. The findings of<br />
the study are as follows:<br />
From the table it is evident that<br />
t-value is significant at 0.05 level of<br />
significance. Therefore, it may be said<br />
that Arts and Science students do differ<br />
significantly in their environmental<br />
awareness. The mean score of science<br />
students is higher which shows that they<br />
have more environmental awareness.<br />
2. There is no significant difference<br />
between the environmental<br />
awareness scores of higher<br />
secondary students belonging to<br />
different parent’s income groups.<br />
The findings of the study are as<br />
follows:<br />
From the table, it is evident that<br />
t-value is significant at 0.05 level of<br />
significance. Therefore, it may be said<br />
that the above two groups do differ<br />
significantly in their environmental<br />
awareness. The mean score of students<br />
whose parent’s income is in between<br />
‘Rs. 2,000 to below Rs. 4,500’ is higher<br />
which shows that they have more<br />
environmental awareness.<br />
Course of N M S. D. t – value Level of Significance<br />
Study<br />
Arts 180 226.09 28.75 3.86 0.05<br />
Science 180 237.68 28.26<br />
(i) Below Rs. 2,000/ Rs. 2,000 to below Rs. 4,500<br />
Parent’s Income N M S. D. t- value Level of<br />
Significance<br />
Below Rs. 2,000 102 221.49 33.03 2.61 0.05<br />
Rs. 2,000 to Below Rs. 4,500 101 232.53 24.96<br />
(ii) Below Rs. 2,000/ above Rs. 7,000<br />
Parent’s Income N M S. D. t – value Level of Significance<br />
Below Rs. 2,000 102 221.49 33.03 4.66 0.05<br />
Above Rs. 7,000 91 241.37 26.48


