Promoting Non-motorised Transport in Asian Cities
Shakti Sustainable Energy Foundation conducted a study to assess the viability of promoting non-motorised transport in Asian cities. As part of the study, they undertook a project – Nehru Place Placemaking. See more at: http://shaktifoundation.in/report/promoting-non-motorised-transport-asian-cities-policymakers-toolbox/ Shakti Sustainable Energy Foundation conducted a study to assess the viability of promoting non-motorised transport in Asian cities. As part of the study, they undertook a project – Nehru Place Placemaking. See more at: http://shaktifoundation.in/report/promoting-non-motorised-transport-asian-cities-policymakers-toolbox/
“It is a paradox that walking and cycling provide mobility to a large segment of the society and generally the poor who are the most vulnerable in the transport system rely on use of walking with cycling and bus for daily transport. However the current infrastructure which supports walking and cycling is very poor. Reports suggest that the percentage of roads with pedestrian footpaths runs to hardly 30% in most cities. Loss of accessibility due to poor infrastructure allows victimizing the vulnerable in the transport system. There is an urgent need to change this paradigm. It is clear that non-motorized transport should become the first step in an enlightened urban transport policy. It is important to know what pedestrians/cyclists need from the government and what the infrastructure actually provides so as to understand the implications and plan for the future.” - Prof Madhav Badami 1.3 NMT Accidents and Fatalities A recent publication from WHO suggests that 27% of all traffic fatalities globally are pedestrians and cyclists. Almost half of the world’s road traffic fatalities of approximately 1.3 million people are pedestrians, cyclists and motorcyclists, and more than 90% occur in developing countries (WHO, 2009). The WHO study which analyzed policies around the world related to road safety suggested that: “Our roads are particularly unsafe for pedestrians, cyclists and motorcyclists who, without the protective shell of a car around them, are more vulnerable. These road users need to be given increased attention. While progress has been made towards protecting people in cars, the needs of these vulnerable groups of road users are not being met.” It is interesting to note that pedestrians and cyclists constitute a higher share of total fatalities in cities where facilities do not match the needs of users nor meet the demand. For example, although the national pedestrian fatality share in India is 13% of road accidents, metropolitan cities like New Delhi, Bangalore and Kolkata have pedestrian fatality shares greater than 40%. Similarly, in Kathmandu, pedestrians represent 40% of all road accident fatalities in the city in 2001 (KVMP, 2001). In Ulaanbaatar, Mongolia, 80% of the reported traffic fatalities are pedestrians (Government of Mongolia, 2007). 9 The problem is even more severe when the impact on most vulnerable groups in society, such as children and the elderly, is assessed. For example, in Bangalore, elderly people and school children comprise 23% of the fatalities and 25% of the injuries. It is also worth noting that injuries for traffic accidents are typically underreported. The actual values are likely to be higher than the reported ones. Missing links in infrastructure aiding pedestrian injury and death in Bangalore Source: Clean Air Asia 9. From 2000 to 2007 6
Figure 7: NMT Fatality Share of Road Accident Fatalities in Selected Asian Countries Sources: World Health Organization. Global Status Report on Road Safety Figure 8: How Lack of NMT Facilities Induce Increased Exposure of NMT Facilities and Vice-versa Source: Clean Air Asia 1.4 Air Pollution Exposure The 2010 Global Burden of Disease (IHME, 2013) states that most countries experienced an increase in disease burden due to non-communicable diseases from 1990 to 2010. Exposure to air pollution such as particulate matter, contribute to those non-communicable diseases as well. Outdoor air pollution is one of the leading causes of deaths globally and ranks fourth in China with 1.2 million estimated premature deaths and 25 million healthy years of life lost, which is a 33% increase in the burden of disease attributable to ambient air pollution in China over the past twenty years. 10 Road injuries are also one of the dominant and rising causes of premature death and disability in countries such as India. exposed to high levels of traffic-related air pollution (HEI, 2010). Considering the high density in many Asian cities, the percentage of people walking, living or working within high exposure zones is likely to be higher. Pedestrians are exposed to very high levels of air pollution when they walk along these busy roads, very close to the emissions from vehicle tailpipes. In a study conducted by the East-West Center (2007) in Hanoi, pedestrians were found to be exposed to 495 µg/m3 of PM10, motorcyclists to 580µg/m3, and car drivers to 408µg/m3 and bus passengers to 262µg/m3; all of which are way above the WHO guidelines for levels of PM10 of 20 µg/m3 (World Health Organization, 2006). The figure below shows how the lack of appropriate nonmotorized facilities can spur a vicious cycle of making people want to shift to motorized modes and increasing the exposure of pedestrians and cyclists to pollution and vehicular accidents. A special report of the Health Effects Institute (HEI, 2010) synthesizes the best available evidence on the assessment of exposure to traffic-related air pollution. It concluded that the high exposure zone to traffic emissions stretches up to 300 to 500 meters from highways or major roads (the range reflects the variable influence of background pollution concentrations, meteorological conditions, and season). The study also estimated that 30% to 45% of people living in large North American cities live within such zones (HEI, 2010). Estimates made for Delhi and Beijing show 55% and 76% of the population within 500 meters of a freeway and 50 meters of a major road likely Pedestrians walk beside the vehicle tailpipe, travel at slow speeds and have high exposure rates to pollution Source: Clean Air Asia 10. http://www.healtheffects.org/International/HEI-China-GBD-PressRelease033113.pdf 7
- Page 1 and 2: Promoting Non-Motorized Transport i
- Page 3 and 4: Disclaimer : The views expressed in
- Page 5 and 6: 1. Motivations for Promoting NMT in
- Page 7 and 8: Figure 3: HCMC Metropolitan Region
- Page 9: A recent study conducted by the Wor
- Page 13 and 14: simple, differently painted, free-t
- Page 15 and 16: e conducted with relevant governmen
- Page 17 and 18: A good example for a comprehensive
- Page 19 and 20: for evaluation of and improvement o
- Page 21 and 22: considered as a sum of many streets
- Page 23 and 24: 7. Based on suggestions from female
- Page 25 and 26: 8. Comparison of Asian cyclability
- Page 27 and 28: 2.7 Guidelines and Policies: Comple
- Page 29 and 30: Footpath width to be increased at b
- Page 31 and 32: 10. To take up other related activi
- Page 33 and 34: No. Objectives Description 1 To res
- Page 35 and 36: of cycling or walking infrastructur
- Page 37 and 38: Annex B: Walkability Survey Guide P
- Page 39 and 40: Parameter 3: Availability of Crossi
- Page 41 and 42: Parameter 5: Motorist Behavior Desc
- Page 43 and 44: Parameter 7: Disability Infrastruct
- Page 45 and 46: Parameter 9: Security from Crime De
- Page 47 and 48: Parameter 2: Availability of Cycle
- Page 49 and 50: Parameter 4: Lighting Description:
- Page 51 and 52: Parameter 6: Crossing points Descri
- Page 53 and 54: Parameter 8: Shaded lanes Descripti
- Page 55 and 56: Parameter 10: Traffic calming measu
- Page 57 and 58: Parameter 12: Signs, markings Descr
- Page 59 and 60: Parameter 14: Presence of service s
“It is a paradox that walk<strong>in</strong>g and cycl<strong>in</strong>g provide mobility to a large segment of the society<br />
and generally the poor who are the most vulnerable <strong>in</strong> the transport system rely on use<br />
of walk<strong>in</strong>g with cycl<strong>in</strong>g and bus for daily transport. However the current <strong>in</strong>frastructure<br />
which supports walk<strong>in</strong>g and cycl<strong>in</strong>g is very poor. Reports suggest that the percentage of<br />
roads with pedestrian footpaths runs to hardly 30% <strong>in</strong> most cities. Loss of accessibility<br />
due to poor <strong>in</strong>frastructure allows victimiz<strong>in</strong>g the vulnerable <strong>in</strong> the transport system. There<br />
is an urgent need to change this paradigm. It is clear that non-motorized transport should<br />
become the first step <strong>in</strong> an enlightened urban transport policy. It is important to know<br />
what pedestrians/cyclists need from the government and what the <strong>in</strong>frastructure actually<br />
provides so as to understand the implications and plan for the future.”<br />
- Prof Madhav Badami<br />
1.3 NMT Accidents and Fatalities<br />
A recent publication from WHO suggests that 27%<br />
of all traffic fatalities globally are pedestrians and<br />
cyclists. Almost half of the world’s road traffic fatalities<br />
of approximately 1.3 million people are pedestrians,<br />
cyclists and motorcyclists, and more than 90% occur <strong>in</strong><br />
develop<strong>in</strong>g countries (WHO, 2009). The WHO study which<br />
analyzed policies around the world related to road safety<br />
suggested that:<br />
“Our roads are particularly unsafe for pedestrians, cyclists<br />
and motorcyclists who, without the protective shell of a<br />
car around them, are more vulnerable. These road users<br />
need to be given <strong>in</strong>creased attention. While progress has<br />
been made towards protect<strong>in</strong>g people <strong>in</strong> cars, the needs<br />
of these vulnerable groups of road users are not be<strong>in</strong>g<br />
met.”<br />
It is <strong>in</strong>terest<strong>in</strong>g to note that pedestrians and cyclists<br />
constitute a higher share of total fatalities <strong>in</strong> cities<br />
where facilities do not match the needs of users nor<br />
meet the demand. For example, although the national<br />
pedestrian fatality share <strong>in</strong> India is 13% of road accidents,<br />
metropolitan cities like New Delhi, Bangalore and<br />
Kolkata have pedestrian fatality shares greater than 40%.<br />
Similarly, <strong>in</strong> Kathmandu, pedestrians represent 40% of all<br />
road accident fatalities <strong>in</strong> the city <strong>in</strong> 2001 (KVMP, 2001).<br />
In Ulaanbaatar, Mongolia, 80% of the reported traffic<br />
fatalities are pedestrians (Government of Mongolia,<br />
2007). 9 The problem is even more severe when the impact<br />
on most vulnerable groups <strong>in</strong> society, such as children<br />
and the elderly, is assessed. For example, <strong>in</strong> Bangalore,<br />
elderly people and school children comprise 23% of the<br />
fatalities and 25% of the <strong>in</strong>juries. It is also worth not<strong>in</strong>g<br />
that <strong>in</strong>juries for traffic accidents are typically underreported.<br />
The actual values are likely to be higher than<br />
the reported ones.<br />
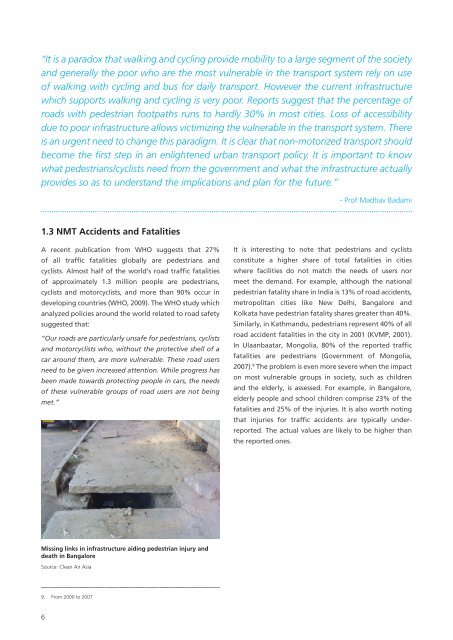
Miss<strong>in</strong>g l<strong>in</strong>ks <strong>in</strong> <strong>in</strong>frastructure aid<strong>in</strong>g pedestrian <strong>in</strong>jury and<br />
death <strong>in</strong> Bangalore<br />
Source: Clean Air Asia<br />
9. From 2000 to 2007<br />
6


