

Population, territory and sustainable development
The purpose of this document is to provide an overview of current trends, contexts and issues in the spheres of population, territory and sustainable development and examine their public policy implications. Three themes run through the report. The first two are laid out in the empirical chapters (III through X); the third is taken up in the closing chapter. Using the most recent data available (including censuses conducted in the 2010s), the first theme describes and tracks location and spatial mobility patterns for the population of Latin America, focusing on certain kinds of territory. The second explores the linkages between these patterns and sustainable development in different kinds of territory in Latin America and the Caribbean. The third offers considerations and policy proposals for fostering a consistent, synergistic relationship between population location and spatial mobility, on the one hand, and sustainable development, on the other, in the kinds of territory studied.
The purpose of this document is to provide an overview of current trends, contexts and issues in the spheres of population, territory and sustainable development and examine their public policy implications. Three themes run through the report. The first two are laid out in the empirical chapters (III through X); the third is taken up in the closing chapter. Using the most recent data available (including censuses conducted in the 2010s), the first theme describes and tracks location and spatial mobility patterns for the population of Latin America, focusing on certain kinds of territory. The second explores the linkages between these patterns and sustainable development in different kinds of territory in Latin America and the Caribbean. The third offers considerations and policy proposals for fostering a consistent, synergistic relationship between population location and spatial mobility, on the one hand, and sustainable development, on the other, in the kinds of territory studied.

Create successful ePaper yourself
Turn your PDF publications into a flip-book with our unique Google optimized e-Paper software.
85<br />
In Mexico, low-population-density areas fall into at least three broad categories: (i) the two states<br />
on the Baja California peninsula (Baja California <strong>and</strong> Baja California Sur); (ii) the mainly desert states on<br />
the northern border with the United States of America (including Sonora <strong>and</strong> Chihuahua); <strong>and</strong> (iii) three<br />
states on the Yucatán peninsula (Quintana Roo, Campeche <strong>and</strong> Yucatán). Since the 1980s, these three<br />
areas have been among the main drivers of Mexico’s regional economic <strong>and</strong> demographic dispersal, a<br />
process which is examined in further detail in chapter VII. The opportunities these places offer are not<br />
agricultural but associated with mining (Campeche), industry (northern border, including Baja<br />
California), <strong>and</strong> services, particularly international tourism <strong>and</strong> the associated production linkages on the<br />
Yucatán <strong>and</strong> Baja California peninsulas. The Government has fostered this process using a series of<br />
measures, including subsidies, benefits, public investment, administrative decentralization <strong>and</strong><br />
regionalized institutions.<br />
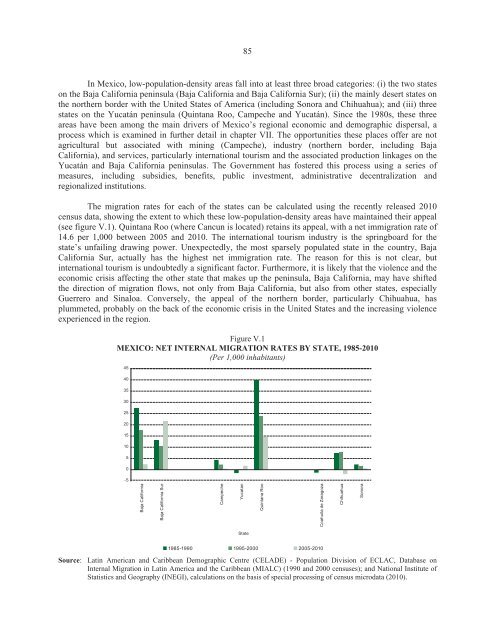
The migration rates for each of the states can be calculated using the recently released 2010<br />
census data, showing the extent to which these low-population-density areas have maintained their appeal<br />
(see figure V.1). Quintana Roo (where Cancun is located) retains its appeal, with a net immigration rate of<br />
14.6 per 1,000 between 2005 <strong>and</strong> 2010. The international tourism industry is the springboard for the<br />
state’s unfailing drawing power. Unexpectedly, the most sparsely populated state in the country, Baja<br />
California Sur, actually has the highest net immigration rate. The reason for this is not clear, but<br />
international tourism is undoubtedly a significant factor. Furthermore, it is likely that the violence <strong>and</strong> the<br />
economic crisis affecting the other state that makes up the peninsula, Baja California, may have shifted<br />
the direction of migration flows, not only from Baja California, but also from other states, especially<br />
Guerrero <strong>and</strong> Sinaloa. Conversely, the appeal of the northern border, particularly Chihuahua, has<br />
plummeted, probably on the back of the economic crisis in the United States <strong>and</strong> the increasing violence<br />
experienced in the region.<br />
Figure V.1<br />
MEXICO: NET INTERNAL MIGRATION RATES BY STATE, 1985-2010<br />
(Per 1,000 inhabitants)<br />
45<br />
40<br />
35<br />
30<br />
25<br />
20<br />
15<br />
10<br />
5<br />
0<br />
-5<br />
Baja California<br />
Baja California Sur<br />
Campeche<br />
Yucatan<br />
Quintana Roo<br />
Coahuila de Zaragoza<br />
Chihuahua<br />
Sonora<br />
State<br />
1985-1990 1995-2000 2005-2010<br />
Source: Latin American <strong>and</strong> Caribbean Demographic Centre (CELADE) - <strong>Population</strong> Division of ECLAC, Database on<br />
Internal Migration in Latin America <strong>and</strong> the Caribbean (MIALC) (1990 <strong>and</strong> 2000 censuses); <strong>and</strong> National Institute of<br />
Statistics <strong>and</strong> Geography (INEGI), calculations on the basis of special processing of census microdata (2010).


