

Population, territory and sustainable development
The purpose of this document is to provide an overview of current trends, contexts and issues in the spheres of population, territory and sustainable development and examine their public policy implications. Three themes run through the report. The first two are laid out in the empirical chapters (III through X); the third is taken up in the closing chapter. Using the most recent data available (including censuses conducted in the 2010s), the first theme describes and tracks location and spatial mobility patterns for the population of Latin America, focusing on certain kinds of territory. The second explores the linkages between these patterns and sustainable development in different kinds of territory in Latin America and the Caribbean. The third offers considerations and policy proposals for fostering a consistent, synergistic relationship between population location and spatial mobility, on the one hand, and sustainable development, on the other, in the kinds of territory studied.
The purpose of this document is to provide an overview of current trends, contexts and issues in the spheres of population, territory and sustainable development and examine their public policy implications. Three themes run through the report. The first two are laid out in the empirical chapters (III through X); the third is taken up in the closing chapter. Using the most recent data available (including censuses conducted in the 2010s), the first theme describes and tracks location and spatial mobility patterns for the population of Latin America, focusing on certain kinds of territory. The second explores the linkages between these patterns and sustainable development in different kinds of territory in Latin America and the Caribbean. The third offers considerations and policy proposals for fostering a consistent, synergistic relationship between population location and spatial mobility, on the one hand, and sustainable development, on the other, in the kinds of territory studied.

Create successful ePaper yourself
Turn your PDF publications into a flip-book with our unique Google optimized e-Paper software.
6<br />
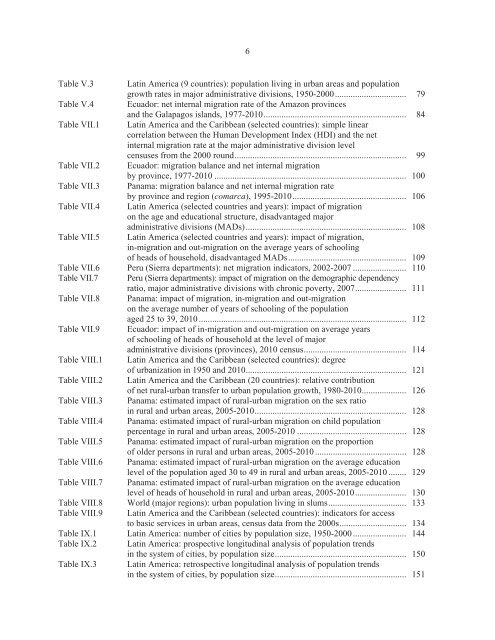
Table V.3 Latin America (9 countries): population living in urban areas <strong>and</strong> population<br />
growth rates in major administrative divisions, 1950-2000 ................................ 79<br />
Table V.4 Ecuador: net internal migration rate of the Amazon provinces<br />
<strong>and</strong> the Galapagos isl<strong>and</strong>s, 1977-2010 ................................................................ 84<br />
Table VII.1 Latin America <strong>and</strong> the Caribbean (selected countries): simple linear<br />
correlation between the Human Development Index (HDI) <strong>and</strong> the net<br />
internal migration rate at the major administrative division level<br />
censuses from the 2000 round ............................................................................. 99<br />
Table VII.2 Ecuador: migration balance <strong>and</strong> net internal migration<br />
by province, 1977-2010 ...................................................................................... 100<br />
Table VII.3 Panama: migration balance <strong>and</strong> net internal migration rate<br />
by province <strong>and</strong> region (comarca), 1995-2010 ................................................... 106<br />
Table VII.4 Latin America (selected countries <strong>and</strong> years): impact of migration<br />
on the age <strong>and</strong> educational structure, disadvantaged major<br />
administrative divisions (MADs)........................................................................ 108<br />
Table VII.5 Latin America (selected countries <strong>and</strong> years): impact of migration,<br />
in-migration <strong>and</strong> out-migration on the average years of schooling<br />
of heads of household, disadvantaged MADs ..................................................... 109<br />
Table VII.6 Peru (Sierra departments): net migration indicators, 2002-2007 ........................ 110<br />
Table VII.7 Peru (Sierra departments): impact of migration on the demographic dependency<br />
ratio, major administrative divisions with chronic poverty, 2007 ....................... 111<br />
Table VII.8 Panama: impact of migration, in-migration <strong>and</strong> out-migration<br />
on the average number of years of schooling of the population<br />
aged 25 to 39, 2010 ............................................................................................. 112<br />
Table VII.9 Ecuador: impact of in-migration <strong>and</strong> out-migration on average years<br />
of schooling of heads of household at the level of major<br />
administrative divisions (provinces), 2010 census .............................................. 114<br />
Table VIII.1 Latin America <strong>and</strong> the Caribbean (selected countries): degree<br />
of urbanization in 1950 <strong>and</strong> 2010 ........................................................................ 121<br />
Table VIII.2 Latin America <strong>and</strong> the Caribbean (20 countries): relative contribution<br />
of net rural-urban transfer to urban population growth, 1980-2010 .................... 126<br />
Table VIII.3 Panama: estimated impact of rural-urban migration on the sex ratio<br />
in rural <strong>and</strong> urban areas, 2005-2010 .................................................................... 128<br />
Table VIII.4 Panama: estimated impact of rural-urban migration on child population<br />
percentage in rural <strong>and</strong> urban areas, 2005-2010 ................................................. 128<br />
Table VIII.5 Panama: estimated impact of rural-urban migration on the proportion<br />
of older persons in rural <strong>and</strong> urban areas, 2005-2010 ......................................... 128<br />
Table VIII.6 Panama: estimated impact of rural-urban migration on the average education<br />
level of the population aged 30 to 49 in rural <strong>and</strong> urban areas, 2005-2010 ........ 129<br />
Table VIII.7 Panama: estimated impact of rural-urban migration on the average education<br />
level of heads of household in rural <strong>and</strong> urban areas, 2005-2010 ....................... 130<br />
Table VIII.8 World (major regions): urban population living in slums ................................... 133<br />
Table VIII.9 Latin America <strong>and</strong> the Caribbean (selected countries): indicators for access<br />
to basic services in urban areas, census data from the 2000s .............................. 134<br />
Table IX.1 Latin America: number of cities by population size, 1950-2000 ........................ 144<br />
Table IX.2 Latin America: prospective longitudinal analysis of population trends<br />
in the system of cities, by population size ........................................................... 150<br />
Table IX.3 Latin America: retrospective longitudinal analysis of population trends<br />
in the system of cities, by population size ........................................................... 151


