2H 2015
intel-xeon-phi-sw-ecosystem-guide-2h-2015-public3 intel-xeon-phi-sw-ecosystem-guide-2h-2015-public3
Comparative Performance AMBER* 14 Particle Mesh Ewald (PME) Cellulose NPT 1 NODE APPROVED FOR PUBLIC PRESENTATION 2 1 0 AMBER* 14 PME Cellulose NPT Speed Up 1 Intel® Xeon® processor E5-2697 v2 1.7X Optimized Intel® Xeon® processor E5-2697 v2 Optimized Intel® Xeon® processor E5-2697 v2 + Intel® Xeon Phi coprocessor 7120A 2X Application: AMBER* 14 Description: Bimolecular Simulations (Protein, DNA, RNA, virus etc.). Full double precision (DPDP). More at http://ambermd.org/ Availability: • Code: As a patch of AMBER 14 when user updates AMBER (http://ambermd.org/bugfixes14.html, http://ambermd.org/bugfixesat.html) Update 5 and update 8. • Recipe: http://ambermd.org/doc12/Amber14.pdf (Section 18.7 of the manual). Usage Model: Baseline is the Intel® Xeon® processor E5-2697 v2 compared to the Intel® Xeon® processor E5-2697 v2 and the Intel® Xeon Phi coprocessor 7120A with offload processing on both, and using the released code (double precision code across the platforms). Highlights: The code was optimized, delivered to the AMBER community (whoever has license) and available as an update patch during code configuration. Results: Optimized Intel Xeon processor E5-2697 v2 and Intel Xeon Phi coprocessor 7120A offload demonstrated up to 2X improved performance over the baseline Intel Xeon processor E5-2697 only code. For configuration details, go here. SOURCE: INTEL MEASURED RESULTS AS OF SEPTEMBER, 2014 Software and workloads used in performance tests may have been optimized for performance only on Intel microprocessors. Performance tests, such as SYSmark and MobileMark, are measured using specific computer systems, components, software, operations and functions. Any change to any of those factors may cause the results to vary. You should consult other information and performance tests to assist you in fully evaluating your contemplated purchases, including the performance of that product when combined with other products. For more information go to http://www.intel.com/performance *Other names and brands may be claimed as the property of others 34
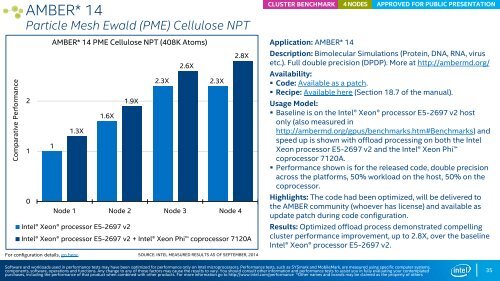
Comparative Performance AMBER* 14 Particle Mesh Ewald (PME) Cellulose NPT CLUSTER BENCHMARK 4 NODES APPROVED FOR PUBLIC PRESENTATION AMBER* 14 PME Cellulose NPT (408K Atoms) 2.8X 2.6X 2.3X 2.3X 2 1.9X 1.6X 1.3X 1 1 0 Node 1 Node 2 Node 3 Node 4 Intel® Xeon® processor E5-2697 v2 Intel® Xeon® processor E5-2697 v2 + Intel® Xeon Phi coprocessor 7120A For configuration details, go here. SOURCE: INTEL MEASURED RESULTS AS OF SEPTEMBER, 2014 Application: AMBER* 14 Description: Bimolecular Simulations (Protein, DNA, RNA, virus etc.). Full double precision (DPDP). More at http://ambermd.org/ Availability: • Code: Available as a patch. • Recipe: Available here (Section 18.7 of the manual). Usage Model: • Baseline is on the Intel® Xeon® processor E5-2697 v2 host only (also measured in http://ambermd.org/gpus/benchmarks.htm#Benchmarks) and speed up is shown with offload processing on both the Intel Xeon processor E5-2697 v2 and the Intel® Xeon Phi coprocessor 7120A. • Performance shown is for the released code, double precision across the platforms, 50% workload on the host, 50% on the coprocessor. Highlights: The code had been optimized, will be delivered to the AMBER community (whoever has license) and available as update patch during code configuration. Results: Optimized offload process demonstrated compelling cluster performance improvement, up to 2.8X, over the baseline Intel® Xeon® processor E5-2697 v2. Software and workloads used in performance tests may have been optimized for performance only on Intel microprocessors. Performance tests, such as SYSmark and MobileMark, are measured using specific computer systems, components, software, operations and functions. Any change to any of those factors may cause the results to vary. You should consult other information and performance tests to assist you in fully evaluating your contemplated purchases, including the performance of that product when combined with other products. For more information go to http://www.intel.com/performance *Other names and brands may be claimed as the property of others 35
- Page 1 and 2: 2H 2015
- Page 3 and 4: Intel® Modern Code Developer Chall
- Page 5 and 6: New or Updated Proof Points NEW pro
- Page 7 and 8: Intel® Xeon Phi Coprocessors Softw
- Page 9 and 10: Intel® Xeon® Processor E5-2697 v2
- Page 11 and 12: Memory Capacity (GB) Memory Compari
- Page 13 and 14: A Growing Ecosystem: The Intel® Xe
- Page 15 and 16: Comparative Performance LAMMPS* Sti
- Page 17 and 18: Comparative Performance Johns Hopki
- Page 19 and 20: Comparative Performance 1 0 BLAST*
- Page 21 and 22: Comparative Performance NAMD* 2.10
- Page 23 and 24: Comparative Performance LAMMPS* Liq
- Page 25 and 26: Comparative Performance LAMMPS* Rho
- Page 27 and 28: Comparative Performance LAMMPS* Liq
- Page 29 and 30: Comparative Performance LAMMPS* Rho
- Page 31 and 32: Comparative Performance LAMMPS* Pro
- Page 33: Comparative Performance AMBER* 14 P
- Page 37 and 38: Comparative Performance Burrows-Whe
- Page 39 and 40: Comparative Performance NWChem* CCS
- Page 41 and 42: Discover and design like never befo
- Page 43 and 44: Comparative Performance miniGhost*
- Page 45 and 46: Comparative Performance Quantum ESP
- Page 47 and 48: Comparative Performance ANSYS Mecha
- Page 49 and 50: Comparative Performance ANSYS Mecha
- Page 51 and 52: Comparative Performance ANSYS Mecha
- Page 53 and 54: Comparative Performance Sandia Mant
- Page 55 and 56: Comparative Increase Autodesk Maya*
- Page 57 and 58: Comparative Performance OpenLB* Cyl
- Page 59 and 60: CLUSTER BENCHMARKS New Data Center
- Page 61 and 62: Comparative Performance Monte Carlo
- Page 63 and 64: Comparative Performance QuantLib* S
- Page 65 and 66: Comparative Performance Monte Carlo
- Page 67 and 68: Comparative Performance Monte Carlo
- Page 69 and 70: Comparative Performance Monte Carlo
- Page 71 and 72: Comparative Performance Xcelerit* L
- Page 73 and 74: Comparative Increase 1 0 Iso3DFD* 1
- Page 75 and 76: Comparative Performance Petrobras*
- Page 77 and 78: CLUSTER BENCHMARK Data Center Serve
- Page 79 and 80: Comparative Performance BerkeleyGW*
- Page 81 and 82: Comparative Performance ASKAP* tHog
- Page 83 and 84: Comparative Increase specfem3D 300K
Comparative Performance<br />
AMBER* 14<br />
Particle Mesh Ewald (PME) Cellulose NPT<br />
CLUSTER BENCHMARK<br />
4 NODES<br />
APPROVED FOR PUBLIC PRESENTATION<br />
AMBER* 14 PME Cellulose NPT (408K Atoms)<br />
2.8X<br />
2.6X<br />
2.3X<br />
2.3X<br />
2<br />
1.9X<br />
1.6X<br />
1.3X<br />
1<br />
1<br />
0<br />
Node 1 Node 2 Node 3 Node 4<br />
Intel® Xeon® processor E5-2697 v2<br />
Intel® Xeon® processor E5-2697 v2 + Intel® Xeon Phi coprocessor 7120A<br />
For configuration details, go here.<br />
SOURCE: INTEL MEASURED RESULTS AS OF SEPTEMBER, 2014<br />
Application: AMBER* 14<br />
Description: Bimolecular Simulations (Protein, DNA, RNA, virus<br />
etc.). Full double precision (DPDP). More at http://ambermd.org/<br />
Availability:<br />
• Code: Available as a patch.<br />
• Recipe: Available here (Section 18.7 of the manual).<br />
Usage Model:<br />
• Baseline is on the Intel® Xeon® processor E5-2697 v2 host<br />
only (also measured in<br />
http://ambermd.org/gpus/benchmarks.htm#Benchmarks) and<br />
speed up is shown with offload processing on both the Intel<br />
Xeon processor E5-2697 v2 and the Intel® Xeon Phi<br />
coprocessor 7120A.<br />
• Performance shown is for the released code, double precision<br />
across the platforms, 50% workload on the host, 50% on the<br />
coprocessor.<br />
Highlights: The code had been optimized, will be delivered to<br />
the AMBER community (whoever has license) and available as<br />
update patch during code configuration.<br />
Results: Optimized offload process demonstrated compelling<br />
cluster performance improvement, up to 2.8X, over the baseline<br />
Intel® Xeon® processor E5-2697 v2.<br />
Software and workloads used in performance tests may have been optimized for performance only on Intel microprocessors. Performance tests, such as SYSmark and MobileMark, are measured using specific computer systems,<br />
components, software, operations and functions. Any change to any of those factors may cause the results to vary. You should consult other information and performance tests to assist you in fully evaluating your contemplated<br />
purchases, including the performance of that product when combined with other products. For more information go to http://www.intel.com/performance *Other names and brands may be claimed as the property of others<br />
35


