V - Missouri Department of Natural Resources
V - Missouri Department of Natural Resources
V - Missouri Department of Natural Resources

You also want an ePaper? Increase the reach of your titles
YUMPU automatically turns print PDFs into web optimized ePapers that Google loves.
14<br />
flow. The fact that the upper winds steered the thunderstorm cells along paths which were more<br />
or less parallel to the front allowed the cells to remain in a region where the low-level con<br />
vergence and water-vapor supply conditions were favorable for an extended period <strong>of</strong> time.<br />
An interesting aspect <strong>of</strong> this situation is the fairly pronounced diurnal variation in rain<br />
fall intensity which was apparent. Practically all <strong>of</strong> the very heavy rainfall occurred in the<br />
late afternoon or night. None <strong>of</strong> the recording gages caught as much as one inch in either <strong>of</strong><br />
the periods 1200-1500 CST or 1500-1800 CST on July 19, and only one had one inch <strong>of</strong> rainfall<br />
between 0900 CST and 1200 CST on that day. Heavy rain fell before and after these time periods.<br />
An examination <strong>of</strong> the southerly low-level winds in the warm air shows a marked diurnal<br />
variation in wind speeds. At Wichita, Kansas the wind about 2,700 ft above ground increased<br />
from 14 knots at noon on July 18 to 47 knots at midnight. By noon <strong>of</strong> the 19th it had diminished<br />
to 23 knots only to pick up again by the next midnight to 41 knots. This wind variation un<br />
doubtedly led to a diurnal variation in the low-level convergence in the frontal zone and helps<br />
explain the increase in rainfall at night.<br />
Why did this particular area have so much rain? What was unusual about conditions in the<br />
northwest <strong>Missouri</strong> area? The north-south positioning <strong>of</strong> the heavy rain can be related quite<br />
well to the position <strong>of</strong> the front at 850 mb. The east-west positioning is somewhat to the east<br />
<strong>of</strong> the axis <strong>of</strong> the low-level jet, as indicated by the gradient <strong>of</strong> the contours at 850 mb in<br />
figure 2. This eastward shift is not too surprising, since individual thunderstorm cells had<br />
a general eastward movement and the water vapor content <strong>of</strong> the lower atmosphere increased sub<br />
stantially from west to east across Kansas and western <strong>Missouri</strong>.<br />
Rainfall Intensity and Distribution by U. S. Weather Bureau<br />
The total precipitation for the storm <strong>of</strong> July 17-20 is shown by the isohyetal map <strong>of</strong> north<br />
western <strong>Missouri</strong> (fig. 3). The lines were smoothed to represent average amounts in areas where<br />
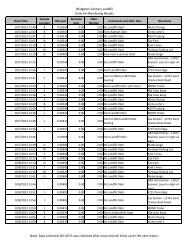
numerous supplemental observations were reported. Representative mass rainfall graphs (fig. 4)<br />
were plotted from selected recording rain gage charts. These graphs were grouped with respect<br />
to area and give a general indication <strong>of</strong> time and duration. As examples, the group represented<br />
by Elm and Lees Summit, southeast <strong>of</strong> Kansas City, shows heavy precipitation in the afternoon and<br />
evening <strong>of</strong> July 19. Similarly a group represented by Thurman and Tabor, Iowa shows heavy precip<br />
itation in southwestern Iowa and extreme northwestern <strong>Missouri</strong> near midnight <strong>of</strong> July 18-19. This<br />
group supports the supplemental rainfall reports which established the record-breaking precipi<br />
tation in the Rockport, <strong>Missouri</strong> area.