V - Missouri Department of Natural Resources
V - Missouri Department of Natural Resources
V - Missouri Department of Natural Resources

You also want an ePaper? Increase the reach of your titles
YUMPU automatically turns print PDFs into web optimized ePapers that Google loves.
Water <strong>Resources</strong> Report 21<br />
FLOODS <strong>of</strong> July 18-23,1965 in Northwestern <strong>Missouri</strong>
WATER RESOURCES<br />
REPORT 21<br />
Floods <strong>of</strong> July 18-23, 1965 in<br />
Northwestern <strong>Missouri</strong><br />
by<br />
James E. Bowie<br />
and<br />
E. Eugene Gann<br />
Hydraulic Engineers<br />
U. S. Geological Survey, Water <strong>Resources</strong> Division<br />
Prepared in cooperation<br />
with the<br />
<strong>Missouri</strong> Geological Survey and Water <strong>Resources</strong><br />
Nissouri State Highway Commission<br />
Corps <strong>of</strong> Engineers, <strong>Department</strong> <strong>of</strong> the Army<br />
Environmental Science Services Administration, Weather Bureau<br />
Rolla, Hissouri<br />
December 1967
ILLUSTRATIONS<br />
Figure 1. Map <strong>of</strong> <strong>Missouri</strong> showing area affected by floods <strong>of</strong> July 18-23, 1965 11<br />
COVER<br />
2.<br />
3.<br />
Hap <strong>of</strong> central United States showing meteorological conditions in<br />
the lower atmosphere at four selected times during the period July<br />
18-20, 1965 .•••....<br />
Isohyeeal map <strong>of</strong> northwestern <strong>Missouri</strong> showing total precipitation<br />
for storm <strong>of</strong> JuLy 17-20, 1965 .<br />
4. Representative mass rainfall curves for storm <strong>of</strong> July 17-20, 1965,<br />
from U. S. Weather Bureau. . . . . . . . . . . . . . . 16<br />
S. Aerial view <strong>of</strong> Smithville business district 4 feet below crest <strong>of</strong> flood 24<br />
•• Flood damage to building on Highway 169 in Smithville<br />
7. Flood damage on Grove Creek at south edge <strong>of</strong> Edgerton<br />
••<br />
Aerial view <strong>of</strong> Agency near crest <strong>of</strong> flood<br />
•• Aerial view <strong>of</strong> Tracy, Highway '2. and Interstate 29, several feet<br />
below crest <strong>of</strong> flood.<br />
10. Floodwaters in Mosby several feet below the crest 32<br />
11. Map <strong>of</strong> northwestern <strong>Missouri</strong> showing location <strong>of</strong> flood-measurement sites<br />
for floods <strong>of</strong> July 18-23, 1965. • . . . . .. 40<br />
12. Flood hydrographs at gaging stations for floods <strong>of</strong> July 18-23, 1965 .48,49.50<br />
13. Relation <strong>of</strong> unit discharge to drainage area for <strong>Missouri</strong> floods. , 52<br />
14. Relation <strong>of</strong> peak discharge to drainage area for stations in Rock Creek.<br />
Tarkio River, Little Tarkio Creek, Mill Creek, Nodaway River, and Platte<br />
River basins for floods <strong>of</strong> July 18-23, 1965. Frequency curves shown for<br />
10- ,25-, and 50-year floods .•.... " 53<br />
15. Relation <strong>of</strong> peak discharge to drainage area for stations in Grand.<br />
Fishing, Crooked. Wakenda, and Osage River basins. for floods <strong>of</strong> July<br />
18-23, 1965. Frequency curves shown for 10-, 25-, and 50-year floods 54<br />
16. Relation <strong>of</strong> peak discharge to drainage area for stations in Blue, Little<br />
Blue, and Blackwater River basins, for floods <strong>of</strong> July 18-23, 1965.<br />
Frequency curves shown for 10-, 25-, and 50-year floods. • . . . . . .. 55<br />
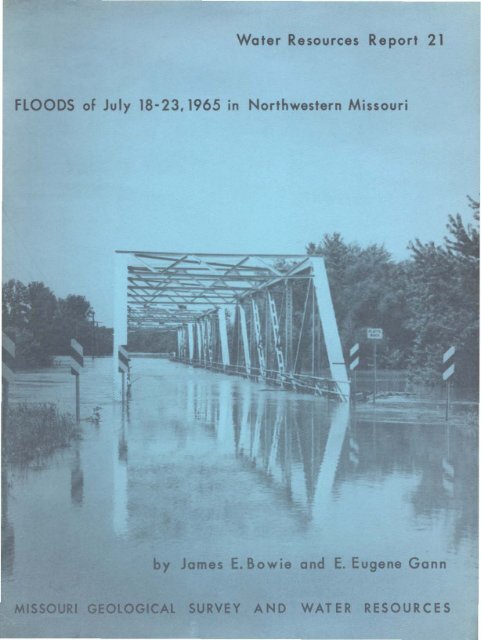
Highway 92 bridge. west <strong>of</strong> Platte City, near crest <strong>of</strong> flood <strong>of</strong> July 20,<br />
21, 1965. Photograph by Corp <strong>of</strong> Engineers.<br />
Page<br />
13<br />
lS<br />
2S<br />
2.<br />
30<br />
31<br />
S
Plate 1.<br />
PlATES<br />
Flood pr<strong>of</strong>ile <strong>of</strong> Rock Creek for flood <strong>of</strong> July 1965. . .<br />
2. Flood pr<strong>of</strong>iles<br />
floods <strong>of</strong> June<br />
<strong>of</strong> One Hundred and<br />
1947 and July 1965<br />
lYo and Little Platte Rivers for<br />
3. Flood pr<strong>of</strong>ile <strong>of</strong> Platte River for floods <strong>of</strong> June 1947 and July 1965 27<br />
4. Flood<br />
flood<br />
pr<strong>of</strong>iles <strong>of</strong> Fishing<br />
<strong>of</strong> July 1965....<br />
River and East Fork FlBhing River for<br />
TABLES<br />
Table 1. Urban property units flooded. July 1965 flood J6<br />
2. Urban damages, July 1965 flood 37<br />
3. Rural damages. July 1965 flood 3B<br />
,. Summary <strong>of</strong> peak stages and discharges foe floods <strong>of</strong> July 18-23, 1965 .n'<br />
comparison wi th maximum floods previously known 4l<br />
Page<br />
19<br />
21<br />
33<br />
Page<br />
7
FLOODS OF JULY 18-23, 1965 IN<br />
NORTHWESTERN MISSOURI<br />
by<br />
James E. Bowie<br />
and<br />
E. Eugene Gano<br />
ABSTRACT<br />
The disastrous floods <strong>of</strong> July 18-23, 1965 in northwestern <strong>Missouri</strong> were <strong>of</strong> a frequency<br />
greatly in excess <strong>of</strong> the defined 50-year flood. Recurrence intervals <strong>of</strong> both rainfall and<br />
run<strong>of</strong>f were extremely high.<br />
Rainfall totaled more than 20 inches in the towns <strong>of</strong> Rockport and Edgerton during the<br />
period July 17-20. Rainfall recorded at Edgerton, in a 24-hour period, was 2.5 times the<br />
IOO-year point rainfall for northwestern <strong>Missouri</strong>. The average rainfall that occurred over<br />
a 400 square mile area, in 24 hours, was almost double the amount expected for the IOO-year<br />
rainfall.<br />
Peak discharges at 23 flood measuring sites exceeded the 50-year flood discharge. At<br />
10 <strong>of</strong> these sites the peak discharge was from 2 to 6 times as large as the discharge for the<br />
50-year flood. The highest known unit rate <strong>of</strong> run<strong>of</strong>f ever recorded in <strong>Missouri</strong>, 6,690 cubic<br />
feet per second per square mile, was experienced at Boney Branch at Rockport. The record<br />
flood <strong>of</strong> June 1947 was exceeded in the downstream portions <strong>of</strong> the One Hundred and Two, Platte,<br />
Little Platte, and Fishing River basins. The frequency <strong>of</strong> the flood in the Fishing River<br />
basin increased with increasing size <strong>of</strong> drainage area.<br />
Four lives were lost during the flood, 729 residences were damaged or destroyed, and<br />
433,700 acres <strong>of</strong> agricultural lands were flooded. The total flood damage amounted to<br />
$24,292,900.<br />
9
10<br />
INTRODUCTION<br />
Outstanding floods occurred July 18-23, 1965 on <strong>Missouri</strong> River tributaries in an area east<br />
<strong>of</strong> the <strong>Missouri</strong> River extending [rom the lowa-Hissouri State line on the north to the Blackwater<br />
River basin on the south and east into the Grand River basin (fig. 1). Floodwaters [rom these<br />
tributaries produced extensive flooding on the Hissouri River from St. Joseph to its mouth near<br />
St. Louis.<br />
The floods were due to torrential rainfalls during July 17·20 following a 4-month period<br />
<strong>of</strong> near normal precipitation. Storm totals amounting to more than 20 inches were reported at<br />
Rockport and Edgerton. The Little Platte River at Smithville crested 7.4 feet higher than any<br />
previously known flood. The crest on the Platte River, 3% miles northeast <strong>of</strong> Agency, where a<br />
streamgaging station has been in operation since May 1924, was 4.6 feet higher than any prev<br />
iously recorded stage. Four lives were lost, 15 communities suffered damages and thousands <strong>of</strong><br />
acres <strong>of</strong> croplands were flooded.<br />
Purpose and Scope<br />
The purpose <strong>of</strong> this report is to document these outstanding floods for future hydrologic<br />
planning within the State. Data related to unusual floods are essential to wise development,<br />
within any basin, where the threat <strong>of</strong> potential flooding endangers public interests and public<br />
safety. This report presents storm and flood descriptions, damage estimates, peak stages and<br />
discharges, flood pr<strong>of</strong>iles, station data, and discharge hydrographs for the floods <strong>of</strong> July 18<br />
23, 1965 and indicates the unusually high recurrence interval <strong>of</strong> both rainfall and run<strong>of</strong>f assoc<br />
iated with this storm.<br />
Cooperation and Acknowledgments<br />
Rainfall data in this report were collected by the Weather Bureau precipitation gaging<br />
network and several precipitation gages operated by the U. S. Geological Survey in connection<br />
with streamflow network operation. The Weather Bureau and Corps <strong>of</strong> Engineers collected addition<br />
al rainfall information by contacting local residents in areas <strong>of</strong> intense rainfall. These data<br />
were used by the Weather Bureau in preparing an isOhyetal map and representative mass rainfall<br />
curves for the storm. The data are published in the July 1965 issues <strong>of</strong> Monthly Climatological<br />
Data and Hourly Precipitation Data for Iowa, Nebraska and <strong>Missouri</strong>. Hourly precipitation data<br />
collected by the U. S. Geological Survey at Blairstown, Osborn, and Arrow Rock, <strong>Missouri</strong> were not<br />
published but are available from the District <strong>of</strong>fice in Rolla, <strong>Missouri</strong>. The sections on meteor<br />
ological conditions and on rainfall intensity and distribution were prepared by the Environ<br />
mental Science Services Administration, Weather Bureau, Kansas City, <strong>Missouri</strong>. Flood damage
12<br />
estimates and flood photographs were furnished by the Corps <strong>of</strong> Engineers. Flood pr<strong>of</strong>iles were<br />
prepared jointly by the Corps <strong>of</strong> Engineers and U. S. Geological Survey. Streamflow data collec·<br />
tion was done by the U. S. Geological Survey with the financial cooperation <strong>of</strong> the 1'11550u[1<br />
Geological Survey and Water <strong>Resources</strong>, the Corps <strong>of</strong> Engineers, and the <strong>Missouri</strong> State Highway<br />
Commission.<br />
DESCRIPTION OF STOR!'IS<br />
Meteorological Conditions by U. S. Weather Bureau<br />
The meteorological conditions prevailing in the lower atmosphere during the flood period<br />
are shown by the charts in figure 2. which depict conditions on the 850 millibar (mb) surface.<br />
This level is about 4,000 feet above ground in northwestern <strong>Missouri</strong>. It will be seen that a<br />
quasi-stationary low center was located in the vicinity <strong>of</strong> Colorado and a quasi-stationary high<br />
was over or near Arkansas. A cold migratory high center moved down from Canada snd across Lake<br />
Michigan. To the south <strong>of</strong> the front a strong south-southwesterly low-level flow prevailed<br />
across Kansas and Oklahoma which prOVided an abundant moisture supply from the Gulf <strong>of</strong> Mexico,<br />
a necessary condition for heavy rain in the central United States. The front served as a<br />
"trigger" mechanism to induce a convergence <strong>of</strong> the low-level water vapor transport in the rain<br />
area..<br />
The surface temperature contrast across the front was quite marked. Mid-afternoon temper<br />
atures on July 18 and 19 were in the upper 90's and lower 100's in south-central and southeast<br />
ern Kansas. Afternoon temperatures to the north <strong>of</strong> the front were in the upper 70's and lower<br />
80's on July 18 and even cooler July 19 when they were in the lower 70's in northern <strong>Missouri</strong><br />
and in Iowa. The 850 mb isotherms (dotted lines) in figure 2 also indicate a strong tempera<br />
ture gradient. Cloudiness and cooling by evaporation <strong>of</strong> falling raindrops to the north <strong>of</strong> the<br />
surface position <strong>of</strong> the front helped to maintain this temperature contrast. The rain area may<br />
be considered to have had a tendency toward self-perpetuation, in the sense that rain and<br />
clouds helped to maLntain a temperature gradient favorable for further rain.<br />
Slowly-changing weather situations such as rhis one are more likely to be flood-producing<br />
for the reason that the rainfall is concentrated in a small area, rather than being spread over<br />
a larger area, as it would be in a more rapidly-moving situation. Steering-level winds (10,000<br />
ft and up) were light west-northwesterly and radar data show that precipitation echoes in the<br />
rain area moved generally in an east-southeasterly direction at 15-25 knots (l knot = 1.15<br />
miles per hour). TIlere was a persistent regeneration <strong>of</strong> echoes upstream in the steering-level
14<br />
flow. The fact that the upper winds steered the thunderstorm cells along paths which were more<br />
or less parallel to the front allowed the cells to remain in a region where the low-level con<br />
vergence and water-vapor supply conditions were favorable for an extended period <strong>of</strong> time.<br />
An interesting aspect <strong>of</strong> this situation is the fairly pronounced diurnal variation in rain<br />
fall intensity which was apparent. Practically all <strong>of</strong> the very heavy rainfall occurred in the<br />
late afternoon or night. None <strong>of</strong> the recording gages caught as much as one inch in either <strong>of</strong><br />
the periods 1200-1500 CST or 1500-1800 CST on July 19, and only one had one inch <strong>of</strong> rainfall<br />
between 0900 CST and 1200 CST on that day. Heavy rain fell before and after these time periods.<br />
An examination <strong>of</strong> the southerly low-level winds in the warm air shows a marked diurnal<br />
variation in wind speeds. At Wichita, Kansas the wind about 2,700 ft above ground increased<br />
from 14 knots at noon on July 18 to 47 knots at midnight. By noon <strong>of</strong> the 19th it had diminished<br />
to 23 knots only to pick up again by the next midnight to 41 knots. This wind variation un<br />
doubtedly led to a diurnal variation in the low-level convergence in the frontal zone and helps<br />
explain the increase in rainfall at night.<br />
Why did this particular area have so much rain? What was unusual about conditions in the<br />
northwest <strong>Missouri</strong> area? The north-south positioning <strong>of</strong> the heavy rain can be related quite<br />
well to the position <strong>of</strong> the front at 850 mb. The east-west positioning is somewhat to the east<br />
<strong>of</strong> the axis <strong>of</strong> the low-level jet, as indicated by the gradient <strong>of</strong> the contours at 850 mb in<br />
figure 2. This eastward shift is not too surprising, since individual thunderstorm cells had<br />
a general eastward movement and the water vapor content <strong>of</strong> the lower atmosphere increased sub<br />
stantially from west to east across Kansas and western <strong>Missouri</strong>.<br />
Rainfall Intensity and Distribution by U. S. Weather Bureau<br />
The total precipitation for the storm <strong>of</strong> July 17-20 is shown by the isohyetal map <strong>of</strong> north<br />
western <strong>Missouri</strong> (fig. 3). The lines were smoothed to represent average amounts in areas where<br />
numerous supplemental observations were reported. Representative mass rainfall graphs (fig. 4)<br />
were plotted from selected recording rain gage charts. These graphs were grouped with respect<br />
to area and give a general indication <strong>of</strong> time and duration. As examples, the group represented<br />
by Elm and Lees Summit, southeast <strong>of</strong> Kansas City, shows heavy precipitation in the afternoon and<br />
evening <strong>of</strong> July 19. Similarly a group represented by Thurman and Tabor, Iowa shows heavy precip<br />
itation in southwestern Iowa and extreme northwestern <strong>Missouri</strong> near midnight <strong>of</strong> July 18-19. This<br />
group supports the supplemental rainfall reports which established the record-breaking precipi<br />
tation in the Rockport, <strong>Missouri</strong> area.
18<br />
cell which produced the maximum reported rainfall. This rainfall was 21 inches in 36 hours,<br />
<strong>of</strong> which 13 inches was reported by newspapers (The Kansas City Times, July 20, 1965, p. 1, 5)<br />
to have fallen in a 3-hour period starting at 6:00 P.M. (1800 hours) on Sunday night, July 18.<br />
Rockport was the only town in the basin to suffer extensive flood damage. Water from Boney<br />
Branch and Rock Creek inundated about 60 percent <strong>of</strong> the city, covering the entire business dis<br />
trict to a depth <strong>of</strong> 2 to 3 feet. Damage to crops, roads, and bridges occurred in the vicinity<br />
<strong>of</strong> and downstream from Rockport in the lower part <strong>of</strong> the basin. Flood pr<strong>of</strong>iles for Rock Creek<br />
are shown in plate 1.<br />
Tarkio River basin<br />
Flooding on the Tarkio River was not severe, and only minor flooding occurred in various<br />
low-lying areas. Two distinct peaks occurred during the storm period <strong>of</strong> almost the same mag·<br />
nitude, 9,200 and 9,440 cfs, at the streamflow station at Fairfax. These peaks were consider·<br />
ably less than have been recorded on other occasions.<br />
Nodaway River basin<br />
This flood was minor on the Nodaway River except in the lower end <strong>of</strong> the basin below the<br />
streamflow station at Burlington Junction where more than 7,000 acres <strong>of</strong> croplands were flooded<br />
and heavy damage to roads and bridges resulted.<br />
Platte River basin<br />
The One Hundred and Two River basin, a major tributary to the Platte River from the west,<br />
received heavy rains below Maryville, as indicated by figure 3. At the streamgaging station<br />
on One Hundred and Two River near MaryVille, where the maximum flood in 33 years <strong>of</strong> record<br />
occurred on June 14, 1947, the July 19, 1965 flood peak was 10 feet below that <strong>of</strong> the 1947 flood.<br />
The flood pr<strong>of</strong>ile (pl. 2) shows that from Bolckow, 24 miles downstream from Maryville, to the<br />
mouth <strong>of</strong> the One Hundred and Two River, flood crest elevations for the 1965 flood ranged from<br />
2 to 10 feet higher than the 1947 flood elevations. Rosendale (pop. 234), near the center <strong>of</strong><br />
an area where 18 inches <strong>of</strong> rain occurred in the 3-day period, was heavily damaged by the flood<br />
ing <strong>of</strong> 17 residences, 8 businesses, and I public building.<br />
The Little Platte River, in the southeastern part <strong>of</strong> the Platte River basin, was severely<br />
flooded throughout its entire length. Considerable damage was done to crops, roads, and bridges<br />
in the rural stretches <strong>of</strong> the stream. The Little Platte River at Smithville reached a stage<br />
<strong>of</strong> 44.8 feet, 21.5 feet above flood stage. This was 7.4 feet above the previous highest known<br />
flood <strong>of</strong> July 1947. Plate 2 shows the flood pr<strong>of</strong>iles <strong>of</strong> both the 1965 and the 1947 floods.<br />
smithville, a community <strong>of</strong> 1,254 population, was the major flood damage center <strong>of</strong> the storm
(figs. 5 and 6). Of the 200 homes flooded by the Little Platte River, 46 were destroyed or so<br />
severely damaged that they were condemned or razed. The flood damaged 67 business places,S<br />
churches and church properties, the high school, the city water supply pumping stations, the<br />
sanitary lagoon, and various other municipal properties. The telephone exchange was out <strong>of</strong><br />
service for 4 days.<br />
Castile Creek, which enters the Platte River from the east between One Hundred and Two and<br />
Little Platte Rivers, also experienced flooding. Rainfall for the period July 17-20 ranged<br />
from 8 to 14 inches over the basin. Jenkins Branch, a tributary to Castile Creek, experienced<br />
a stage 2.5 feet higher than the previous highest stage in 15 years <strong>of</strong> record at the stream<br />
gaging station at Gower.<br />
Gtove Creek, a tributary to the Platte River below Castile Creek, flooded the town <strong>of</strong><br />
Edgerton (pop. 449) on the night <strong>of</strong> July 19, causing extensive damage (fig. 7). The area<br />
drained by Grove Creek was in the center <strong>of</strong> one <strong>of</strong> the storm cells where over 20 inches <strong>of</strong><br />
rainfall was reported. The flood pr<strong>of</strong>ile <strong>of</strong> Platte River (pl. 3) indicates that tributaries<br />
in the vicinity <strong>of</strong> Edgerton contributed large amounts <strong>of</strong> floodwater to the Platte River. Twelve<br />
homes, about 25 automobiles, and 3 bridges were destroyed in Edgerton.<br />
On the main stem <strong>of</strong> the Platte River disastrous flooding occurred from Rochester to the<br />
river's mouth. At various points downstream from Edgerton the flood crest reached elevations<br />
9 feet higher than the previous highest known flood <strong>of</strong> June 1947 (pl. 3). The towns <strong>of</strong> Agency,<br />
Tracy, and Farley were inundated as the river rose to a record crest <strong>of</strong> 35.05 feet at the stream·<br />
gaging station near Agency. The crest was 4.6 feet above the previous record stage <strong>of</strong> 30.46<br />
feet recorded in June 1947. Records at this station have been collected since May 1924. Approx<br />
imately 85 percent <strong>of</strong> the town <strong>of</strong> Agency (pop. 240) was inundated (fig. 8). Thirty-three resi<br />
dences and one mobile home were flooded, and 13 <strong>of</strong> the residences have been abandoned since the<br />
flood. Two churches and the Post Office were severely damaged. The business district <strong>of</strong> Agency,<br />
which has been subjected to many floods, suffered only moderate losses.<br />
Farther downstream, Interstate Highway 29 was overtopped and traffic stopped near Platte<br />
City. At Tracy (pop. 208), about one mile downstream from Interstate Highway 29 on Highway 92.<br />
about one· third <strong>of</strong> the residential area was flooded by the Platte River (fig. 9). Water depths<br />
reached about 15 feet in the lower sections <strong>of</strong> the town inundating 24 dwellings, 6 mobile homes,<br />
2 churches, 6 business places, and the Platte County Fairgrounds. About 90 persons were forced<br />
to leave their homes and many <strong>of</strong> them were unable to remove their furniture and personal belong<br />
ings. Highway 92, west <strong>of</strong> the community. was closed for about 4 days.<br />
23
24<br />
FIG. 5. Aerial<br />
flood.<br />
view <strong>of</strong> Smithville business district<br />
Photograph by Corps <strong>of</strong> Engineers.<br />
4 feet below crest <strong>of</strong>
l"J)<br />
,<br />
FIG. 6. Flood damage to building on Highway 169 in Smithville. Photograph by<br />
Corps <strong>of</strong> Engineers.<br />
25
26<br />
FIG. 7. Flood damage on Grove Creek at south edge <strong>of</strong> Edgerton. Photograph by<br />
Corps <strong>of</strong> Engineers.
HIGH-,----,W:..:A::...T,-,E::.:..:.R---,M::.A=R.:.:K",,-S<br />
RIGHT<br />
LEFT<br />
1947<br />
BANK---X-----O<br />
BANK ---0-----A<br />
EXPLANATION<br />
1965<br />
NOTES<br />
910 910<br />
A.T. a S.F. R<br />
PLATE 2 --Flood Pr<strong>of</strong>iles <strong>of</strong> One Hundred ond Two ond Little Platte Rivers for Floods <strong>of</strong> June. 1947 and July, 1965. o<br />
F.s. 20
30<br />
FIG. 8. Aerial view <strong>of</strong> Agency near crest <strong>of</strong> flood. Photograph by Corp <strong>of</strong><br />
Engineers.
FIG. 9. Aerial viev <strong>of</strong> Tracy,<br />
below crest <strong>of</strong> flood.<br />
Highway 92, and Interstate 29, several<br />
Photograph by Corps <strong>of</strong> Engineers.<br />
feet<br />
31
Table 1 -- Urban property units flooded , July 1965 flood<br />
Population Public and<br />
Basin and community (1960 census) Residences Businesses Quasi-public<br />
Rock Creek<br />
Rockport 1,310 100 40 Not available<br />
Di 110n Creek<br />
Amazonia 326 8 5<br />
Line Creek<br />
Riverside and Northmoor 2,011 49 12 1<br />
Platte River<br />
Rosendale 234 17 8 1<br />
Agency 240 34 5 4<br />
Edgerton 449 35 6<br />
Smithville 1,254 200 67 8<br />
Tracy 208 30 6 3<br />
Farley 120 8 4 1<br />
Easton 198 3<br />
Fishing River<br />
Excelsior Springs 6,473 68 28 4<br />
Mosby 293 95 9 4<br />
Crooked River<br />
Hardin 727 77 4 1<br />
Henrietta 497 4<br />
Blackwater River<br />
Sweet Springs 1,452 1<br />
729 194 27
Acres flooded<br />
Stream Total crop<br />
Rock Creek Not available<br />
<strong>Missouri</strong> River<br />
Main a tern 281,700 199,600<br />
Little Tarkio Creek 8,800 8,500<br />
Squaw Creek 12,700 5,100<br />
Nodaway River 7,900 7,600<br />
Platte River and<br />
minor tributaries 35,100 34,100<br />
One Hundred and 1\10 River l8,lO0 17,800<br />
Little Platte River 9,200 9,000<br />
Little Blue River 3,000 2,400<br />
FLshing River 10,000 >.000<br />
Crooked River 19,900 17,700<br />
Wakenda Creek 3,300 2.900<br />
Blackwater River 24,000 22,600<br />
Total 433,700 336,300<br />
Table 3 -- Rural damages, July 1965 flood<br />
Estimate <strong>of</strong> damages<br />
Agricultural Transportation &Utilities Total<br />
I 149,000 $320,000 I 469,000<br />
10,400,000 500,000 10,900,000<br />
466,500 2,400 468,900<br />
364.400 1,300 365,100<br />
192,100 21,300 813,400<br />
2,383,800 16,600 2,400,400<br />
677,500 24,900 702,400<br />
354,900 12,500 361,400<br />
111,800 0 111,800<br />
588,700 165,000 153,700<br />
855,300 22,000 877 ,300<br />
182,100 2,000 184,700<br />
868,800 3,000 871,800<br />
18,195,500 1,091,000 L9,286.500
LAaLE 4 .- continued<br />
SUMMARY OF PEAK STAGES AND DISCHARGES FOR FLOODS OF JULY 18-23, 1965 AND C
TABU: 4 -- continued<br />
SUlflA,RY OF PEAK STAGES AND DISCHARGES FOR FLOODS OF JULy 18-23, 1965 AND C(JoIPARISON<br />
Wint MAXIMUM FLOODS PREVIOUSLY KN(l,TN<br />
definition <strong>of</strong> symbols on page 47<br />
Maximum flood nreviouslv know Maximum flood Jul 18-23 1965<br />
Index<br />
number<br />
Station<br />
number Station name<br />
Drainage<br />
area<br />
(sq mil<br />
Period<br />
<strong>of</strong><br />
record Date<br />
Gage<br />
heigh<br />
(tt)<br />
Discharg<br />
(efs) Date<br />
Gage<br />
heigh<br />
(Ct)<br />
Dischar e<br />
CCs per Rat 10<br />
sq mi to e" Q,O<br />
42 6-9077 Blackwater River at Valle<br />
City 547 1958-65 Apr.16, 1960 -- 66,500 lJuly 20 31.38 J57 ,000 104 1.4<br />
Sept. 14,1961 31. 75 ----- -- - ---- - -<br />
4) 6-9080 Blackwater River at Blue<br />
Lick 1,120 1922-33 Nov. 18,1928 41. 25 54,000 uly 23 37.50 26.000 23.2 0.4<br />
MISSOURI RIVER MAIN STEM<br />
1938-65<br />
44 6-9090 <strong>Missouri</strong> River at Boon- 505,700 l844 June 21,1844 32.7 710,000 uly 2J 26.05 53,000 - -<br />
ville<br />
1925-65 July 17,1951 32.82 550,000 -- - ---- - -<br />
OSAGE RIVER BASIN<br />
4' 6-9217 ,",'est Branch Crawford Cree<br />
near Lees SUllWlli t .80 1955- 65 Apr.6,1960 15.57 839 uly l' 15.73 .00 1,120 0.7<br />
MISSOURI RIVER MAIN STEM<br />
46 6-9345 <strong>Missouri</strong> River at Hermann 528,200 1844 June 1844 35.5 892,000 uly 24 25.40 56,000 - -<br />
1897- June 6, 7,<br />
1965 1903 -- 676,000 -- - ---- - -<br />
July 19,1951 33.33 ---- -- - ---- - -<br />
•
TABLE 4 -- continued<br />
SUMMARY OF PEAK STAGES AND DlSCHARGES FOR FLOODS OF JULY 18-23, 1965 AND CQiPARISON<br />
WITH MAXIMmt FLOODS PREVlOUSLY KN(),.'N<br />
* Ratio <strong>of</strong> peak discharge to 50-year flood discharge.<br />
a Affected by backwater from ice.<br />
b computed by Corps <strong>of</strong> Engineers.<br />
c Outside gage stage <strong>of</strong> 18.8 ft.<br />
d Also, stage at unknown date prior to 1932, from floodmarks.<br />
e Stage at point on right bank, 200 ft upstream from gage. Floods <strong>of</strong> July 6, 1951 and July 19, 1965.<br />
reached stages <strong>of</strong> 20.0 and 19.7 ft, respectively, at same point (from floodmarks).<br />
f Discharge unknown.<br />
g Occurred two days earlier than peak discharge.<br />
h Affected by backwater and overflow from <strong>Missouri</strong> River.<br />
i Levee break, discharge occurred after crest at stage <strong>of</strong> 28.0 ft.<br />
j Occurred 5 hrs earlier than peak stage.
,.<br />
discharge in excess <strong>of</strong> the SO-year flood (fig. 16), and the 2S-year flood was exceeded at the<br />
station on South Fork Blackwater River near Elm.<br />
Comparison \lieh Previous Floods<br />
The floods <strong>of</strong> July 18-23, 1965 in northwestern <strong>Missouri</strong> were outstanding in comparison<br />
vith previous major floods <strong>of</strong> record. The record floods <strong>of</strong> June 1947 in the Platte, Little<br />
Platte, One Hundred and tva, and Fishing River basins were exceeded in the downstream portions<br />
<strong>of</strong> each <strong>of</strong> these basins. The floods <strong>of</strong> July 1951 and September 1961 1n the Blue, Little Blue,<br />
Fishing, Crooked, Wakenda, and Blackwater River basins were exceeded or approached by the<br />
floods <strong>of</strong> 1965.<br />
The July 1965 flood will long be remembered as "The Big Flood" by those local residents<br />
whose houses and crops were damaged or completely destroyed.
64<br />
NODAWAY RIVER BASIN<br />
7 (6-8175) Nodaway River near Burlington Junction<br />
Location.--Lat. 40°26'40" N., long. 95°05'20" W., in NWl; sec. 17,<br />
T. 65 N.• R. 37 W., on downstream side <strong>of</strong> left pier <strong>of</strong> bridge<br />
on State Highway 4, a quarter <strong>of</strong> a mile upstream from Hill<br />
Creek, 0.5 mile downstream from Wabash Railroad Co. bridge,<br />
and 1% miles vest <strong>of</strong> Burlington Junction.<br />
Drainage area.--l,240 sq mi.<br />
Gage·height record.--Water-stage recorder graph except July 18, 22, 23,<br />
from graph drawn on basis <strong>of</strong> once-daily wire-weight gage readings.<br />
Datum <strong>of</strong> gage is 896.17 ft above mean sea level, datum <strong>of</strong> 1929.<br />
Discharge record.--Stage-discharge relation defined by current-meter<br />
measurements.<br />
Maxlma.--July 18-23, 1965: Discharge, 7,120 efs 0900 July 19.<br />
(gage height 8.4 ft).<br />
1922-65: Discharge, 32,000 cfs June 14, 1947 (gage height,<br />
19.0 ft); gage height observed, 19.69 ft Mar. 5, 1949, ice jam.<br />
Gage height and discharge at indicated time, 1965<br />
Gage Gage<br />
Time height Discharge Time height Discharge<br />
(feet) (cfs) (feet) (cfs)<br />
July 19 0100 1. 50 334 July 19 1200 7.80 5,980<br />
0200 1.50 334 1300 8.05 6,360<br />
0300 1. 50 334 1400 8.20 6,740<br />
0400 3.00 1,200 1500 7.95 6,170<br />
0500 4.80 2,750 1600 7.65 5,600<br />
0600 6.50 4,450 1700 7.25 4,920<br />
0700 7.00 4,920 1800 6.90 4,450<br />
0800 8.10 6,550 1900 6.50 4,000<br />
0900 8.40 7,120 2000 6.20 3,620<br />
1000 8.30 6,930 2100 5.90 3,420<br />
1100 8.05 6,360 2200 5.50 3,130
9 (6-8180) <strong>Missouri</strong> River at St. Joseph<br />
Gage height and discharge at indicated time, 1965-- continued<br />
Cage Gage<br />
Ti_ height Discharge Time height OLscharge<br />
(feet) refs)- (feet) (ds)•<br />
July 20 1600 18.15 118,000 July 21 1200 15.60 84,800<br />
1800 18.15 118,000 1800 14.80 75,800<br />
2000 18.05 117,000 2400 14.25 70,000<br />
2200 17.90 115,000 July 22 1200 13.31 61,300<br />
2400 17.55 110,000 2400 12.68 SS ,400<br />
July 21 0600 l6.50 96,000<br />
67
70<br />
11 (6-8195) One Hundred and Two River near MaryVille<br />
Gage height and discharge at indicated time, 1965--continued<br />
Gage Gage<br />
Time height Discharge Time height Discharge<br />
(feet) (ds)' (feet) (efs)•<br />
July 19 1900 10.80 2,340 July 20 1200 9.10 1,620<br />
2000 10.42 2,160 1400 8.50 1,380<br />
2100 10.03 1,980 1600 8.05 1,180<br />
2200 9.58 1,820 1800 7.70 1,060<br />
2300 9.25 1,660 2000 7.40 940<br />
2400 8.98 1,580 2200 7.20 870<br />
July 20 0200 8.50 1,380 2400 7.06 818<br />
0400 8.24 1,260 July 21 0600 6.72 600<br />
0600 8.30 1,300 1200 6.23 465<br />
0800 9.00 1,580 1800 5.91 366<br />
1000 9.43 1,740 2400 5.63 296
19 Alger Creek at Camden Point<br />
(Miscellaneous site)<br />
Locatlon.--Lat. 39°26'57" N., long. 94°44'00" W., in SE\: NEt sec. 32,<br />
T. 54 N.• R. 34 W.• at culvert on County Highway E. 0.5 mile southeast<br />
<strong>of</strong> Camden Point.<br />
Drainage area.--2.36 sq mi.<br />
Discharge record.--Culvert flow with flow over road measurement at<br />
3,000 ch.<br />
Haxlmum.·-July 18-23, 1965: Discharge, 3,000 cfs July 19.<br />
20 Linn Branch Tributary at Grayson<br />
(Miscellaneous site)<br />
Location.--Lat. 39031'52" N., long. 94°33'51" W., in SW\: SW\:: sec. 36,<br />
T. 55 N., R. 33 W.• at culvert on U. S. Highway 169, about 700<br />
feet north <strong>of</strong> County Highway 0, at Grayson.<br />
Drainage area.--O.79 sq mi.<br />
Discharge record,--Culvert flow with flow over road measurement<br />
at 2,410 cfs.<br />
Maximum.--July 18-23, 1965: Discharge, 2,410 cfs July 19.<br />
21 Camp Branch at Arley<br />
(Miscellaneous site)<br />
Location.--Lat. 39°24'35" N., long. 94°26'55" W., in NW\ sec. 13, T.<br />
53 N.• R. 32 W., at bridge on County Highway C, 0.5 mile north <strong>of</strong><br />
Arley.<br />
Drainage area.--9.78 sq mi.<br />
Discharge record.--Contracted opening measurement at 5.430 cfs.<br />
Haximum.--July 18-23. 1965: Discharge, 5,430 cfs July 19.<br />
77
80<br />
24 (6-8211.3) First Creek near Nashua<br />
(Crest-stage statLon)<br />
Loc:atlon.--Lac. 39°17'20" N.• long. 94°)5'05" W., in to."W\; SW\ sec:. 26,<br />
T. 52 N., R. 33 W•• at culvert on farm road, ISO ft east <strong>of</strong> u. S.<br />
Highway 169 and 1.0 mile south <strong>of</strong> Nashua.<br />
Drainage area.--O.55 sq mi.<br />
Cage-height rec:ord.--Crest stages only. Arbitrary datum assigned<br />
to gage.<br />
Discharge record.--Stage-disc:harge relation defined by current-meter<br />
measurement at 15.7 cfs and by culvert flow measurements at 63.7,<br />
258, 310, and 831 cfs.<br />
MaxiIll8.--July 18-23, 1965: Discharge, 831 efa July 19 (gage height,<br />
18.40 fe. from hlgh-'Mater pr<strong>of</strong>ile).<br />
1959 to Ju ly 18, 1965: Discharge. )10 cfs May 7. t 961<br />
(gage height, 13.25 ft).<br />
25 First Creek near Linkville<br />
(Miscellaneous site)<br />
Location.--Lat. 39°18'34" N., long. 94°36'19" W., in NEot sec. 21, T.<br />
52. N., R. 33 W.• at culvert on U. S. Highwa)' 71 By-pass, 1.5 miles<br />
northwest <strong>of</strong> Nashua. and 2 miles east <strong>of</strong> Linkville.<br />
Drainage area.--5.23 sq mi.<br />
Discharge record.·-Culvert flow measurement at 4,430 cfs.<br />
Maximum.--July 18-23, 1965: Discharge, 4,430
26 Little Platte River Tributary near Smithville<br />
011scel1aneous site)<br />
Location.--Lat. 39°24'36" N., long. 94°36'46" W.• in NE.}; NE\: sec. 16,<br />
T. 53 N., R. 33 W.• 1500 ft upstream from County Highway KK. 3/4<br />
mile upstream from mouth, and 2 miles northwest <strong>of</strong> Smithville.<br />
Drainage area.--O.44 sq mi.<br />
Discharge record.-- Flow over dam with slope-area measurement at<br />
1,270 ets.<br />
Haximum.--July 18-23, 1965: Discharge, 1,270 eta July 19.<br />
27 Platte River at Platte City<br />
(Miscellaneous site)<br />
Location.--Lat. 39022'39" N.• long. 94°46'50" W., in SEt NWt sec. 25,<br />
T. 53 N., R. 35 W. > at bridge Oll Interstate Highway 29, 0.5 mile<br />
north <strong>of</strong> Platte City.<br />
Drainage area.-- 2,400 sq mi (from Corps <strong>of</strong> Engineers).<br />
Discharge record.--Contracted opening at two bridges with flow over<br />
road measurement at 114,000 cfs_<br />
Haximum.--July 18-23, 1965: Discharge, 114,000 cis July 20.<br />
81
34 Fishing River at Miltondale<br />
Q1iscellaneous site)<br />
Location.--Lat. 39°16'00" N., long. 94°13'19" W., in SW\ sec. 36, T.<br />
52 N., R. 30 W., at bridge on County Highway N, 0.5 mile north <strong>of</strong><br />
Hiltondale and 4 miles south <strong>of</strong> Excelsior Springs.<br />
Drainage area.--238 sq mi. (from Corps <strong>of</strong> Engineers).<br />
Discharge record.--Contracted opening at two bridges with flow over<br />
road measurement at 80,200 cfs.<br />
Haxima.--July 18-23, 1965: Discharge, 80,200 cfs July 20.<br />
1947: Discharge, 32,000 cfs June 22. (Slope-area measurement by<br />
Corps <strong>of</strong> Engineers.)<br />
CROOKED RIVER BASIN<br />
35 (6-8950) Crooked River near Richmond<br />
Location.-- Lat. 39°20' N., long. 93°59' W., in l>"W\ sec. 7, T. 52 N.,<br />
R. 27 W., on downstream side <strong>of</strong> third pier from left end <strong>of</strong> bridge<br />
on State Highway 13, 4 miles north <strong>of</strong> Richmond, 8% miles upstream<br />
from West Fork Crooked River and 24% miles upstream from mouth.<br />
Drainage area.--159 sq mi.<br />
Gage-height record.--Water-stage recorder graph. Datum <strong>of</strong> gage is<br />
706.34 ft above mean sea level, datum <strong>of</strong> 1929.<br />
Discharge record.--Stage-discharge relation defined by current-meter<br />
measurements.<br />
Maxima.--Ju1y 18-23, 1965: Discharge, 29,000 cfs 0200 July 20<br />
(gage height, 30.70 ft).<br />
1948 to July 18, 1965: Discharge, 27,000 cis July 6, 1951<br />
(gage height, 28.8 ft, from floodmark).<br />
B9
94<br />
SEl..ECn:U STATIONS IN GRAND RIVER BASIN<br />
38 (6-8967) O'Neill Branch at Osborn<br />
(Crest-stage st8tion)<br />
Location.--Lat. 39°45'25" N.• long. 94020'35" W.• in swt NEt sec. 14,<br />
T. 57 N., R. 31 W., on left bank just upstream from culvert under<br />
U. S. Highway 36, 1 mile northeast <strong>of</strong> Osborn and 5.5 miles northwest<br />
<strong>of</strong> Cameron.<br />
Drainage area.--O.80 sq mi.<br />
Gage-height record.--Crest stages only. Arbitrary datum assigned to<br />
gage.<br />
Discharge record.--Stage-discharge relation defined by culvert flow<br />
measurements at 146. 239, 427, and 1.320 efs.<br />
Maxima.--July 18-23, 1965: Discharge, 510 cfs July 19 (gage height,<br />
18.28 ft).<br />
1955-65: Discharge, 1,320 efs July 3D, 1958 (gage height, 24.20 ft).<br />
39 ShOal Creek near Turney<br />
(Miscellaneous site)<br />
Locarion.--Lat. 39°38'15" N., long. 94°16'50" W., in swt NWt sec. 28,<br />
T. 56 N., R. 30 W., at bridge on County Highway H, 2.0 miles east<br />
<strong>of</strong> Turney.<br />
Drainage area.--23.3 sq mi.<br />
Discharge record.--Contracted opening with culvert flow and flow over<br />
road measurement at 9,640 cfs.<br />
Haxlmum.--Ju1y 18-23, 1965: Discharge, 9,640 cfs July 19.
96<br />
SELECTED STATIONS IN L\HINE RIVER BASIN<br />
41 (6-9075) South Fork Blackwater River near Elm<br />
Location.--Lat. 38°49'05" N., long. 94°02'05" W., in SW\: SE\ sec. 5,<br />
r. 46 N.• R. 28 W., on left bank at downstream side <strong>of</strong> bridge on<br />
county highway, 2% miles southeast <strong>of</strong> Elm Bnd 3 miles upstream<br />
from mouth.<br />
Drainage arca.--16.4 sq mi.<br />
Gage-height record.--Water-stage recorder graph. Datum <strong>of</strong> gage is<br />
about 795 ft above mean sea level, datum <strong>of</strong> 1929.<br />
Discharge record.--Stsge-discharge relation defined by current-meter<br />
measurements below 600 cfs and by contracted opening with Clow over<br />
road measurement at 5,600 cfs.<br />
Maxlma.--July 18-23, 1965: Discharge, 4,610 cfs 2245 July 19 (gage<br />
height, 11.12 ft).<br />
1951: July flood reached a stage <strong>of</strong> 14.8 ft, from information<br />
by local residents,<br />
1954-65: Discharge, 5,600 ds Apr. 15, 1960 (gage height, 12.0 ft).<br />
Remarks.--Run<strong>of</strong>f affected at times by many soil conservation ponds upstream.
LOO<br />
MISSOURI RIVER BAIN STEM<br />
44 (6-9090) <strong>Missouri</strong> River at Boonville<br />
Location.--Lat. 38°58'40" N., long. 92°45'15" W., 1n sec. 35, T. 49 N., R. 17 W., on<br />
downstream side <strong>of</strong> second pier from right abutment <strong>of</strong> <strong>Missouri</strong>-Kansas-Texas Co.<br />
bridge at Boonville. River mile, 196.6.<br />
Drainage area.--50S,700 sq mi.<br />
Gage-height record.--Water-srage recorder graph. Datum <strong>of</strong> gage is 565.42 ft above mean<br />
sea level, datum <strong>of</strong> 1929.<br />
Discharge record.--Stage-discharge relation defined by current-meter measurements.<br />
Haxima.--July 18-23, 1965: Di.scharge, 253,000 cfs 1300 July 23 (gage height, 26.05 ft).<br />
1844: Flood <strong>of</strong> June 21 reached a stage <strong>of</strong> 32.7 Ct (discharge, about 710,000 efs,<br />
computed by Corps <strong>of</strong> Engineers).<br />
1903: Flood <strong>of</strong> June 6 reached a stage <strong>of</strong> 30.5 ft (discharge, about 612,000 cfs,<br />
computed by Corps <strong>of</strong> Engineers).<br />
1925-65: Discharge, 550,000 cfs July 17, 1951; gage height, 32.82 it July 17, 1951.<br />
Remarks.--Flow partly regulated by many reservoirs above station.<br />
Gage height and discharge at indicated time, 1965<br />
Gage Gage<br />
Time height Discharge Time height Dischsrge<br />
(feet) (cfs)' (feet) (cfs)-<br />
July l8 2400 12.97 71,800 July 23 1300 26.05 253,000<br />
July 19 1200 13.44 76,300 1800 25.85 250,000<br />
1800 13.92 80,500 2400 25.62 246,000<br />
2400 15.15 93,400 July 24 1200 24.37 222,000<br />
July 20 1200 18.45 134,000 2400 22.37 191,000<br />
2400 21.48 176,000 July 25 l200 20.35 158,000<br />
July 21 1200 23.56 211,000 2400 18.70 13&,000<br />
2400 24.56 227,000 July 26 1200 17.33 116,000<br />
July 22 1200 25.25 241,000 2400 1&.38 105,000<br />
2400 25.85 251,000 July 27 l200 15.35 94,000<br />
July 2J 0600 26.00 252,000 2400 14.55 85,500<br />
1200 26.03 253,000