1 Evolución de la ganancia media anual y percentiles según sexo CNAE-2009
Exportar a PDF
Exportar a PDF

Create successful ePaper yourself
Turn your PDF publications into a flip-book with our unique Google optimized e-Paper software.
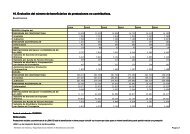
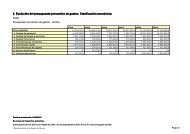
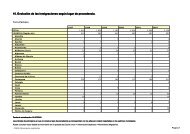
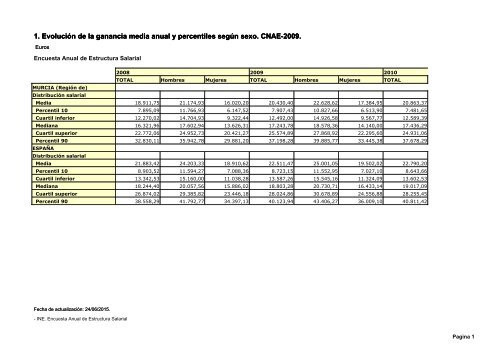
1. <strong>Evolución</strong> <strong>de</strong> <strong>la</strong> <strong>ganancia</strong> <strong>media</strong> <strong>anual</strong> y <strong>percentiles</strong> <strong>según</strong> <strong>sexo</strong>. <strong>CNAE</strong>-<strong>2009</strong>.<br />
Euros<br />
Encuesta Anual <strong>de</strong> Estructura Sa<strong>la</strong>rial<br />
2008 <strong>2009</strong> 2010<br />
TOTAL Hombres Mujeres TOTAL Hombres Mujeres TOTAL<br />
MURCIA (Región <strong>de</strong>)<br />
Distribución sa<strong>la</strong>rial<br />
Media 18.911,75 21.174,93 16.020,20 20.430,40 22.628,62 17.384,95 20.863,37<br />
Percentil 10 7.895,09 11.766,93 6.147,52 7.907,43 10.827,66 6.513,90 7.481,65<br />
Cuartil inferior 12.270,02 14.704,93 9.322,44 12.492,00 14.926,58 9.567,77 12.589,39<br />
Mediana 16.321,96 17.602,94 13.626,31 17.243,78 18.578,36 14.140,00 17.436,29<br />
Cuartil superior 22.772,06 24.952,73 20.421,27 25.574,89 27.868,92 22.295,60 24.931,06<br />
Percentil 90 32.830,11 35.942,78 29.881,20 37.198,28 39.885,77 33.445,38 37.678,29<br />
ESPAÑA<br />
Distribución sa<strong>la</strong>rial<br />
Media 21.883,42 24.203,33 18.910,62 22.511,47 25.001,05 19.502,02 22.790,20<br />
Percentil 10 8.903,52 11.594,27 7.088,36 8.723,15 11.552,95 7.027,10 8.643,66<br />
Cuartil inferior 13.342,53 15.160,00 11.038,28 13.587,26 15.545,16 11.324,09 13.602,53<br />
Mediana 18.244,40 20.057,56 15.886,02 18.803,28 20.730,71 16.433,14 19.017,09<br />
Cuartil superior 26.874,02 29.385,82 23.446,18 28.024,86 30.678,89 24.556,88 28.255,45<br />
Percentil 90 38.558,29 41.792,77 34.397,13 40.123,94 43.406,27 36.009,10 40.811,42<br />
Fecha <strong>de</strong> actualización: 24/06/2015.<br />
- INE. Encuesta Anual <strong>de</strong> Estructura Sa<strong>la</strong>rial<br />
Pagina 1
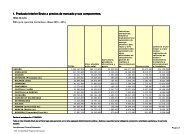
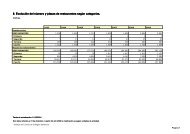
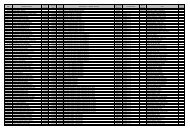
1. <strong>Evolución</strong> <strong>de</strong> <strong>la</strong> <strong>ganancia</strong> <strong>media</strong> <strong>anual</strong> y <strong>percentiles</strong> <strong>según</strong> <strong>sexo</strong>. <strong>CNAE</strong>-<strong>2009</strong>.<br />
Euros<br />
Encuesta Anual <strong>de</strong> Estructura Sa<strong>la</strong>rial<br />
2010 2011 2012<br />
Hombres Mujeres TOTAL Hombres Mujeres TOTAL Hombres<br />
MURCIA (Región <strong>de</strong>)<br />
Distribución sa<strong>la</strong>rial<br />
Media<br />
23.482,48 17.838,28 21.077,49 23.460,47 18.053,61 20.682,01 23.487,03<br />
Percentil 10<br />
11.644,60 5.976,39 7.689,32 10.436,28 5.990,53 6.926,64 10.310,04<br />
Cuartil inferior<br />
14.977,48 10.212,36 12.531,12 14.720,77 10.189,79 12.444,96 14.909,50<br />
Mediana<br />
19.343,50 14.562,50 17.783,88 19.155,10 15.296,02 17.650,50 19.258,53<br />
Cuartil superior<br />
27.926,66 21.813,52 25.639,05 28.056,39 22.910,49 25.376,92 27.938,72<br />
Percentil 90<br />
40.975,94 32.576,81 37.830,95 41.880,92 32.153,26 37.008,77 41.725,21<br />
ESPAÑA<br />
Distribución sa<strong>la</strong>rial<br />
Media<br />
25.479,74 19.735,22 22.899,35 25.667,89 19.767,59 22.726,44 25.682,05<br />
Percentil 10<br />
11.391,44 7.001,27 8.402,15 10.973,96 6.996,22 7.979,40 10.552,80<br />
Cuartil inferior<br />
15.770,16 11.462,43 13.553,97 15.718,40 11.376,86 13.369,45 15.705,88<br />
Mediana<br />
21.206,99 16.536,10 19.303,51 21.487,99 16.796,41 19.040,98 21.425,14<br />
Cuartil superior<br />
31.164,24 24.751,72 28.658,66 31.874,98 25.038,56 28.395,50 31.866,94<br />
Percentil 90<br />
44.725,21 36.249,13 40.680,54 44.848,03 35.871,36 40.807,99 45.494,89<br />
Fecha <strong>de</strong> actualización: 24/06/2015.<br />
- INE. Encuesta Anual <strong>de</strong> Estructura Sa<strong>la</strong>rial<br />
Pagina 2
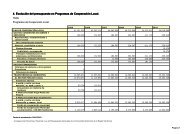
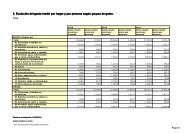
1. <strong>Evolución</strong> <strong>de</strong> <strong>la</strong> <strong>ganancia</strong> <strong>media</strong> <strong>anual</strong> y <strong>percentiles</strong> <strong>según</strong> <strong>sexo</strong>. <strong>CNAE</strong>-<strong>2009</strong>.<br />
Euros<br />
Encuesta Anual <strong>de</strong> Estructura Sa<strong>la</strong>rial<br />
2012 2013<br />
Mujeres TOTAL Hombres Mujeres<br />
MURCIA (Región <strong>de</strong>)<br />
Distribución sa<strong>la</strong>rial<br />
Media<br />
17.457,52 20.449,83 23.428,23 16.957,29<br />
Percentil 10<br />
5.704,52 6.788,11 10.262,52 5.368,82<br />
Cuartil inferior<br />
9.589,28 11.717,17 14.757,89 9.034,00<br />
Mediana<br />
14.781,92 17.401,72 19.430,90 14.055,89<br />
Cuartil superior<br />
22.360,07 24.994,32 27.694,77 21.962,41<br />
Percentil 90<br />
31.905,82 37.364,14 40.841,35 31.746,83<br />
ESPAÑA<br />
Distribución sa<strong>la</strong>rial<br />
Media<br />
19.537,33 22.697,86 25.675,17 19.514,58<br />
Percentil 10<br />
6.750,12 7.692,30 10.020,04 6.457,78<br />
Cuartil inferior<br />
11.153,94 13.039,36 15.555,04 10.801,94<br />
Mediana<br />
16.524,51 19.029,66 21.371,13 16.452,43<br />
Cuartil superior<br />
24.505,75 28.563,69 32.114,80 24.568,84<br />
Percentil 90<br />
35.506,25 41.108,40 45.516,20 36.068,77<br />
Fecha <strong>de</strong> actualización: 24/06/2015.<br />
- INE. Encuesta Anual <strong>de</strong> Estructura Sa<strong>la</strong>rial<br />
Pagina 3