1 Evolución del comercio exterior de la Región de Murcia y España
Exportar a PDF
Exportar a PDF

Create successful ePaper yourself
Turn your PDF publications into a flip-book with our unique Google optimized e-Paper software.
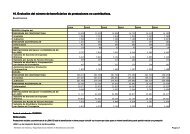
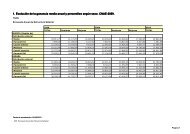
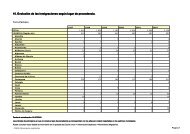
1. <strong>Evolución</strong> <strong><strong>de</strong>l</strong> <strong>comercio</strong> <strong>exterior</strong> <strong>de</strong> <strong>la</strong> <strong>Región</strong> <strong>de</strong> <strong>Murcia</strong> y <strong>España</strong><br />
TOTAL<br />
<strong>Región</strong> <strong>de</strong> <strong>Murcia</strong><br />
Importaciones en euros<br />
Exportaciones en euros<br />
Saldo comercial en euros<br />
Tasa <strong>de</strong> cobertura en %<br />
<strong>España</strong><br />
Importaciones en euros<br />
Exportaciones en euros<br />
Saldo comercial en euros<br />
Tasa <strong>de</strong> cobertura en %<br />
1999 1998 1997 1996<br />
2.083.469.882,49 1.857.712.993,52 1.727.940.646,55 1.465.502.840,29<br />
2.698.910.139,52 2.542.959.136,83 2.223.711.210,49 1.913.071.945,32<br />
615.440.257,03 685.246.143,31 495.770.563,94 447.569.105,03<br />
129,54 136,89 128,69 130,54<br />
139.093.706.121,89 122.856.109.634,20 109.458.733.416,84 94.179.479.707,18<br />
104.788.627.189,15 99.849.457.798,87 93.411.707.563,31 78.212.098.695,86<br />
-34.305.078.932,74 -23.006.651.835,33 -16.047.025.853,53 -15.967.381.011,32<br />
75,34 81,27 85,34 83,05<br />
Fecha <strong>de</strong> actualización: 19/02/2015.<br />
Los datos <strong>de</strong> 2014 son provisionales<br />
- CREM. Comercio con el Extranjero<br />
Pagina 4