1 Evolución del comercio exterior de la Región de Murcia y España
Exportar a PDF
Exportar a PDF

You also want an ePaper? Increase the reach of your titles
YUMPU automatically turns print PDFs into web optimized ePapers that Google loves.
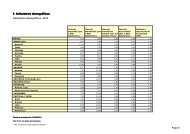
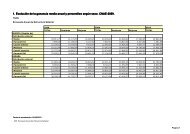
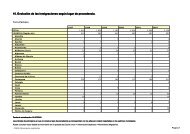
1. <strong>Evolución</strong> <strong><strong>de</strong>l</strong> <strong>comercio</strong> <strong>exterior</strong> <strong>de</strong> <strong>la</strong> <strong>Región</strong> <strong>de</strong> <strong>Murcia</strong> y <strong>España</strong><br />
TOTAL<br />
<strong>Región</strong> <strong>de</strong> <strong>Murcia</strong><br />
Importaciones en euros<br />
Exportaciones en euros<br />
Saldo comercial en euros<br />
Tasa <strong>de</strong> cobertura en %<br />
<strong>España</strong><br />
Importaciones en euros<br />
Exportaciones en euros<br />
Saldo comercial en euros<br />
Tasa <strong>de</strong> cobertura en %<br />
2009 2008 2007 2006 2005<br />
6.433.404.306,82 10.287.378.320,37 8.924.259.735,56 8.523.108.993,42 8.143.637.178,25<br />
4.367.986.726,16 4.588.275.739,48 4.410.864.681,45 4.159.879.317,54 3.990.038.110,26<br />
-2.065.417.580,66 -5.699.102.580,89 -4.513.395.054,11 -4.363.229.675,88 -4.153.599.067,99<br />
67,90 44,60 49,43 48,81 49,00<br />
206.116.174.511,43 283.387.764.359,93 285.038.313.419,82 262.687.189.491,38 232.954.465.764,67<br />
159.889.550.154,50 189.227.851.407,26 185.023.217.517,84 170.438.626.905,20 155.004.733.950,63<br />
-46.226.624.356,93 -94.159.912.952,67 -100.015.095.901,98 -92.248.562.586,18 -77.949.731.814,04<br />
77,57 66,77 64,91 64,88 66,54<br />
Fecha <strong>de</strong> actualización: 19/02/2015.<br />
Los datos <strong>de</strong> 2014 son provisionales<br />
- CREM. Comercio con el Extranjero<br />
Pagina 2