1 Evolución del comercio exterior de la Región de Murcia y España
Exportar a PDF
Exportar a PDF

You also want an ePaper? Increase the reach of your titles
YUMPU automatically turns print PDFs into web optimized ePapers that Google loves.
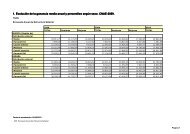
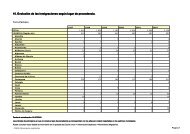
1. <strong>Evolución</strong> <strong><strong>de</strong>l</strong> <strong>comercio</strong> <strong>exterior</strong> <strong>de</strong> <strong>la</strong> <strong>Región</strong> <strong>de</strong> <strong>Murcia</strong> y <strong>España</strong><br />
TOTAL<br />
2014 2013 2012 2011 2010<br />
<strong>Región</strong> <strong>de</strong> <strong>Murcia</strong><br />
Importaciones en euros 12.134.157.065,98 11.919.046.814,71 12.704.990.171,46 10.303.579.576,12 7.543.245.336,99<br />
Exportaciones en euros 10.377.331.216,72 9.353.671.572,71 8.956.379.092,90 5.470.595.542,19 4.994.940.639,60<br />
Saldo comercial en euros -1.756.825.849,26 -2.565.375.242,00 -3.748.611.078,56 -4.832.984.033,93 -2.548.304.697,39<br />
Tasa <strong>de</strong> cobertura en % 85,52 78,48 70,49 53,09 66,22<br />
<strong>España</strong><br />
Importaciones en euros 264.506.725.942,89 252.346.775.229,48 257.945.631.014,09 263.140.740.648,54 240.055.850.103,00<br />
Exportaciones en euros 240.034.871.680,17 235.814.069.043,58 226.114.593.974,27 215.230.370.709,55 186.780.070.554,00<br />
Saldo comercial en euros -24.471.854.262,72 -16.532.706.185,90 -31.831.037.039,82 -47.910.369.938,99 -53.275.779.549,00<br />
Tasa <strong>de</strong> cobertura en % 90,75 93,45 87,66 81,79 77,81<br />
Fecha <strong>de</strong> actualización: 19/02/2015.<br />
Los datos <strong>de</strong> 2014 son provisionales<br />
- CREM. Comercio con el Extranjero<br />
Pagina 1
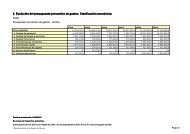
1. <strong>Evolución</strong> <strong><strong>de</strong>l</strong> <strong>comercio</strong> <strong>exterior</strong> <strong>de</strong> <strong>la</strong> <strong>Región</strong> <strong>de</strong> <strong>Murcia</strong> y <strong>España</strong><br />
TOTAL<br />
<strong>Región</strong> <strong>de</strong> <strong>Murcia</strong><br />
Importaciones en euros<br />
Exportaciones en euros<br />
Saldo comercial en euros<br />
Tasa <strong>de</strong> cobertura en %<br />
<strong>España</strong><br />
Importaciones en euros<br />
Exportaciones en euros<br />
Saldo comercial en euros<br />
Tasa <strong>de</strong> cobertura en %<br />
2009 2008 2007 2006 2005<br />
6.433.404.306,82 10.287.378.320,37 8.924.259.735,56 8.523.108.993,42 8.143.637.178,25<br />
4.367.986.726,16 4.588.275.739,48 4.410.864.681,45 4.159.879.317,54 3.990.038.110,26<br />
-2.065.417.580,66 -5.699.102.580,89 -4.513.395.054,11 -4.363.229.675,88 -4.153.599.067,99<br />
67,90 44,60 49,43 48,81 49,00<br />
206.116.174.511,43 283.387.764.359,93 285.038.313.419,82 262.687.189.491,38 232.954.465.764,67<br />
159.889.550.154,50 189.227.851.407,26 185.023.217.517,84 170.438.626.905,20 155.004.733.950,63<br />
-46.226.624.356,93 -94.159.912.952,67 -100.015.095.901,98 -92.248.562.586,18 -77.949.731.814,04<br />
77,57 66,77 64,91 64,88 66,54<br />
Fecha <strong>de</strong> actualización: 19/02/2015.<br />
Los datos <strong>de</strong> 2014 son provisionales<br />
- CREM. Comercio con el Extranjero<br />
Pagina 2
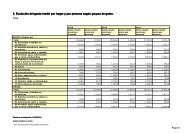
1. <strong>Evolución</strong> <strong><strong>de</strong>l</strong> <strong>comercio</strong> <strong>exterior</strong> <strong>de</strong> <strong>la</strong> <strong>Región</strong> <strong>de</strong> <strong>Murcia</strong> y <strong>España</strong><br />
TOTAL<br />
<strong>Región</strong> <strong>de</strong> <strong>Murcia</strong><br />
Importaciones en euros<br />
Exportaciones en euros<br />
Saldo comercial en euros<br />
Tasa <strong>de</strong> cobertura en %<br />
<strong>España</strong><br />
Importaciones en euros<br />
Exportaciones en euros<br />
Saldo comercial en euros<br />
Tasa <strong>de</strong> cobertura en %<br />
2004 2003 2002 2001 2000<br />
6.084.405.553,01 4.951.139.258,10 4.841.840.435,19 4.390.514.077,01 4.079.605.120,13<br />
3.893.411.384,39 4.031.827.861,90 3.869.710.681,49 3.582.803.048,58 3.193.039.403,93<br />
-2.190.994.168,62 -919.311.396,20 -972.129.753,70 -807.711.028,43 -886.565.716,20<br />
63,99 81,43 79,92 81,60 78,27<br />
208.410.703.586,49 185.113.677.048,41 175.267.866.173,18 173.210.117.182,79 169.468.101.404,50<br />
146.924.722.492,68 138.119.046.687,97 133.267.677.736,83 129.771.012.807,74 124.177.336.047,94<br />
-61.485.981.093,81 -46.994.630.360,44 -42.000.188.436,35 -43.439.104.375,05 -45.290.765.356,56<br />
70,50 74,61 76,04 74,92 73,27<br />
Fecha <strong>de</strong> actualización: 19/02/2015.<br />
Los datos <strong>de</strong> 2014 son provisionales<br />
- CREM. Comercio con el Extranjero<br />
Pagina 3
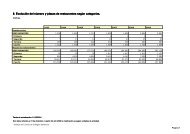
1. <strong>Evolución</strong> <strong><strong>de</strong>l</strong> <strong>comercio</strong> <strong>exterior</strong> <strong>de</strong> <strong>la</strong> <strong>Región</strong> <strong>de</strong> <strong>Murcia</strong> y <strong>España</strong><br />
TOTAL<br />
<strong>Región</strong> <strong>de</strong> <strong>Murcia</strong><br />
Importaciones en euros<br />
Exportaciones en euros<br />
Saldo comercial en euros<br />
Tasa <strong>de</strong> cobertura en %<br />
<strong>España</strong><br />
Importaciones en euros<br />
Exportaciones en euros<br />
Saldo comercial en euros<br />
Tasa <strong>de</strong> cobertura en %<br />
1999 1998 1997 1996<br />
2.083.469.882,49 1.857.712.993,52 1.727.940.646,55 1.465.502.840,29<br />
2.698.910.139,52 2.542.959.136,83 2.223.711.210,49 1.913.071.945,32<br />
615.440.257,03 685.246.143,31 495.770.563,94 447.569.105,03<br />
129,54 136,89 128,69 130,54<br />
139.093.706.121,89 122.856.109.634,20 109.458.733.416,84 94.179.479.707,18<br />
104.788.627.189,15 99.849.457.798,87 93.411.707.563,31 78.212.098.695,86<br />
-34.305.078.932,74 -23.006.651.835,33 -16.047.025.853,53 -15.967.381.011,32<br />
75,34 81,27 85,34 83,05<br />
Fecha <strong>de</strong> actualización: 19/02/2015.<br />
Los datos <strong>de</strong> 2014 son provisionales<br />
- CREM. Comercio con el Extranjero<br />
Pagina 4