Isotherms of Dipalmitoylphosphatidylcholine (DPPC) Monolayers ...
Isotherms of Dipalmitoylphosphatidylcholine (DPPC) Monolayers ...
Isotherms of Dipalmitoylphosphatidylcholine (DPPC) Monolayers ...

You also want an ePaper? Increase the reach of your titles
YUMPU automatically turns print PDFs into web optimized ePapers that Google loves.
JOURNAL OF COLLOID AND INTERFACE SCIENCE 182, 220–229 (1996)<br />
ARTICLE NO. 0454<br />
<strong>Isotherms</strong> <strong>of</strong> <strong>Dipalmitoylphosphatidylcholine</strong> (<strong>DPPC</strong>) <strong>Monolayers</strong>:<br />
Features Revealed and Features Obscured<br />
K. J. KLOPFER AND T. K. VANDERLICK 1<br />
University <strong>of</strong> Pennsylvania, Department <strong>of</strong> Chemical Engineering, 220 South 33rd Street, Philadelphia, Pennsylvania 19104-6393<br />
Received December 12, 1995; accepted March 28, 1996<br />
Valuable as they are, isotherms may display features that<br />
Pressure–area isotherms <strong>of</strong> dipalmitoylphosphatidylcholine<br />
(<strong>DPPC</strong>) exhibit a two-phase region wherein domains <strong>of</strong> a liquidcondensed<br />
(LC) phase are dispersed in the less ordered liquid-<br />
expanded (LE) phase. Fluorescence microscopy has been used<br />
over the past years to visualize the shapes displayed by <strong>DPPC</strong><br />
domains throughout the coexistence region; characteristic domain<br />
shapes include those resembling dimpled beans and S-like figures.<br />
In this paper we show that the types and distributions <strong>of</strong> domain<br />
are difficult to interpret, or may even be featureless under<br />
conditions where interesting things are happening. For example,<br />
the nonhorizontal nature <strong>of</strong> the plateau exhibited in the<br />
isotherms <strong>of</strong> many lipid monolayers (corresponding to the<br />
liquid-expanded (LE)/liquid-condensed (LC) phase transi-<br />
tion) has remained cause for debate for over 25 years. Thus<br />
additional techniques are <strong>of</strong>ten called upon to resolve or<br />
shapes formed throughout the coexistence region depend sensi-<br />
further probe the state <strong>of</strong> monolayer films. One technique<br />
tively on the rate <strong>of</strong> monolayer compression. Additionally, by com- that has unveiled many intriguing monolayer properties is<br />
paring the relative proportion <strong>of</strong> LE and LC phases observed to fluorescence microscopy, which allows visualization <strong>of</strong> cothat<br />
which is predicted by the isotherm, we find apparent violations<br />
<strong>of</strong> the lever rule. Most importantly, we find that if the monolayer<br />
is allowed to age in a state <strong>of</strong> two-phase coexistence for<br />
long times (approx. 12 h), the <strong>DPPC</strong> domains all become nearly<br />
circular. Finally, isotherms generated by compressing very slowly,<br />
or those generated at quick speeds but only after the film was left<br />
stagnant for a few hours, are markedly different from isotherms<br />
produced if the film was compressed within an hour after it was<br />
spread. One likely explanation for this behavior is the accumula-<br />
existing phases. Not only did use <strong>of</strong> this technique confirm<br />
the presence <strong>of</strong> two coexisting phases within the lipid LE/<br />
LC plateau regime (6, 7), but pictures revealed the forma-<br />
tion <strong>of</strong> domains (<strong>of</strong> the LC phase) with fascinating morphol-<br />
ogies (8, 9). Shapes and sizes <strong>of</strong> monolayer domains have<br />
since been shown to depend on many variables such as chi-<br />
rality <strong>of</strong> the molecules (10), temperature (11), and subphase<br />
pH (12). Domain growth and form have also been investi-<br />
tion <strong>of</strong> air-borne impurities. � 1996 Academic Press, Inc.<br />
gated by Brewster angle microscopy (13, 14), which obvi-<br />
Key Words: compression speed; domain shapes; impurities. ates the need to add a fluorescent probe to the system. This<br />
technique has been especially useful for imaging intradomain<br />
textures (15, 16) as well as domain shapes. Theories<br />
INTRODUCTION <strong>of</strong> domain shapes have been developed which rationalize<br />
shapes in terms <strong>of</strong> a competition between line tension (fa-<br />
The workhorse <strong>of</strong> insoluble monolayer investigations is voring compact circular shapes) and electrostatic dipole efthe<br />
Langmuir trough, which is used to generate pressure– fects (which favor extended shapes) (17–24).<br />
area isotherms. An isotherm is one <strong>of</strong> the most fundamental One particular monolayer system that has received much<br />
characteristics <strong>of</strong> a monolayer system, and the analysis and attention over the years (especially in laboratories housed<br />
interpretation <strong>of</strong> isotherms provide an easy route to learn with fluorescence microscopes) is the phospholipid dipalmiabout<br />
the state <strong>of</strong> the monolayer. In this regard, the shapes toylphosphatidylcholine (<strong>DPPC</strong>). <strong>DPPC</strong> is prominent in the<br />
<strong>of</strong> isotherms, <strong>of</strong>ten fraught with kinks and plateaus, are ex- lipid bilayer making up the cell membrane and is also a<br />
tremely valuable road maps for hunting down phase and major constituent <strong>of</strong> lung surfactant. One <strong>of</strong> the first systems<br />
ordering transitions experienced by the monomolecular film. visualized with fluorescence microscopy was, in fact, <strong>DPPC</strong><br />
Long ago, Stallberg-Stenhagen and Stenhagen (1) made the (7). Given the quantity <strong>of</strong> attention directed at this system,<br />
most <strong>of</strong> this opportunity to postulate the many phases <strong>of</strong> <strong>DPPC</strong> monolayers are considered to be relatively well charfatty<br />
acid monolayers, results more recently confirmed by acterized. In fact most newcomers to the field <strong>of</strong>ten choose<br />
several other researchers using isotherm analysis as well as to start by reproducing <strong>DPPC</strong> isotherms and viewing the<br />
other more direct techniques (2–5). ‘‘characteristic’’ <strong>DPPC</strong> shapes. Perusal <strong>of</strong> the literature leads<br />
to the following portrayal <strong>of</strong> <strong>DPPC</strong> domain nucleation and<br />
1 To whom correspondence should be addressed. growth: As long as the film is compressed over ranges <strong>of</strong><br />
0021-9797/96 $18.00<br />
Copyright � 1996 by Academic Press, Inc.<br />
All rights <strong>of</strong> reproduction in any form reserved.<br />
220
ISOTHERMS OF <strong>DPPC</strong> MONOLAYERS<br />
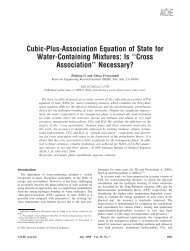
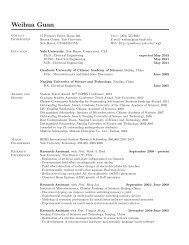
FIG. 1. Characteristic <strong>DPPC</strong> domain shapes: (a) beans (p Å 3.8 mN/m, A Å 72.7 A˚ 2 /molecule); (b) S shapes (p Å 3.9 mN/m, A Å 69.5 A˚ 2 /<br />
molecule); (c) multilobes (p Å 4.1 mN/m, A Å 53.5 A˚ 2 /molecule); (d) circles (aged for 10 h, A Å 53.5 A˚ 2 /molecule). Scale, 1.5 cm Å 27 mm.<br />
speed that are generally considered slow (literature values<br />
range from 0.2 to 8.0 A˚<br />
In this paper, we show that the behavior <strong>of</strong> <strong>DPPC</strong> monolayers<br />
is much more subtle than the general picture painted<br />
2 /moleculermin (7, 11, 25–27))<br />
and not prone to domain growth resulting from diffusion- above. We show, for example, that the types and proportions<br />
limited aggregation (28–30), the domains are nucleated in <strong>of</strong> domain shapes are very sensitive to compression speed.<br />
the form <strong>of</strong> bean-like shapes (from here on referred to as Even more important, however, we find that if the monolayer<br />
beans) and growth progresses from beans to shapes having is maintained in a state <strong>of</strong> two-phase coexistence for long<br />
an S-like appearance and finally culminates in multilobe times (over 12 h), then the <strong>DPPC</strong> domains all become nearly<br />
shapes (showing three or four appendages). Examples <strong>of</strong> circular. Using the <strong>DPPC</strong> isotherm to estimate the fraction<br />
each <strong>of</strong> these shapes, taken under our microscope, are shown <strong>of</strong> LC phase that should be present at a given area, we<br />
in Figs. 1a–1c. Florsheimer and Möhwald have proposed also find an apparent violation <strong>of</strong> the lever rule, with less<br />
that the more complicated S-like and multilobe shapes are condensed phase observed than that predicted. This violation<br />
simply fused combinations <strong>of</strong> beans (11). While they make is not apparent when the film is aged and circular domains<br />
an excellent case for this mechanism, this proposal has not are formed. Finally, while fluorescence microscopy reveals<br />
been substantiated by other researchers.<br />
that domains relax eventually (over many hours) to circular<br />
221
222 KLOPFER AND VANDERLICK<br />
shapes, the images show no obvious signs <strong>of</strong> perturbations<br />
or microstructural changes in the monolayer film. On the<br />
other hand, isotherms generated by compressing very slowly<br />
(0.19 A˚ 2 /moleculermin), or those generated at quick speeds<br />
but only after the film was left stagnant for a few hours, are<br />
markedly different from isotherms produced if the film is<br />
compressed within an hour after it is spread. One likely<br />
explanation for this behavior is accumulation <strong>of</strong> impurities;<br />
we present evidence that these may be air-borne, and we<br />
use the measured variation in isotherms to estimate the level<br />
<strong>of</strong> possible contamination.<br />
EXPERIMENTAL<br />
L-a-1,2-Dipalmitoyl-sn-glycerophosphocholine (<strong>DPPC</strong>,<br />
ú99%, Avanti Polar Lipids, Birmingham, AL) and<br />
1 - palmitoyl-2-[6 [(7-nitro-2-1,3-benzoxadiazol-4-yl)<br />
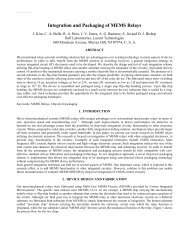
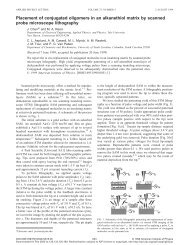
amino]caproyl]-sn-glycero-3-phosphocholine (C6-NBD- FIG. 2. p– A isotherms for <strong>DPPC</strong> at 19.5�C: (a) compression speed <strong>of</strong><br />
2.57 A˚ 2 /molecule min or 0.91 A˚ 2 <strong>DPPC</strong>, ú99%, Avanti Polar Lipids) were used without<br />
/molecule min; (b) compression speed<br />
<strong>of</strong> 0.19 A˚ 2 further purification. Unless otherwise noted, chlor<strong>of</strong>orm<br />
(Fisher, HPLC grade) was used as a spreading solvent for<br />
/molecule min.<br />
all lipid solutions. Millipore water (18.3 MV-cm resistivity)<br />
was used as a subphase in isotherm measurements.<br />
All experiments were performed at 19.5�C.<br />
Isothermal compressions (p– A curves) <strong>of</strong> <strong>DPPC</strong> were<br />
performed on two different commercial film balances. The<br />
first was a film balance (KSV 5000, Finland) with a surface<br />
area <strong>of</strong> 707 cm<br />
probes were excited using a 100-W OSRAM HBO W/2 Hg<br />
lamp.<br />
The microscope and film balance were placed on an antivibration<br />
isolation table (JRS, Switzerland). The Plexiglass<br />
enclosure reduces the influence <strong>of</strong> air currents, thus helping<br />
to abate unwanted domain travel as well as inhibiting sub-<br />
2 . The film balance used for fluorescence<br />
microscopy experiments (R & K Ultrathin Organic Film<br />
Technology RK1, Germany) had a surface area <strong>of</strong> 144 cm<br />
phase evaporation. Typically, barriers were allowed to com-<br />
press the monolayer to the requisite surface pressure and<br />
2 .<br />
Both film balances were equipped with a Wilhelmy plate to<br />
monitor surface pressure. Although our balances read out to<br />
0.01 mN/m, we estimate the sensitivity to be about 0.03<br />
mN/m. We used plates made <strong>of</strong> either platinum or filter<br />
paper (with no significant differences noted between them).<br />
<strong>Monolayers</strong> were spread from lipid solutions in chlor<strong>of</strong>orm.<br />
then stopped. The video taping <strong>of</strong> domains was carried out<br />
when the barriers were at rest. This reduces (but does not<br />
stop) the convection <strong>of</strong> the water subphase and vibrations,<br />
which allows for better image quality. At times we also<br />
placed a glass filter in the bottom <strong>of</strong> the film balance to<br />
reduce the water depth and hence the water convection.<br />
Compression speeds and the time allowed before compression<br />
were varied as part <strong>of</strong> the analysis in this paper.<br />
Video-enhanced fluorescence microscopy was conducted<br />
FEATURES OBSCURED: CHARACTERISTICS AND<br />
STABILITY OF OBSERVED DOMAIN SHAPES<br />
with the smaller balance placed on the stage <strong>of</strong> an epifluo- The procedure generally followed to produce an isotherm<br />
rescence microscope (Zeiss Axiotron, Germany). The film <strong>of</strong> any given monolayer is to spread the film, wait for the<br />
balance was enclosed in a Plexiglass housing and experi- spreading solvent to evaporate, and then compress the film<br />
ments were conducted in a Class-10,000 clean room. While at modest speeds, i.e., slow enough to avoid any known<br />
the laboratory humidity was about 65%, the humidity within kinetic effects, but fast enough to make the experiment feasi-<br />
the enclosure was probably much greater. All fluorescence ble and to dodge the many unwanted variables and problems<br />
images were captured on a CCD camera (Quantex QC-200, that generally come into play as the time length <strong>of</strong> any<br />
Sunnyvale, CA) interfaced to a video monitor and a video experiment increases. This procedure for <strong>DPPC</strong> (allowing<br />
cassette recorder. Image analysis and processing were done about a half-hour for the solvent to evaporate) yields identical<br />
isotherms (within experimental uncertainty É3A˚ 2 on taped images with commercial s<strong>of</strong>tware (Presage, Advanced<br />
Imaging Concepts, Princeton, NJ). Monolayer im-<br />
/mole-<br />
cule) for the two compression speeds <strong>of</strong> 2.57 and 0.91 A˚ 2 /<br />
aging was carried out by doping the lipid solutions with 1 moleculermin. The resulting isotherm, at 19.5�C, is shown<br />
mol% C6-NBD-<strong>DPPC</strong> dye probe. The probe displays only in Figure 2a, and agrees with the results <strong>of</strong> others reported<br />
liquid-expanded behavior, consistent with its partitioning in the literature (11, 26, 27). We note that at these two<br />
into fluid monolayer phases (12, 31). Lipid fluorescence speeds, it requires about 30 and 85 min, respectively, to
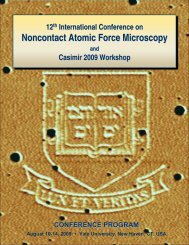
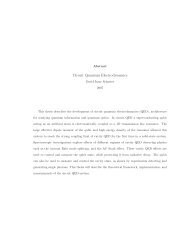
FIG. 3. Histogram <strong>of</strong> <strong>DPPC</strong> domain shapes for p Å 4.1 mN/m, compressed<br />
at 0.91 A˚ 2 /molecule min.<br />
ISOTHERMS OF <strong>DPPC</strong> MONOLAYERS<br />
223<br />
shape types and corresponding areas that were observed over<br />
a range <strong>of</strong> surface pressures from p Å 3.7 mN/m to p Å<br />
4.3 mN/m (corresponding to decreases in molecular area<br />
from 73.0 to 64.6 A˚ 2 /molecule) with data collected at increments<br />
<strong>of</strong> 0.1 mN/m. Five experiments were carried out at<br />
each compression speed to generate sufficient data. Note<br />
that one cannot use the resulting data set to determine the<br />
distribution <strong>of</strong> shapes at a particular pressure; rather this<br />
represents a composite picture <strong>of</strong> shapes observed over the<br />
range <strong>of</strong> pressures examined. The point is, however, that<br />
this composite pr<strong>of</strong>ile is significantly different for the two<br />
compression speeds. At the faster rate there is a distinct lack<br />
<strong>of</strong> bean formation, as shown in Fig. 4; at the slower rate,<br />
only a minority <strong>of</strong> domains evolve to higher order shapes,<br />
with beans dominating the distribution as shown in Fig. 5.<br />
Nag et al. have previously reported on the dependence <strong>of</strong><br />
reduce the average area per molecule from 120 to 42 A˚ 2 /<br />
molecule. In looking at the film under the fluorescence microscope<br />
it may also appear that the types, distribution, and<br />
progression <strong>of</strong> domain shapes formed in the LE/LC coexistence<br />
regime are similar for these two speeds, and follow<br />
the description provided in the Introduction (beans to S<br />
shapes to multilobed shapes). Quantitative image analysis<br />
reveals that they are not.<br />
Before comparing the results for the two different speeds,<br />
we first note that at any given pressure in the two-phase<br />
regime, there can be significant amounts <strong>of</strong> different domain<br />
types (which we categorized as either beans, S shapes, or<br />
multilobed), and for each type, the range <strong>of</strong> areas can be<br />
large. In our analysis we hand sort domains into these three<br />
categories by inspection (this requires relatively few judgment<br />
calls); however, a commercial image analysis package<br />
is used to determine domain areas. Figure 3 shows the shapes<br />
and sizes <strong>of</strong> domains observed at p Å 4.1 mN/m, reached<br />
by compressing the film at 0.91 A˚ 2 /moleculermin (five separate<br />
experiments were used to generate statistics for these<br />
histograms). In accord with the qualitative description <strong>of</strong><br />
domain evolution discussed in the Introduction, it is true that<br />
the mean area for a particular shape type increases as the<br />
pressure increases, as does the relative amount <strong>of</strong> higher<br />
order shape types (beans õ S-like õ multilobed). (This<br />
trend can be seen in Figs. 4 and 5, which are discussed next.) FIG. 4. Histogram <strong>of</strong> <strong>DPPC</strong> domain shapes (from p Å 3.7 mN/m to<br />
p Å 4.3 mN/m) compressed at 2.57 A˚ 2 For each compression rate, we generated a catalog <strong>of</strong><br />
/molecule min.
224 KLOPFER AND VANDERLICK<br />
FIG. 5. Histogram <strong>of</strong> <strong>DPPC</strong> domain shapes (from p Å 3.7 mN/m to<br />
p Å 4.3 mN/m) compressed at 0.91 A˚ 2 /molecule min.<br />
<strong>of</strong> beans, one might then conclude that this is the equilibrium<br />
shape <strong>of</strong> <strong>DPPC</strong> domains. To test this, we allowed a film<br />
exhibiting domains to age overnight (approx. 12 h). To our<br />
surprise, we found that all domains became nearly circular,<br />
as shown in Fig. 1d. Shown in the bottom <strong>of</strong> Figs. 4 and 5<br />
are the resulting size distributions <strong>of</strong> the aged circular domains.<br />
The history <strong>of</strong> these two films (compressed at different<br />
rates) has little influence on the distribution <strong>of</strong> the aged<br />
domains: all are circular and have an average area <strong>of</strong> 521<br />
mm 2 (in Fig. 4) and 491 mm 2 (in Fig. 5). Interestingly, the<br />
domains are not <strong>of</strong> uniform size, but have a dispersity <strong>of</strong><br />
about 220 mm 2 .<br />
To the best <strong>of</strong> our knowledge, only one other group before<br />
us has made note <strong>of</strong> the formation <strong>of</strong> ‘‘round’’ <strong>DPPC</strong> domains.<br />
Yang and co-workers mention seeing such domains<br />
when they compressed a <strong>DPPC</strong> monolayer very slowly (at<br />
2.0 A˚ 2 /moleculermin) (26, 27). Inspection <strong>of</strong> their micrographs<br />
reveals, however, that their domains are far from the<br />
very regular, nearly circular shapes that we observe. On the<br />
other hand, theories <strong>of</strong> equilibrium domain shape, for both<br />
untilted (23) and tilted (24) film forming molecules, predict<br />
that multilobed shapes exist but are only metastable. Stable<br />
shapes are either circular (or nearly circular in the case <strong>of</strong><br />
tilted molecules) or bilobed, the exact result depending on<br />
a system parameter which measures the relative strength <strong>of</strong><br />
line tension to dipolar electrostatic forces acting within the<br />
film.<br />
We also investigated the growth <strong>of</strong> domains formed not<br />
by compression at constant temperature but rather by cooling<br />
a monolayer at constant area. In these experiments a monolayer<br />
at 19.5�C was first compressed (at a rate <strong>of</strong> 0.91 A˚ 2 /<br />
moleculermin) to a pressure <strong>of</strong> 4.1 mN/m (histograms <strong>of</strong><br />
domain shapes observed at this particular pressure are, in<br />
fact, part <strong>of</strong> the data set used to generate Fig. 3). Next the<br />
monolayer was heated to 35�C, above the phase envelope,<br />
thus melting all the domains. After remaining at the elevated<br />
domain size on compression speed, with faster compressions<br />
temperature for about an hour, the film was then cooled back<br />
to the original temperature <strong>of</strong> 19.5�C, at which point the<br />
surface pressure was again 4.1 mN/m. Two different cooling<br />
yielding smaller average domain sizes (25); however, they rates were examined. In the first case, the time required to<br />
did not track any corresponding shape changes. Our data cool the film was 30 min, and in the second case, 4 h; the<br />
also support this finding, but in addition show that compres- corresponding distributions <strong>of</strong> shapes observed at the final<br />
sion speed regulates the evolution <strong>of</strong> domain shapes. Of<br />
course at very fast compression speeds (nearing 60 A˚<br />
pressure are shown in Figs. 6 and 7, respectively. Once<br />
2 /mole- again, we see a clear dependence on rate, with faster cooling<br />
culermin), domains form dendritic shapes (28, 29) and producing more domains with shapes <strong>of</strong> higher order (Fig.<br />
speed directly controls domain morphologies. But the speeds 6). Notice too (Fig. 7) that even though domains are nucle-<br />
studied here are much slower, and shapes observed appear ated and grown over a range <strong>of</strong> elevated temperatures, beans<br />
stable over many minutes. (It is difficult to monitor a particu- (and only beans) persist after the 4-h cooling experiment.<br />
lar domain due to convection.) This has led some to postulate Hence much longer times are still needed for domains to<br />
that beans (at smaller areas) and S-like shapes (at larger relax to circular shapes.<br />
areas) represent the quasi-equilibrium morphologies (11, It is perhaps not surprising to see evidence <strong>of</strong> some long<br />
25) <strong>of</strong> <strong>DPPC</strong> domains. Our compression rate studies clearly time relaxation mechanisms in these phospholipid mono-<br />
indicate that this is not the case.<br />
layers. The comprehensive and elucidating X-ray scattering<br />
Given that slower compression speeds favor the formation studies <strong>of</strong> Schwartz et al. (32) on fatty acid monolayers
ISOTHERMS OF <strong>DPPC</strong> MONOLAYERS<br />
225<br />
two chains that compromise a <strong>DPPC</strong> molecule, which is<br />
about 40.0 A˚ 2 /molecule (33). Although they may not have<br />
noticed it, apparent violations <strong>of</strong> the lever rule have also<br />
been seen in the work <strong>of</strong> other researchers. Both Nag et al.<br />
(25) and Florsheimer and Möhlwald (11) report that at 62<br />
A˚ 2 /molecule, the fraction <strong>of</strong> LC phase observed is 30%. To<br />
account for this fraction, the LC mean molecular area would<br />
be about 34.5 A˚ 2 /molecule (obtained by using their isotherms<br />
to estimate the LE mean molecular area), which is<br />
in agreement with our findings.<br />
We do not see this same phenomenon in films aged long<br />
enough to produce circular domain shapes. In this case, we<br />
find that the LC mean molecular area must equal 53.2 A˚ 2 /<br />
molecule to predict the observed amount <strong>of</strong> LC phase. This<br />
is a larger area than that derived from X-ray reflectivity<br />
measurements. However, films probed in those measurements<br />
(33) were maintained at a surface pressure <strong>of</strong> p Å<br />
40.0 mN/m. Here, the surface pressure is much lower, and<br />
so a value <strong>of</strong> 53.2 A˚ 2 /molecule seems reasonable, or least<br />
feasible, in light <strong>of</strong> the compressibility <strong>of</strong> the LC phase.<br />
FEATURES REVEALED: SENSITIVITY OF ISOTHERMS<br />
TO EXPERIMENT DURATION<br />
FIG. 6. Histogram <strong>of</strong> <strong>DPPC</strong> domain shapes for p Å 4.1 mN/m formed<br />
As documented in the previous section, we found that<br />
by cooling over 30 min.<br />
notably different domain shape distributions were produced<br />
at different compression speeds that otherwise yielded idenreveal<br />
that those systems relax from tilted to untilted phases tical isotherms. We also found that <strong>DPPC</strong> films left idle for<br />
over comparable times (many hours). It is not hard to imag- many hours in a state <strong>of</strong> two-phase coexistence displayed<br />
ine that very nonuniform molecular packing and ordering only circularly shaped domains. The latter observation motimight<br />
underscore the characteristic yet complex shapes <strong>of</strong> vated us to execute isotherms resulting from much slower<br />
<strong>DPPC</strong> domains shown in Fig. 1. compression rates (relative to those reported in the previous<br />
Further evidence that domain formation is a kinetically section) in an effort to capture the possible formation and<br />
controlled process can be found by comparing the relative growth <strong>of</strong> circular domains. We saw, as expected, that slower<br />
proportions <strong>of</strong> LE and LC phases actually observed to lever- compression speeds favor the formation <strong>of</strong> lower order<br />
rule predictions. Image analysis readily provides a measure shapes (mainly beans); but even at the lowest speed exam<strong>of</strong><br />
the fraction <strong>of</strong> condensed phase as a function <strong>of</strong> the film ined (0.19 A˚ 2 /moleculermin) we never saw the formation<br />
area. Interestingly, this relation is not very different for the <strong>of</strong> shapes that would be classified as circular. What we did<br />
two compression speeds we examined (even though the dis- see, however, was a pronounced effect <strong>of</strong> experiment duratributions<br />
and sizes <strong>of</strong> shapes are). Our results are also in<br />
excellent agreement with those reported by Nag et al. (25)<br />
and Florsheimer and Mo˚ hlwald (11). To compare experimental<br />
results with a lever-rule prediction, we assume that<br />
the mean molecular area <strong>of</strong> the liquid-expanded phase is<br />
74.5 A˚ 2 /molecule, corresponding to the area <strong>of</strong> the onset <strong>of</strong><br />
the plateau, where a sharp kink in the isotherm is observed.<br />
We then find that to predict the observed amount <strong>of</strong> liquidcondensed<br />
phase, values for the LC mean molecular area<br />
must range from 50.2 A˚ 2 /molecule (just after the onset <strong>of</strong><br />
coexistence) down to 34 A˚ 2 /molecule (at higher fractions<br />
<strong>of</strong> condensed phase). The latter value is considerably smaller<br />
than the molecular area determined by X-ray reflectivity<br />
(33), which is 46.0 A˚ 2 /molecule (at p Å 40.0 mN/m), or FIG. 7. Histogram <strong>of</strong> <strong>DPPC</strong> domain shapes for p Å 4.1 mN/m formed<br />
for that matter, smaller than the closed packed area for the<br />
by cooling over 4 h.
226 KLOPFER AND VANDERLICK<br />
tion on the measured isotherms. For example, we found that Since the first part <strong>of</strong> this paper reports on observations made<br />
the slower the compression speed (and therefore the longer using fluorescence microscopy, it is worth emphasizing the<br />
the time required to complete the experiment), the more change in focus from those experiments to these that follow.<br />
elevated the transition pressure corresponding to the onset The point <strong>of</strong> those experiments was to demonstrate the<br />
<strong>of</strong> LE/LC phase coexistence and the steeper the isotherm marked changes in domain shape that result from mechanical<br />
in the two-phase regime. This behavior is illustrated in Fig. effects (namely variations in compression speed); the probe<br />
2, which compares the isotherms generated at two compressions<br />
speeds: 2.57 and 0.19 A˚<br />
was maintained at fixed concentration throughout the study.<br />
Analysis and comparison <strong>of</strong> domain shapes were based on<br />
2 /moleculermin, corresponding<br />
to total compression times <strong>of</strong> 30 min and 6.8 h, respec- a simple classification scheme (beans, etc.) that neglects fine<br />
tively.<br />
features which may indeed be influenced by the amount <strong>of</strong><br />
Based on the results <strong>of</strong> the previous section, one might probe present. On the other hand, we do believe that the<br />
first wonder if the increase in surface pressure is related to overall classification scheme is useful, since similar domain<br />
the long time relaxation <strong>of</strong> the <strong>DPPC</strong> film. However, types were seen in the AFM experiments <strong>of</strong> Yang and co-<br />
Schwartz et al., who undertook painstaking measures in their workers (26, 27), and also by us in our laboratory using<br />
X-ray studies to keep their fatty acid films clean, show that Brewster angle microscopy.<br />
relaxation in these films is associated with a decrease in Returning now to the isotherm experiments, one variable<br />
surface pressure and a flattening <strong>of</strong> plateaus (32). which notably influenced the measured isotherms was the<br />
Another possibility is that subphase evaporation accounts amount <strong>of</strong> time the film was exposed to the environment.<br />
for the observed pressure increases. Indeed, the careful stud- However, we also noticed that the surface pressure <strong>of</strong> the<br />
ies <strong>of</strong> Pethica and co-workers (34, 35) on n-hexadeconoic film during exposure played a role. For example, under simi-<br />
acid monolayers confirm that isotherms are affected by hu- lar laboratory conditions, different increases in transition<br />
midity; in particular, evaporation cools the surface and also pressure were observed for the following experiments, all<br />
changes the buoyant force acting on the Wilhelmy plate. having the same duration: (a) film allowed to wait for a<br />
Relative to isotherms produced at near 100% humidity, they given time in a fully expanded state (essentially p Å 0.0<br />
found that those at 65% humidity exhibited a lower transition mN/m), and then compressed; (b) a film that was held at<br />
pressure (consistent with the ramifications <strong>of</strong> evaporation) a p Å 12.0 mN/m for the same period <strong>of</strong> time, then ex-<br />
and showed a slight increase in slope within the coexistence panded, and then compressed; (c) a film that was continu-<br />
region (associated with retardation <strong>of</strong> evaporation with inously compressed but at much slower rates than those in (a)<br />
creasing film density) (35). While the latter effect is similar and (b).<br />
to what we observed, the former is not. So, although we did To quantify the influence <strong>of</strong> surface pressure during expo-<br />
not explicitly control humidity (apart from housing the film sure, it is useful to create a variable, pP , which represents the<br />
balance in a Plexiglass enclosure), evaporation alone cannot time-averaged pressure experienced by the monolayer over<br />
fully account for the behavior <strong>of</strong> our isotherms.<br />
A sufficient condition which leads directly to the observed<br />
the course <strong>of</strong> the experiment:<br />
variations in isotherms (i.e., an increase in transition pressure<br />
and increased slope in the coexistence region) is the<br />
� p(t)dt<br />
pP Å .<br />
� dt<br />
presence <strong>of</strong> impurities (34–36). An isotherm can be considered<br />
a manifestation <strong>of</strong> the phase rule for a given system,<br />
and as such is extremely sensitive to changes in degrees <strong>of</strong> All <strong>of</strong> our experiments had the same basic form: maintaining<br />
freedom. One <strong>of</strong> the most dramatic illustrations <strong>of</strong> this is the monolayer at some constant pressure, phold, for some<br />
the difference between two-phase equilibrium in single-com- prescribed waiting time, t hold, and a compression <strong>of</strong> the<br />
ponent systems, which occurs at fixed pressure, and multi- monolayer at some constant speed, dA/dt. In this case, the<br />
component systems, which occurs over a pressure range. equation takes the form<br />
In the remainder <strong>of</strong> this paper, we elaborate on the experi-<br />
mental conditions which we found to affect the isotherms;<br />
all are in accord with the possibility that impurities, most<br />
probably air-borne, accumulate within the system. Therefore,<br />
we use colligative arguments, based on increases in transition<br />
pressure, to estimate the impurity level. Since it is well<br />
pP Å<br />
pdA<br />
A1 Total time <strong>of</strong> experiment<br />
,<br />
known that the introduction <strong>of</strong> a fluorescent probe (and where A1 and A2 are fixed limits for integration which we<br />
set to 110.0 and 50.0 A˚ 2 thereby a second component) affects the isotherm in the<br />
/molecule, respectively.<br />
same way as that described, we note that the experiments To understand better the significance <strong>of</strong> pP , we note that<br />
discussed from here on were carried out without the applica- any experiment that does not involve waiting has nearly the<br />
tion <strong>of</strong> fluorescence microscopy and thus are free <strong>of</strong> probe. same pP ; this is about 2.44 mN/m (in spite <strong>of</strong> the variations<br />
p holdt hold / (dA/dt) 01 � A 2
ISOTHERMS OF <strong>DPPC</strong> MONOLAYERS<br />
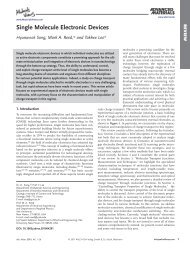
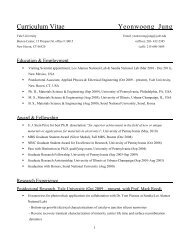
FIG. 8. Increase in transition pressure as a function <strong>of</strong> time-averaged pressure, pP , and total exposure time (the elapsed time from spreading to the<br />
end <strong>of</strong> compression). Areas <strong>of</strong> the symbols are scaled proportionally to reflect the magnitude <strong>of</strong> the surface pressure increase (as given by the numerical<br />
values). The dashed line corresponds to pP for monolayers that are continuously compressed. Different types <strong>of</strong> symbols are used to distinguish the<br />
following situations: normal laboratory conditions (filled black circles); class 10,000 clean room conditions (open circles); a monolayer film held at p<br />
Å 12.0 mN/m for 3 h under normal laboratory conditions (filled gray circle).<br />
in isotherms that are produced for slower compression rates, exposure time), different laboratory conditions produce difas<br />
evidenced in Fig. 2). Experiments which involve holding ferent increases in transition pressure. Compare the two near-<br />
the monolayer at any pressure lower (higher) than 2.44 mN/ est open and closed symbols in Fig. 8, corresponding to<br />
m will have a smaller (larger) pP . As an illustration, consider experiments performed in a clean room and under normal<br />
the resulting values <strong>of</strong> pP for three experiments similar to laboratory conditions, respectively. As expected, the latter<br />
those discussed above: (a) film held 3 h at p Å 0.0 mN/m<br />
before being compressed at a rate <strong>of</strong> 2.57 A˚<br />
demonstrates a larger increase in transition pressure. Finally,<br />
we note that films held for equal times at different surface<br />
2 /moleculermin,<br />
pP Å 0.35 mN/m; (b) film held 3 h at p Å 12.0 mN/m, then pressures do not display the same increase in transition pres-<br />
rapidly expanded, and then compressed at a rate <strong>of</strong> 2.57 A˚ sure. Films characterized by a higher pP , and thus a lower<br />
2 /<br />
moleculermin, pP Å 11.1 mN/m; (c) film continuously com- surface energy, experience less <strong>of</strong> an increase (see, for exam-<br />
pressed, pP Å 2.44 mN/m.<br />
ple, the gray circle, which corresponds to a film held at p<br />
We thus use two variables to characterize the history <strong>of</strong> Å 12). In other words, more impurities adsorb to higher<br />
a film during an experiment: pP and total exposure time. As energy surfaces.<br />
a function <strong>of</strong> these variables, we plot in Fig. 8 points which We used a simple colligative argument to estimate the<br />
represent the increase in transition pressure above that for amount <strong>of</strong> impurities that would cause our measured in-<br />
the reference isotherm shown in Fig. 2a; areas <strong>of</strong> the symbols creases in transition pressure. We assume that a <strong>DPPC</strong> film<br />
are scaled in proportion to reflect the magnitude <strong>of</strong> this in- contains a small amount <strong>of</strong> a second component, namely the<br />
crease. Three trends emerge to provide evidence that impuriimpurity, which is insoluble in the LC phase. Equivalence<br />
ties account for the noted changes in isotherms. First, by <strong>of</strong> the chemical potential <strong>of</strong> the <strong>DPPC</strong> in both phases then<br />
examining the open symbol data in Fig. 8, it can seen that leads to the following relation for the mole fraction <strong>of</strong> impu-<br />
for the same laboratory conditions (class 10,000 clean room) rity in the film:<br />
the transition pressure increases as thold increases; in this case<br />
the monolayers were compressed at the same rate after being<br />
held at pP Š0.0 mN/m for 1.5, 3.0, and 4.5 h. Second, for xI � (A the same film variables (i.e., same approximate pP and total<br />
LC 0 ALE) RT<br />
�Dp.<br />
227
228 KLOPFER AND VANDERLICK<br />
Here Dp is the increase in transition pressure relative to that fluorescence microscopy observations <strong>of</strong> films maintained<br />
for pure <strong>DPPC</strong>, A is the molecular area <strong>of</strong> <strong>DPPC</strong> in the in two-phase coexistence for up to a day show no indication<br />
given phase, and RT is the thermal energy. The coefficient <strong>of</strong> dust or foreign matter. On the contrary, only very regularly<br />
in brackets is about 0.087 m/mN for our experiments, so shaped circular domains are observed. Clearly in this case<br />
numbers reported in Fig. 8 (which are Dp) can be readily fluorescence microscopy images give no indication that<br />
converted to estimates <strong>of</strong> impurity content.<br />
something has happened to the film, but instead leaves the<br />
Using this relation we find that our films contain impuri- experimenter with a false sense <strong>of</strong> security.<br />
ties up to levels as high as 7%. This is higher than values<br />
predicted by other researchers. Although the purity <strong>of</strong> samples<br />
as received is claimed to be better than 99%, Pethica and<br />
co-workers (34, 30) have shown that careful and exhaustive<br />
purification procedures can increase this to greater than<br />
99.9%. Smaby and Brockman (37) (using a surface potential<br />
analysis) report estimates <strong>of</strong> impurities as high as 1% in<br />
their particular monolayer films. However, their films were<br />
not aged for the same extended length <strong>of</strong> time as ours, so<br />
we believe that our estimates are physically realizable. To<br />
establish a reasonable upper bound for impurity content, we<br />
intentionally corrupted a monolayer film by exposing it to<br />
heptane during a compression. This was done by isolating<br />
the film balance in a Plexiglass enclosure that also contained<br />
saturated heptane towels as well as beakers filled with heptane.<br />
After a half-hour equilibration, the film was then com-<br />
pressed. As expected, this film demonstrated the largest increase<br />
in transition pressure as well as a dramatic increase in<br />
slope throughout the coexistence region. Using the relation<br />
above, the concentration <strong>of</strong> heptane was estimated at 13%.<br />
We made some attempt to establish the origin and nature<br />
<strong>of</strong> suspected impurities. One <strong>of</strong> the likeliest sources is the<br />
spreading solvent, e.g., impurities in it, or remnants <strong>of</strong> it. We<br />
varied our spreading solvent from chlor<strong>of</strong>orm to a hexane/<br />
ethanol mix, but this had no affect on impurity levels. We<br />
even eliminated spreading solvent all together. For this, we<br />
sprinkled <strong>DPPC</strong> crystals on the surface <strong>of</strong> our film balance<br />
and allowed the film to equilibrate for 2 h. After this time,<br />
the surface pressure leveled <strong>of</strong>f at approximately 0.04 mN/<br />
m, a very small value and just within the sensitivity <strong>of</strong> our<br />
Wilhelmy plate balance. Upon compression, we found that<br />
this film displayed an isotherm similar to one that had been<br />
formed using a spreading solution and allowed to wait for<br />
the same period <strong>of</strong> time before compression.<br />
We also carried out similar studies for another monolayer,<br />
dipalmitoylphosphatidylethanolamine (DMPE), and found<br />
that similar film conditions led to similar estimates <strong>of</strong> accumulated<br />
impurities; so the effect observed is not specific to<br />
<strong>DPPC</strong>. Finally, we spread films on aged subphases, in particular<br />
water that was left stagnant for 24 h. <strong>Isotherms</strong> produced<br />
on this subphase were similar to isotherms produced on a<br />
freshly prepared subphase. Hence we speculate that air-borne<br />
CONCLUSION<br />
The structure and phase behavior <strong>of</strong> water-supported<br />
monolayers are not a new area <strong>of</strong> research; rather it has been<br />
a focus <strong>of</strong> attention in many laboratories at various times<br />
since the pioneering work <strong>of</strong> Irving Langmuir over 75 years<br />
ago. Furthermore, although a variety <strong>of</strong> different film form-<br />
ing molecules have been investigated during this span, the<br />
lion’s share <strong>of</strong> effort has been directed at a handful <strong>of</strong> sys-<br />
tems, which include fatty acids and phospholipids. One<br />
might therefore be tempted to believe that such systems are<br />
well understood. On the contrary, we are still at the stage<br />
where application <strong>of</strong> new or more powerful techniques (most<br />
notably synchotron X-ray scattering) yields significant new<br />
information that <strong>of</strong>ten tears apart the current understanding.<br />
Additional information and insights can also be reaped from<br />
routine experiments, just by paying closer attention. This<br />
work is a case in point.<br />
Although <strong>DPPC</strong> forms liquid-condensed domains with<br />
very characteristic shapes (beans, S-like, or multilobed), we<br />
have shown that the distribution <strong>of</strong> shapes is very sensitive<br />
to the rate <strong>of</strong> solidification. Slower rates—obtained either<br />
by a slower rate <strong>of</strong> compression at fixed temperature or by<br />
a slower rate <strong>of</strong> cooling at fixed area—yield distributions<br />
weighted more heavily with bean-like shapes. This clearly<br />
suggests that the monolayer is not in an equilibrium state.<br />
Analysis <strong>of</strong> domain areas (irrespective <strong>of</strong> domain shapes)<br />
as a function <strong>of</strong> degree <strong>of</strong> solidification also supports this,<br />
since violations <strong>of</strong> the lever rule are apparent. There appear<br />
to be relaxation mechanisms operative over very long time<br />
scales since monolayers allowed to relax for up to 12 h<br />
display domains that are nearly circular in shape. Conceiv-<br />
ably such shapes represent the most stable morphology, al-<br />
though we observed a significant spread in their sizes.<br />
Finally, our investigations also emphasize the importance<br />
<strong>of</strong> cleanliness, purity, and environmental control in studies<br />
<strong>of</strong> monolayers. We noted marked changes in measured isotherms<br />
as a function <strong>of</strong> experiment duration. Our best expla-<br />
nation for this is the accumulation <strong>of</strong> air-borne impurities.<br />
Given the long relaxation times that may be operative, exper-<br />
iments directed at probing the equilibrium properties <strong>of</strong> pure<br />
films will require scrupulous preparation and painstaking<br />
environmental regulation.<br />
molecules are the main source <strong>of</strong> impurities. 2<br />
We did not pursue any further attempts to characterize ACKNOWLEDGMENTS<br />
the composition <strong>of</strong> our films. However, we do note that our We gratefully acknowledge the support for this work provided by the<br />
National Science Foundation Presidential Young Investigator Program<br />
2 One possible source, as pointed out by a referee, is the Plexiglass box. (Grant CTS-89-57051) and the David and Lucile Packard Foundation.
ISOTHERMS OF <strong>DPPC</strong> MONOLAYERS<br />
REFERENCES<br />
20. McConnell, H. M., and de Koker, R. J., J. Phys. Chem. 96, 7101<br />
(1991).<br />
1. Stallberg-Stenhagen, S., and Stenhagen, E., Nature 156, 239 (1945). 21. Mayer, M. A., and Vanderlick, T. K., Langmuir 8, 3131 (1992).<br />
2. Bibo, A. M., and Peterson, I. R., Adv. Mater. 2, 309 (1990). 22. Langer, S. A., Goldstein, R. E., and Jackson, D. P., Phys. Rev. A 46,<br />
3. Schwartz, D. K., and Knobler, C. M., J. Phys. Chem. 97, 8849 (1993). 4894 (1992).<br />
4. Durbin, M. K., Malik, A., Ghaskadvi, R., Shih, M. C., Zschack, P., 23. Mayer, M. A., and Vanderlick, T. K., J. Chem. Phys. 100, 8399 (1994).<br />
and Dutta, P., J. Phys. Chem. 98, 1753 (1994).<br />
24. Mayer, M. A., and Vanderlick, T. K., J. Chem. Phys. 103, 9788 (1995).<br />
5. Overbeck, G. A., and Mobius, D., J. Phys. Chem. 97, 7999 (1993). 25. Nag, K., Boland, C., Rich, N., and Keogh, K. M. L., Biochim. Biophys.<br />
6. Von Tscharner, V., and McConnell, H. M., J. Biophys. 36, 409 (1981). Acta 1068, 157 (1991).<br />
7. Lösche, M., Sackman, E., and Möhwald, H., Ber. Bunsenges. Phys. 26. Yang, X. M., Xiao, D., Xiao, S. J., and Wei, Y., Appl. Phys. A 59, 139<br />
Chem. 87, 848 (1983).<br />
(1994).<br />
8. Stine, K. J., and Knobler, C. M., Ultramicroscopy 47, 23 (1992). 27. Yang, X. M., Xiao, D., Xiao, S. J., Lu, Z. H., and Wei, Y., Phys. Lett.<br />
9. Mao, G., Tsao, Y., Tirrell, M., Davis, H. T., Hessel, V., van Esch, J., A 197, 195 (1994).<br />
and Ringsdorf, H., Langmuir 10, 4174 (1994).<br />
28. Miller, A., Knoll, W., and Möhwald, H., Phys. Rev. Lett. 56, 2633<br />
10. Weiss, R. M., and McConnell, H. M., Nature 310, 47 (1984).<br />
(1986).<br />
11. Florsheimer, M., and Möhwald, H., Chem. Phys. Lipids 49, 231 (1989). 29. Miller, A., and Möhwald, H., J. Chem. Phys. 86, 4258 (1987).<br />
12. McConnell, H. M., Tamm, L. K., and Weiss, R. M., Proc. Natl. Acad. 30. Helm, C. A., and Möhwald, H., J. Phys. Chem. 92, 1262 (1988).<br />
Sci. 81, 3249 (1984).<br />
31. Lösche, M., and Möhwald, H., Rev. Sci. Instrum. 55, 1968 (1984).<br />
13. Henon, S., and Meunier, J., Rev. Sci. Instrum. 62, 936 (1991). 32. Schwartz, D. K., Schlossman, M. L., and Pershan, P. S., J. Chem.<br />
14. Hönig, D., and Möbius, D., Thin Solid Films 210/211, 64 (1992). Phys. 96, 2356 (1992).<br />
15. Henon, S., and Meunier, J., J. Chem. Phys. 98, 9148 (1993). 33. Helm, C. A., Möhwald, H., Kjaer, K., and Als-Nielsen, J., Europhys.<br />
16. Overbeck, G. A., Hönig, D., Wolthaus, L., Gnabe, M., and Möbius, Lett. 4, 697 (1987).<br />
D., Thin Solid Films 242, 26 (1994).<br />
34. Middelton, S. R., Iwahashi, M., Pallas, N. R., and Pethica, B. A., Proc.<br />
17. Keller, D. J., Korb, J. P., and McConnell, H. M., J. Phys. Chem. 91, R. Soc. London Ser. A 396, 143 (1984).<br />
6417 (1987).<br />
35. Pallas, N. R., and Pethica, B. A., Langmuir 1, 509 (1985).<br />
18. McConnell, H. M., and Moy, V. T., J. Phys. Chem. 92, 4520 (1988). 36. Lösche, M., and Möhwald, H., Eur. Biophys. J. 11, 35 (1984).<br />
19. Andelman, D., Brochard, F., and Joanny, J. F., J. Chem. Phys. 86, 37. Smaby, J. M., and Brockman, H. L., Chem. Phys. Lipids 58, 249<br />
3672 (1987). (1991).<br />
229