my Latex and Tex4ht cheat sheet
my Latex cheat sheet - 12000.org
my Latex cheat sheet - 12000.org

You also want an ePaper? Increase the reach of your titles
YUMPU automatically turns print PDFs into web optimized ePapers that Google loves.
4. now make pdf <strong>and</strong> html files from the above<br />
pdflatex main.tex<br />
htlatex main.tex<br />
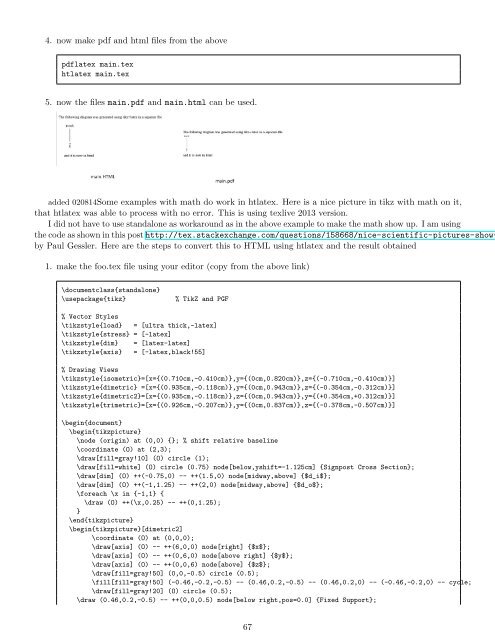
5. now the files main.pdf <strong>and</strong> main.html can be used.<br />
added 020814Some examples with math do work in htlatex. Here is a nice picture in tikz with math on it,<br />
that htlatex was able to process with no error. This is using texlive 2013 version.<br />
I did not have to use st<strong>and</strong>alone as workaround as in the above example to make the math show up. I am using<br />
the code as shown in this post http://tex.stackexchange.com/questions/158668/nice-scientific-pictures-showby<br />
Paul Gessler. Here are the steps to convert this to HTML using htlatex <strong>and</strong> the result obtained<br />
1. make the foo.tex file using your editor (copy from the above link)<br />
\documentclass{st<strong>and</strong>alone}<br />
\usepackage{tikz}<br />
% TikZ <strong>and</strong> PGF<br />
% Vector Styles<br />
\tikzstyle{load} = [ultra thick,-latex]<br />
\tikzstyle{stress} = [-latex]<br />
\tikzstyle{dim} = [latex-latex]<br />
\tikzstyle{axis} = [-latex,black!55]<br />
% Drawing Views<br />
\tikzstyle{isometric}=[x={(0.710cm,-0.410cm)},y={(0cm,0.820cm)},z={(-0.710cm,-0.410cm)}]<br />
\tikzstyle{dimetric} =[x={(0.935cm,-0.118cm)},y={(0cm,0.943cm)},z={(-0.354cm,-0.312cm)}]<br />
\tikzstyle{dimetric2}=[x={(0.935cm,-0.118cm)},z={(0cm,0.943cm)},y={(+0.354cm,+0.312cm)}]<br />
\tikzstyle{trimetric}=[x={(0.926cm,-0.207cm)},y={(0cm,0.837cm)},z={(-0.378cm,-0.507cm)}]<br />
\begin{document}<br />
\begin{tikzpicture}<br />
\node (origin) at (0,0) {}; % shift relative baseline<br />
\coordinate (O) at (2,3);<br />
\draw[fill=gray!10] (O) circle (1);<br />
\draw[fill=white] (O) circle (0.75) node[below,yshift=-1.125cm] {Signpost Cross Section};<br />
\draw[dim] (O) ++(-0.75,0) -- ++(1.5,0) node[midway,above] {$d_i$};<br />
\draw[dim] (O) ++(-1,1.25) -- ++(2,0) node[midway,above] {$d_o$};<br />
\foreach \x in {-1,1} {<br />
\draw (O) ++(\x,0.25) -- ++(0,1.25);<br />
}<br />
\end{tikzpicture}<br />
\begin{tikzpicture}[dimetric2]<br />
\coordinate (O) at (0,0,0);<br />
\draw[axis] (O) -- ++(6,0,0) node[right] {$x$};<br />
\draw[axis] (O) -- ++(0,6,0) node[above right] {$y$};<br />
\draw[axis] (O) -- ++(0,0,6) node[above] {$z$};<br />
\draw[fill=gray!50] (0,0,-0.5) circle (0.5);<br />
\fill[fill=gray!50] (-0.46,-0.2,-0.5) -- (0.46,0.2,-0.5) -- (0.46,0.2,0) -- (-0.46,-0.2,0) -- cycle;<br />
\draw[fill=gray!20] (O) circle (0.5);<br />
\draw (0.46,0.2,-0.5) -- ++(0,0,0.5) node[below right,pos=0.0] {Fixed Support};<br />
67