- Page 2 and 3:
Anuario Estadístico de los Estados
- Page 4 and 5:
Instituciones que Proporcionaron In
- Page 6 and 7:
Siglas de Otras Instituciones y de
- Page 8 and 9:
Siglas de Otras Instituciones y de
- Page 10 and 11:
Índice General Introducción Índi
- Page 12 and 13:
Como objetivos específicos, el AEE
- Page 14 and 15:
Índice de Cuadros 1. Medio Físico
- Page 16 and 17:
3. Urbanización y Vivienda 3.1 Ind
- Page 18 and 19:
4.28 Alumnos a inicio de cursos en
- Page 20 and 21:
7.4 Unidades de consulta externa se
- Page 22 and 23:
8. Seguridad, Orden Público y Fuer
- Page 24 and 25:
9.7 Personal ocupado remunerado seg
- Page 26 and 27:
9.43 Número de accidentes y enferm
- Page 28 and 29:
11.11 Formación bruta de capital f
- Page 30 and 31:
12.15 Volumen de la captura pesquer
- Page 32 and 33:
13.30 Cobrado por maquila en la ind
- Page 34 and 35:
15.8 Turistas registrados según ce
- Page 36 and 37:
16.20 Longitud de vías férreas y
- Page 38 and 39:
17.3 Volumen del servicio internaci
- Page 40 and 41:
18.19 Colocación de deuda interna
- Page 42 and 43:
19.14 Ingresos brutos estatales por
- Page 44 and 45:
20.17 Volumen y valor de las export
- Page 46 and 47:
Medio Físico CAPÍTULO 1
- Page 48 and 49:
SUPERFICIE TERRITORIAL, LÍMITES IN
- Page 50 and 51:
UBICACIÓN GEOGRÁFICA Mapa 2 COORD
- Page 52 and 53:
DIVISIÓN POR ENTIDAD FEDERATIVA Ma
- Page 54 and 55:
LOCALIZACIÓN GEOGRÁFICA DE CIUDAD
- Page 56 and 57:
ALTITUD Y UBICACIÓN DE LAS PRINCIP
- Page 58 and 59:
PROVINCIAS FISIOGRÁFICAS Mapa 4 01
- Page 60 and 61:
PRINCIPALES TIPOS DE CLIMAS, RANGOS
- Page 62 and 63:
ESTRUCTURA PORCENTUAL DE LA SUPERFI
- Page 64 and 65:
SUPERFICIE TOTAL DE LOS DEPÓSITOS
- Page 66 and 67:
PRINCIPALES PRESAS Mapa 7 01 LA ANG
- Page 68 and 69:
VOLUMEN DE RESIDUOS SÓLIDOS MUNICI
- Page 70 and 71:
PROYECTOS DE IMPACTO AMBIENTAL CUAD
- Page 72 and 73:
Aspectos Demográficos CAPÍTULO 2
- Page 74 and 75:
POBLACIÓN TOTAL, URBANA Y RURAL CU
- Page 76 and 77:
POBLACIÓN TOTAL, URBANA Y RURAL CU
- Page 78 and 79:
POBLACIÓN TOTAL, URBANA Y RURAL CU
- Page 80 and 81:
POBLACIÓN TOTAL, URBANA Y RURAL CU
- Page 82 and 83:
POBLACIÓN DE 5 AÑOS Y MÁS POR SE
- Page 84 and 85:
POBLACIÓN DE 5 AÑOS Y MÁS QUE HA
- Page 86 and 87:
NACIDOS VIVOS EN MEDIO URBANO POR S
- Page 88 and 89:
NACIDOS VIVOS EN MEDIO NO ESPECIFIC
- Page 90 and 91:
DIVORCIOS REGISTRADOS SEGÚN DURACI
- Page 92 and 93:
DEFUNCIONES GENERALES REGISTRADAS P
- Page 94 and 95:
DEFUNCIONES GENERALES REGISTRADAS P
- Page 96 and 97:
DEFUNCIONES GENERALES REGISTRADAS P
- Page 98 and 99:
MUERTES FETALES REGISTRADAS SEGÚN
- Page 100 and 101:
Urbanización y Vivienda CAPÍTULO
- Page 102 and 103:
INDICADORES SELECCIONADOS DEL PROGR
- Page 104 and 105:
RECAUDACIÓN POR EL COBRO DE DERECH
- Page 106 and 107:
VIVIENDAS HABITADAS, OCUPANTES Y PR
- Page 108 and 109:
VIVIENDAS PARTICULARES HABITADAS CU
- Page 110 and 111:
VIVIENDAS PARTICULARES HABITADAS Y
- Page 112 and 113:
INVERSIÓN EJERCIDA EN VIVIENDA SEG
- Page 114 and 115:
CRÉDITOS PARA VIVIENDA SEGÚN TIPO
- Page 116 and 117:
Educación CAPÍTULO 4
- Page 118 and 119:
POBLACIÓN DE 15 AÑOS Y MÁS POR G
- Page 120 and 121:
POBLACIÓN DE 6 A 14 AÑOS POR EDAD
- Page 122 and 123:
POBLACIÓN DE 6 AÑOS Y MÁS POR SE
- Page 124 and 125:
POBLACIÓN DE 15 AÑOS Y MÁS POR N
- Page 126 and 127:
POBLACIÓN DE 12 AÑOS Y MÁS POR G
- Page 128 and 129:
POBLACIÓN DE 15 AÑOS Y MÁS POR E
- Page 130 and 131:
PRINCIPALES INDICADORES EDUCATIVOS
- Page 132 and 133:
ALUMNOS, PERSONAL DOCENTE Y ESCUELA
- Page 134 and 135:
ALUMNOS, PERSONAL DOCENTE Y ESCUELA
- Page 136 and 137:
ALUMNOS, PERSONAL DOCENTE Y ESCUELA
- Page 138 and 139:
ALUMNOS, PERSONAL DOCENTE Y ESCUELA
- Page 140 and 141:
ALUMNOS, PERSONAL DOCENTE Y ESCUELA
- Page 142 and 143:
ALUMNOS A INICIO DE CURSOS EN LOS N
- Page 144 and 145:
POBLACIÓN ATENDIDA EN EL SISTEMA C
- Page 146 and 147:
POBLACIÓN ATENDIDA, PERSONAL DOCEN
- Page 148 and 149:
POBLACIÓN ATENDIDA EN SISTEMAS ABI
- Page 150 and 151:
POBLACIÓN ATENDIDA Y DIAGNOSTICADA
- Page 152 and 153:
GASTO NACIONAL EN EDUCACIÓN SEGÚN
- Page 154 and 155:
Ciencia y Tecnología CAPÍTULO 5
- Page 156 and 157:
GASTO FEDERAL EJERCIDO EN CIENCIA Y
- Page 158 and 159:
GASTO FEDERAL EJERCIDO EN CIENCIA Y
- Page 160 and 161:
APOYO DEL CONSEJO NACIONAL DE CIENC
- Page 162 and 163:
PATENTES SOLICITADAS Y CONCEDIDAS E
- Page 164 and 165:
PROYECTOS DE INVESTIGACIÓN Y COOPE
- Page 166 and 167:
Cultura, Recreación y Deporte CAP
- Page 168 and 169:
ESTABLECIMIENTOS Y VISITANTES A ZON
- Page 170 and 171:
EVENTOS REALIZADOS PARA LA DIFUSIÓ
- Page 172 and 173:
CARACTERÍSTICAS SELECCIONADAS DE E
- Page 174 and 175:
ACTIVIDAD REGISTRADA EN ESPECTÁCUL
- Page 176 and 177:
PRESUPUESTO EJERCIDO EN ACTIVIDADES
- Page 178 and 179:
Salud y Seguridad Social CAPÍTULO
- Page 180 and 181:
POBLACIÓN DERECHOHABIENTE SEGÚN I
- Page 182 and 183:
UNIDADES DE CONSULTA EXTERNA SEGÚN
- Page 184 and 185:
PERSONAL MÉDICO EN INSTITUCIONES D
- Page 186 and 187:
MÉDICOS GENERALES SEGÚN INSTITUCI
- Page 188 and 189:
MÉDICOS PASANTES SEGÚN INSTITUCIO
- Page 190 and 191:
PERSONAL EN OTRAS LABORES MÉDICAS
- Page 192 and 193:
CONSULTAS EXTERNAS GENERALES OTORGA
- Page 194 and 195:
CONSULTAS EXTERNAS ODONTOLÓGICAS O
- Page 196 and 197:
CONSULTAS DE PLANIFICACIÓN FAMILIA
- Page 198 and 199:
INMUNIZACIONES APLICADAS EN INSTITU
- Page 200 and 201:
PERSONAL NO MÉDICO QUE LABORA EN E
- Page 202 and 203:
SERVICIOS AUXILIARES DE DIAGNÓSTIC
- Page 204 and 205:
GASTO PÚBLICO FEDERAL EN SALUD CUA
- Page 206 and 207:
PRESTACIONES SOCIALES OTORGADAS POR
- Page 208 and 209:
PRESTACIONES SOCIALES OTORGADAS POR
- Page 210 and 211:
PRESTACIONES ECONÓMICAS OTORGADAS
- Page 212 and 213:
Seguridad, Orden Público y Fuerzas
- Page 214 and 215:
INDICADORES SELECCIONADOS RELATIVOS
- Page 216 and 217:
ÓRDENES DE APREHENSIÓN GIRADAS CU
- Page 218 and 219:
SANCIONES A SERVIDORES PÚBLICOS DE
- Page 220 and 221:
INTENTOS DE SUICIDIO Y SUICIDIOS RE
- Page 222 and 223:
INTENTOS DE SUICIDIO Y SUICIDIOS RE
- Page 224 and 225:
INTENTOS DE SUICIDIO Y SUICIDIOS RE
- Page 226 and 227:
CASOS PUESTOS A DISPOSICIÓN DEL CO
- Page 228 and 229:
CASOS PUESTOS A DISPOSICIÓN DEL CO
- Page 230 and 231:
PRESUNTOS DELINCUENTES REGISTRADOS
- Page 232 and 233:
DELINCUENTES SENTENCIADOS REGISTRAD
- Page 234 and 235:
PRESUNTOS DELINCUENTES REGISTRADOS
- Page 236 and 237:
ACCIDENTES DE TRÁNSITO TERRESTRE C
- Page 238 and 239:
ASEGURAMIENTO DE DROGAS EN EL COMBA
- Page 240 and 241:
INDICADORES SOBRE LAS ACTIVIDADES D
- Page 242 and 243:
ORIGEN Y DESTINO DE LOS RECURSOS CU
- Page 244 and 245:
9. EMPLEO Para el tema que aborda e
- Page 246 and 247:
POBLACIÓN DE 12 AÑOS Y MÁS POR S
- Page 248 and 249:
POBLACIÓN OCUPADA POR SEXO SEGÚN
- Page 250 and 251:
POBLACIÓN DE 12 AÑOS Y MÁS POR N
- Page 252 and 253:
PERSONAL OCUPADO REMUNERADO SEGÚN
- Page 254 and 255:
EMPLEADOS OCUPADOS EN LA INDUSTRIA
- Page 256 and 257:
HORAS TRABAJADAS EN LA INDUSTRIA MA
- Page 258 and 259:
ÍNDICE DEL PERSONAL OCUPADO EN LOS
- Page 260 and 261:
PERSONAL OCUPADO REMUNERADO POR SEC
- Page 262 and 263:
TASA NETA DE PARTICIPACIÓN ECONÓM
- Page 264 and 265:
TASA NETA DE PARTICIPACIÓN ECONÓM
- Page 266 and 267:
DISTRIBUCIÓN PORCENTUAL DE LA POBL
- Page 268 and 269:
DISTRIBUCIÓN PORCENTUAL DE LA POBL
- Page 270 and 271:
INDICADORES SELECCIONADOS DE EMPLEO
- Page 272 and 273:
TASA DE DESEMPLEO ABIERTO SEGÚN GR
- Page 274 and 275:
TASA DE DESEMPLEO ABIERTO SEGÚN Á
- Page 276 and 277:
DISTRIBUCIÓN PORCENTUAL DE LA POBL
- Page 278 and 279:
DISTRIBUCIÓN PORCENTUAL DE LA POBL
- Page 280 and 281:
TASAS COMPLEMENTARIAS DE EMPLEO Y D
- Page 282 and 283:
INDICADORES SELECCIONADOS DEL PROGR
- Page 284 and 285:
ASEGURADOS EN EL INSTITUTO MEXICANO
- Page 286 and 287:
TRABAJADORES INCORPORADOS AL RÉGIM
- Page 288 and 289:
INDICADORES SELECCIONADOS CUADRO 9.
- Page 290 and 291:
ACCIDENTES DE TRABAJO SEGÚN REGIÓ
- Page 292 and 293:
RIESGOS DE TRABAJO SEGÚN GRUPO DE
- Page 294 and 295:
NÚMERO DE ACCIDENTES Y ENFERMEDADE
- Page 296 and 297:
CONVENIOS DE TRABAJO FUERA DE JUICI
- Page 298 and 299:
CONFLICTOS DE TRABAJO SEGÚN ACTIVI
- Page 300 and 301:
CONFLICTOS DE TRABAJO SOLUCIONADOS
- Page 302 and 303:
EMPLAZAMIENTOS A HUELGA SEGÚN MOTI
- Page 304 and 305:
HUELGAS ESTALLADAS SEGÚN ACTIVIDAD
- Page 306 and 307:
HUELGAS SOLUCIONADAS SEGÚN ACTIVID
- Page 308 and 309:
10. SALARIOS El contenido de este c
- Page 310 and 311:
REMUNERACIÓN DE ASALARIADOS SEGÚN
- Page 312 and 313:
REMUNERACIÓN MEDIA ANUAL SEGÚN GR
- Page 314 and 315:
SALARIO MÍNIMO GENERAL NACIONAL Y
- Page 316 and 317:
SUELDOS PAGADOS EN LA INDUSTRIA MAN
- Page 318 and 319:
REMUNERACIONES MENSUALES REALES POR
- Page 320 and 321:
ÍNDICE DE REMUNERACIONES REALES PR
- Page 322 and 323:
11. INFORMACIÓN ECONÓMICA AGREGAD
- Page 324 and 325:
CUENTA DE GENERACIÓN DE INGRESO CU
- Page 326 and 327:
OFERTA Y UTILIZACIÓN DE BIENES Y S
- Page 328 and 329:
PRODUCCIÓN EN VALORES BÁSICOS SEG
- Page 330 and 331:
CONSUMO INTERMEDIO SEGÚN GRAN DIVI
- Page 332 and 333:
VALOR AGREGADO BRUTO EN VALORES BÁ
- Page 334 and 335:
VALOR AGREGADO BRUTO EN VALORES BÁ
- Page 336 and 337:
FORMACIÓN BRUTA DE CAPITAL FIJO SE
- Page 338 and 339:
FORMACIÓN BRUTA DE CAPITAL FIJO CU
- Page 340 and 341:
PRODUCTO INTERNO NETO ECOLÓGICO CU
- Page 342 and 343:
DEMANDA FINAL SEGÚN ACTIVIDAD CUAD
- Page 344 and 345:
CUENTA DE PRODUCCIÓN POR SECTORES
- Page 346 and 347:
CONSUMO DE LOS HOGARES Y DE LAS INS
- Page 348 and 349:
GASTOS DE CONSUMO FINAL PRIVADO CUA
- Page 350 and 351:
GASTOS DE CONSUMO DEL GOBIERNO GENE
- Page 352 and 353:
CONSTRUCCIÓN PÚBLICA EN VALORES B
- Page 354 and 355:
CONSTRUCCIÓN PÚBLICA EN VALORES B
- Page 356 and 357:
EXCEDENTE BRUTO DE OPERACIÓN SEGÚ
- Page 358 and 359:
CASOS ATENDIDOS POR LA COMISIÓN FE
- Page 360 and 361:
12. AGRICULTURA, GANADERÍA, SILVIC
- Page 362 and 363:
SUPERFICIE AGRÍCOLA SEMBRADA SEGÚ
- Page 364 and 365:
SUPERFICIE AGRÍCOLA COSECHADA SEG
- Page 366 and 367:
VOLUMEN DE LA PRODUCCIÓN AGRÍCOLA
- Page 368 and 369:
INDICADORES SELECCIONADOS DEL PROGR
- Page 370 and 371:
VOLUMEN Y VALOR DE LA PRODUCCIÓN D
- Page 372 and 373:
VOLUMEN DE LA PRODUCCIÓN FORESTAL
- Page 374 and 375:
VOLUMEN DE LA CAPTURA PESQUERA EN P
- Page 376 and 377:
VOLUMEN DE LA CAPTURA PESQUERA EN P
- Page 378 and 379:
VOLUMEN DE LA PRODUCCIÓN ACUÍCOLA
- Page 380 and 381:
Industria CAPÍTULO 13
- Page 382 and 383:
De igual forma, se integran cifras
- Page 384 and 385:
VOLUMEN DE LA PRODUCCIÓN MINEROMET
- Page 386 and 387:
VOLUMEN DE LA PRODUCCIÓN MINEROMET
- Page 388 and 389:
VALOR DE LA PRODUCCIÓN MINEROMETAL
- Page 390 and 391:
INDICADORES SELECCIONADOS SOBRE PER
- Page 392 and 393:
VOLUMEN DE LA PRODUCCIÓN DE PETRÓ
- Page 394 and 395:
CARACTERÍSTICAS SELECCIONADAS DE L
- Page 396 and 397:
ESTABLECIMIENTOS EN LA INDUSTRIA MA
- Page 398 and 399:
VALOR DE LAS VENTAS EN LA INDUSTRIA
- Page 400 and 401:
CONSUMO NACIONAL APARENTE DE FIBRAS
- Page 402 and 403:
VOLUMEN DE LA PRODUCCIÓN DE PETROL
- Page 404 and 405:
VOLUMEN DE LAS VENTAS INTERNAS DE G
- Page 406 and 407:
PRECIOS AL PÚBLICO DE GAS Y DE PRO
- Page 408 and 409:
VOLUMEN DE LA PRODUCCIÓN PETROQUÍ
- Page 410 and 411:
VOLUMEN DE LA PRODUCCIÓN PETROQUÍ
- Page 412 and 413:
VOLUMEN DE LA PRODUCCIÓN DE MATERI
- Page 414 and 415:
VOLUMEN DE LA PRODUCCIÓN DE LAMINA
- Page 416 and 417:
VOLUMEN DE LAS VENTAS DE PRODUCTOS
- Page 418 and 419:
VENTAS A LA RED DE DISTRIBUIDORES D
- Page 420 and 421:
VALOR NOMINAL Y REAL DE LA PRODUCCI
- Page 422 and 423:
CAPACIDAD EFECTIVA PARA GENERACIÓN
- Page 424 and 425:
VENTAS DE ENERGÍA ELÉCTRICA, USUA
- Page 426 and 427:
14. COMERCIO INTERIOR La primera pa
- Page 428 and 429:
CARACTERÍSTICAS SELECCIONADAS EN E
- Page 430 and 431:
ÍNDICES DE VENTAS Y COMPRAS NETAS
- Page 432 and 433:
ÍNDICES DE VENTAS Y COMPRAS NETAS
- Page 434 and 435:
ÍNDICE NACIONAL DE PRECIOS AL CONS
- Page 436 and 437:
ÍNDICE NACIONAL DE PRECIOS AL CONS
- Page 438 and 439:
ÍNDICE GENERAL DE PRECIOS AL CONSU
- Page 440 and 441:
ÍNDICE GENERAL DE PRECIOS AL CONSU
- Page 442 and 443:
ÍNDICE DE PRECIOS AL CONSUMIDOR EN
- Page 444 and 445:
ÍNDICE NACIONAL DE PRECIOS PRODUCT
- Page 446 and 447:
INFLACIONES DEL ÍNDICE NACIONAL DE
- Page 448 and 449:
15. TURISMO En este capítulo se in
- Page 450 and 451:
OFERTA DE CUARTOS DE HOTEL SEGÚN C
- Page 452 and 453:
CUARTOS PROMEDIO DE HOTEL SEGÚN CE
- Page 454 and 455:
GASTO DE VISITANTES INTERNACIONALES
- Page 456 and 457:
TURISTAS NACIONALES REGISTRADOS SEG
- Page 458 and 459:
TURISTAS EXTRANJEROS REGISTRADOS SE
- Page 460 and 461:
TURISTAS, GASTO TOTAL Y MEDIO, DEL
- Page 462 and 463:
TURISMO RECEPTIVO SEGÚN CALIDAD MI
- Page 464 and 465:
GASTO TOTAL DEL TURISMO RECEPTIVO S
- Page 466 and 467:
GASTO DEL TURISMO EGRESIVO SEGÚN V
- Page 468 and 469:
INDICADORES DEL FINANCIAMIENTO A LA
- Page 470 and 471:
VALOR AGREGADO BRUTO TOTAL Y DE LA
- Page 472 and 473:
16. TRANSPORTES En este capítulo s
- Page 474 and 475:
LONGITUD DE LA RED NACIONAL DE CARR
- Page 476 and 477:
LONGITUD DE LA RED NACIONAL DE CARR
- Page 478 and 479:
EMPRESAS Y FLOTA VEHICULAR DEL SERV
- Page 480 and 481:
FLOTA VEHICULAR DEL SERVICIO PÚBLI
- Page 482 and 483:
EMPRESAS Y FLOTA VEHICULAR DEL SERV
- Page 484 and 485:
EMPRESAS Y FLOTA VEHICULAR DEL SERV
- Page 486 and 487:
CARGA TRANSPORTADA POR EL SERVICIO
- Page 488 and 489:
EMPRESAS Y FLOTA VEHICULAR DEL SERV
- Page 490 and 491:
TRÁNSITO VEHICULAR EN CAMINOS Y PU
- Page 492 and 493:
EQUIPO DEL TRANSPORTE FERROVIARIO P
- Page 494 and 495:
INDICADORES SELECCIONADOS DEL MOVIM
- Page 496 and 497:
UNIDADES Y CAPACIDAD DE CARGA DE LA
- Page 498 and 499:
OBRAS DE PROTECCIÓN Y ÁREAS DE AL
- Page 500 and 501:
MOVIMIENTO PORTUARIO DE CARGA POR L
- Page 502 and 503:
MOVIMIENTO PORTUARIO DE CARGA POR T
- Page 504 and 505:
MOVIMIENTO PORTUARIO DE CONTENEDORE
- Page 506 and 507:
EMBARCACIONES, TONELAJE DE REGISTRO
- Page 508 and 509:
CARACTERÍSTICAS SELECCIONADAS DEL
- Page 510 and 511:
MOVIMIENTO DE PASAJEROS EN EL SERVI
- Page 512 and 513:
PASAJEROS TRANSPORTADOS EN SERVICIO
- Page 514 and 515:
MOVIMIENTO AEROPORTUARIO DE PASAJER
- Page 516 and 517:
EXÁMENES MÉDICOS PARA LA DETECCI
- Page 518 and 519:
CARACTERÍSTICAS SELECCIONADAS DEL
- Page 520 and 521:
CARACTERÍSTICAS SELECCIONADAS DEL
- Page 522 and 523:
Comunicaciones CAPÍTULO 17
- Page 524 and 525:
OFICINAS POSTALES EN OPERACIÓN Y P
- Page 526 and 527:
VOLUMEN DEL SERVICIO INTERNACIONAL
- Page 528 and 529:
OFICINAS, PERSONAL OCUPADO Y LONGIT
- Page 530 and 531:
VOLUMEN Y VALOR DE LOS GIROS TELEGR
- Page 532 and 533:
INDICADORES DE OPERACIÓN DEL SERVI
- Page 534 and 535:
ESTACIONES RADIODIFUSORAS SEGÚN R
- Page 536 and 537:
ESTACIONES TERRENAS LOCALES E INTER
- Page 538 and 539:
OPERACIÓN DEL SISTEMA SATELITAL CU
- Page 540 and 541:
18. INDICADORES FINANCIEROS Y MONET
- Page 542 and 543:
AGREGADOS MONETARIOS AMPLIADOS CUAD
- Page 544 and 545:
USOS Y BASE MONETARIA SEGÚN FUENTE
- Page 546 and 547:
RECURSOS Y OBLIGACIONES DEL BANCO D
- Page 548 and 549:
RECURSOS Y OBLIGACIONES DE LA BANCA
- Page 550 and 551:
RECURSOS Y OBLIGACIONES DE LA BANCA
- Page 552 and 553:
RECURSOS Y OBLIGACIONES DE LAS SOCI
- Page 554 and 555:
CRÉDITO TOTAL OTORGADO A TRAVÉS D
- Page 556 and 557:
CARTERA VENCIDA DE LA BANCA DE DESA
- Page 558 and 559:
AHORRO FINANCIERO SEGÚN ORIGEN CUA
- Page 560 and 561:
EMPRESAS BENEFICIADAS A TRAVÉS DEL
- Page 562 and 563:
VOLUMEN Y VALOR DE LAS OPERACIONES
- Page 564 and 565:
INSTITUCIONES DE SEGUROS AUTORIZADA
- Page 566 and 567:
MOVIMIENTO DE PRIMAS DE SEGUROS POR
- Page 568 and 569:
MOVIMIENTO DE SINIESTROS Y VENCIMIE
- Page 570 and 571:
PÓLIZAS, ASEGURADOS Y SUMAS ASEGUR
- Page 572 and 573:
FIANZAS RECLAMADAS Y RECUPERADAS PO
- Page 574 and 575:
TASAS DE RENDIMIENTO AL VENCIMIENTO
- Page 576 and 577:
TIPO DE CAMBIO DEL PESO CON RESPECT
- Page 578 and 579:
CIRCULACIÓN Y TENENCIA DE VALORES
- Page 580 and 581:
MONTOS EMITIDOS, AMORTIZADOS, SALDO
- Page 582 and 583:
VALOR DE LAS OPERACIONES DEL MERCAD
- Page 584 and 585:
Sector Público CAPÍTULO 19
- Page 586 and 587:
BALANCE FINANCIERO DEL SECTOR PÚBL
- Page 588 and 589:
SITUACIÓN FINANCIERA DEL SECTOR P
- Page 590 and 591: SITUACIÓN FINANCIERA DEL GOBIERNO
- Page 592 and 593: BALANCE DE ENTIDADES BAJO CONTROL P
- Page 594 and 595: BALANCE DE ENTIDADES BAJO CONTROL P
- Page 596 and 597: GASTO PROGRAMABLE EJERCIDO DEL SECT
- Page 598 and 599: ASIGNACIÓN ORIGINAL DEL GASTO PROG
- Page 600 and 601: INVERSIÓN PÚBLICA FEDERAL EJERCID
- Page 602 and 603: INVERSIÓN PÚBLICA FEDERAL EJERCID
- Page 604 and 605: INGRESOS BRUTOS ESTATALES SEGÚN FR
- Page 606 and 607: INGRESOS BRUTOS DEL DISTRITO FEDERA
- Page 608 and 609: INGRESOS BRUTOS MUNICIPALES POR FRA
- Page 610 and 611: EGRESOS BRUTOS DEL DISTRITO FEDERAL
- Page 612 and 613: GASTO PÚBLICO FEDERAL EJERCIDO PAR
- Page 614 and 615: CUENTA DE PRODUCCIÓN TOTAL Y DEL S
- Page 616 and 617: CUENTA DE PRODUCCIÓN TOTAL Y DEL S
- Page 618 and 619: CUENTA DE PRODUCCIÓN DEL SECTOR P
- Page 620 and 621: CUENTA DE PRODUCCIÓN DEL SECTOR P
- Page 622 and 623: CUENTA DE PRODUCCIÓN DEL SECTOR P
- Page 624 and 625: CUENTA DE PRODUCCIÓN DEL SECTOR P
- Page 626 and 627: CUENTA DE PRODUCCIÓN DEL SECTOR P
- Page 628 and 629: CUENTA DE PRODUCCIÓN DEL SECTOR P
- Page 630 and 631: 20. SECTOR EXTERNO El tema que abor
- Page 632 and 633: BALANZA DE PAGOS CUADRO 20.1 Años
- Page 634 and 635: EXPORTACIÓN DE BIENES Y SERVICIOS
- Page 636 and 637: IMPORTACIÓN DE BIENES Y SERVICIOS
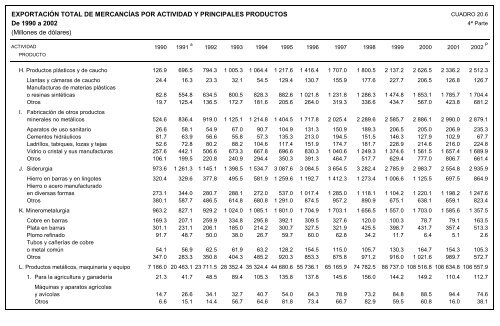
- Page 638 and 639: EXPORTACIÓN TOTAL DE MERCANCÍAS P
- Page 642 and 643: EXPORTACIÓN TOTAL DE MERCANCÍAS P
- Page 644 and 645: IMPORTACIÓN TOTAL DE MERCANCÍAS P
- Page 646 and 647: IMPORTACIÓN TOTAL DE MERCANCÍAS P
- Page 648 and 649: IMPORTACIÓN TOTAL DE MERCANCÍAS P
- Page 650 and 651: IMPORTACIÓN TOTAL DE MERCANCÍAS P
- Page 652 and 653: EXPORTACIÓN TOTAL POR ZONAS GEOECO
- Page 654 and 655: IMPORTACIÓN TOTAL POR ZONAS GEOECO
- Page 656 and 657: EXPORTACIÓN TOTAL SEGÚN SECTOR CU
- Page 658 and 659: VALOR DEL COMERCIO EXTERIOR DE HIDR
- Page 660 and 661: VOLUMEN, VALOR Y PRECIO POR BARRIL
- Page 662 and 663: VOLUMEN DE LAS EXPORTACIONES DE LOS
- Page 664 and 665: VENTAS DE EXPORTACIÓN DE VEHÍCULO
- Page 666 and 667: INVERSIÓN EXTRANJERA DIRECTA ANUAL
- Page 668 and 669: INVERSIÓN EXTRANJERA EN INSTRUMENT
- Page 670 and 671: INVERSIÓN EXTRANJERA EN INSTRUMENT
- Page 672 and 673: DEUDA PÚBLICA EXTERNA BRUTA SEGÚN
- Page 674 and 675: 21. GOBERNACIÓN Y RELACIONES EXTER
- Page 676 and 677: INTEGRANTES DE LA CÁMARA DE SENADO
- Page 678 and 679: GOBERNADORES, DIPUTADOS Y PRESIDENT
- Page 680 and 681: VOTACIONES EN ELECCIONES FEDERALES
- Page 682 and 683: GASTO PRIMARIO DEL SECTOR PÚBLICO
- Page 684 and 685: INDICADORES SELECCIONADOS EN MATERI
- Page 686 and 687: PERSONAS QUE INGRESARON AL PAÍS CU
- Page 688 and 689: MEXICANOS QUE RADICAN EN ESTADOS UN
- Page 690 and 691:
ASISTENCIA A MEXICANOS EN EL EXTRAN
- Page 692 and 693:
ACCIONES DE APOYO A MIGRANTES CUADR
- Page 694 and 695:
Glosario A ABSORCIÓN 25 Es el indi
- Page 696 and 697:
BONOS DE LA TESORERÍA DE LA FEDERA
- Page 698 and 699:
Contribuciones establecidas en la l
- Page 700 and 701:
EXCURSIONISTAS INTERNACIONALES 22 V
- Page 702 and 703:
INMIGRANTE 28 Extranjero que se int
- Page 704 and 705:
PASAJEROS EN CRUCERO 22 Personas qu
- Page 706 and 707:
PROGRAMA VIVIENDA INICIAL 23 Crédi
- Page 708 and 709:
TASA DE PRESIÓN EFECTIVA PREFERENC
- Page 710 and 711:
VISITANTES Y CONSEJEROS (FMVC) 15 S
- Page 712 and 713:
A. Áreas Geográficas Definidas pa
- Page 714 and 715:
FECHA CONMEMORACIÓN Octubre 7 Sacr
- Page 716:
UNIDAD INICIAL FACTOR DE CONVERSIÓ