Apress.Expert.Oracle.Database.Architecture.9i.and.10g.Programming.Techniques.and.Solutions.Sep.2005
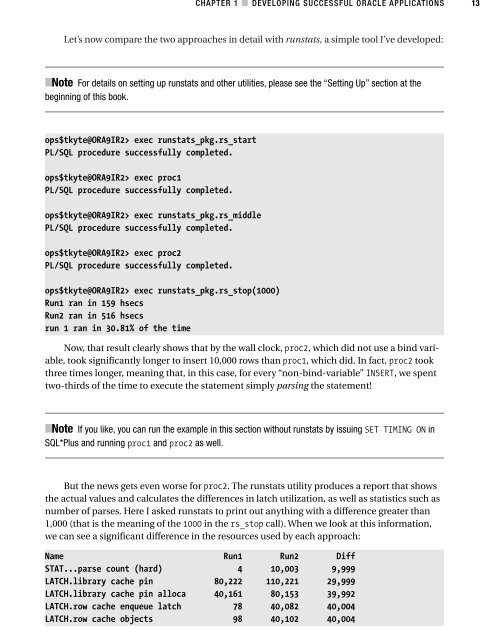
CHAPTER 1 ■ DEVELOPING SUCCESSFUL ORACLE APPLICATIONS 13 Let’s now compare the two approaches in detail with runstats, a simple tool I’ve developed: ■Note For details on setting up runstats and other utilities, please see the “Setting Up” section at the beginning of this book. ops$tkyte@ORA9IR2> exec runstats_pkg.rs_start PL/SQL procedure successfully completed. ops$tkyte@ORA9IR2> exec proc1 PL/SQL procedure successfully completed. ops$tkyte@ORA9IR2> exec runstats_pkg.rs_middle PL/SQL procedure successfully completed. ops$tkyte@ORA9IR2> exec proc2 PL/SQL procedure successfully completed. ops$tkyte@ORA9IR2> exec runstats_pkg.rs_stop(1000) Run1 ran in 159 hsecs Run2 ran in 516 hsecs run 1 ran in 30.81% of the time Now, that result clearly shows that by the wall clock, proc2, which did not use a bind variable, took significantly longer to insert 10,000 rows than proc1, which did. In fact, proc2 took three times longer, meaning that, in this case, for every “non-bind-variable” INSERT, we spent two-thirds of the time to execute the statement simply parsing the statement! ■Note If you like, you can run the example in this section without runstats by issuing SET TIMING ON in SQL*Plus and running proc1 and proc2 as well. But the news gets even worse for proc2. The runstats utility produces a report that shows the actual values and calculates the differences in latch utilization, as well as statistics such as number of parses. Here I asked runstats to print out anything with a difference greater than 1,000 (that is the meaning of the 1000 in the rs_stop call). When we look at this information, we can see a significant difference in the resources used by each approach: Name Run1 Run2 Diff STAT...parse count (hard) 4 10,003 9,999 LATCH.library cache pin 80,222 110,221 29,999 LATCH.library cache pin alloca 40,161 80,153 39,992 LATCH.row cache enqueue latch 78 40,082 40,004 LATCH.row cache objects 98 40,102 40,004
14 CHAPTER 1 ■ DEVELOPING SUCCESSFUL ORACLE APPLICATIONS LATCH.child cursor hash table 35 80,023 79,988 LATCH.shared pool 50,455 162,577 112,122 LATCH.library cache 110,524 250,510 139,986 Run1 latches total versus runs -- difference and pct Run1 Run2 Diff Pct 407,973 889,287 481,314 45.88% PL/SQL procedure successfully completed. ■Note It is to be expected that you see somewhat different values in your testing. I would be surprised if you got exactly the same values for all numbers, especially the latching numbers. You should, however, see similar numbers, assuming you are using Oracle9i Release 2 on Linux, as I was here. In all releases, I would expect the number of latches used to hard parse to be higher than those for soft parsing each insert, or parsing the insert once and executing it over and over. Running the preceding test in Oracle 10g Release 1 on the same machine produced results such that the elapsed time of the bind variable approach was onetenth of the non–bind variable approach, and the amount of latches taken was 17 percent. This was due to two factors, one being that 10g is a new release and some internal algorithms changed. The other was due to an improved way dynamic SQL is processed in PL/SQL in 10g. You can see that there were only four hard parses with the bind variable approach, but over 10,000 hard parses without bind variables (once for each of the inserts). But that is just the tip of the iceberg. You can see here that twice as many “latches” were used in the non–bind variable approach than when using bind variables. This is because in order to modify this shared structure, Oracle must take care to allow only one process in at a time (it is very bad if two processes or threads attempt to update the same in-memory data structure simultaneously—corruption would abound). So, Oracle employs a latching mechanism, a lightweight locking device, to serialize access. Don’t be fooled by the word “lightweight”—these are serialization devices, allowing one-at-a-time, short duration access to a data structure. The latches overused by the hard-parsing implementation are among the most used latches out there. The latch into the shared pool and the latch for the library cache are big-time latches; they’re the ones that people compete for frequently. What that means is that as we increase the number of users attempting to hard-parse statements simultaneously, our performance problem will get progressively worse over time. The more people parsing, the more people fighting for the right to latch the shared pool, the longer the queues, the longer the wait. ■Note In 9i and above on machines with more than one processor, the shared pool may be divided into multiple subpools, each protected by its own latch. This permits increased scalability for applications that do not use bind variables, but it does not make the latching problem go away by any means.
- Page 8 and 9: ■CONTENTS vii ■CHAPTER 9 Redo a
- Page 10 and 11: ■CONTENTS ix ■CHAPTER 12 Dataty
- Page 12 and 13: Foreword “THINK.” In 1914, Thom
- Page 14 and 15: ■FOREWORD xiii Tom is an aficiona
- Page 16 and 17: About the Technical Reviewers ■JO
- Page 18 and 19: Introduction The inspiration for th
- Page 20 and 21: ■INTRODUCTION xix • Exposure to
- Page 22 and 23: ■INTRODUCTION xxi Chapter 3: File
- Page 24 and 25: ■INTRODUCTION xxiii Next up are t
- Page 26 and 27: Setting Up Your Environment In this
- Page 28 and 29: ■SETTING UP YOUR ENVIRONMENT xxvi
- Page 30 and 31: ■SETTING UP YOUR ENVIRONMENT xxix
- Page 32 and 33: ■SETTING UP YOUR ENVIRONMENT xxxi
- Page 34 and 35: ■SETTING UP YOUR ENVIRONMENT xxxi
- Page 36 and 37: ■SETTING UP YOUR ENVIRONMENT xxxv
- Page 38 and 39: ■SETTING UP YOUR ENVIRONMENT xxxv
- Page 40 and 41: ■SETTING UP YOUR ENVIRONMENT xxxi
- Page 42 and 43: ■SETTING UP YOUR ENVIRONMENT xli
- Page 44 and 45: ■SETTING UP YOUR ENVIRONMENT xlii
- Page 46 and 47: CHAPTER 1 ■ ■ ■ Developing Su
- Page 48 and 49: CHAPTER 1 ■ DEVELOPING SUCCESSFUL
- Page 50 and 51: CHAPTER 1 ■ DEVELOPING SUCCESSFUL
- Page 52 and 53: CHAPTER 1 ■ DEVELOPING SUCCESSFUL
- Page 54 and 55: CHAPTER 1 ■ DEVELOPING SUCCESSFUL
- Page 56 and 57: CHAPTER 1 ■ DEVELOPING SUCCESSFUL
- Page 60 and 61: CHAPTER 1 ■ DEVELOPING SUCCESSFUL
- Page 62 and 63: CHAPTER 1 ■ DEVELOPING SUCCESSFUL
- Page 64 and 65: CHAPTER 1 ■ DEVELOPING SUCCESSFUL
- Page 66 and 67: CHAPTER 1 ■ DEVELOPING SUCCESSFUL
- Page 68 and 69: CHAPTER 1 ■ DEVELOPING SUCCESSFUL
- Page 70 and 71: CHAPTER 1 ■ DEVELOPING SUCCESSFUL
- Page 72 and 73: CHAPTER 1 ■ DEVELOPING SUCCESSFUL
- Page 74 and 75: CHAPTER 1 ■ DEVELOPING SUCCESSFUL
- Page 76 and 77: CHAPTER 1 ■ DEVELOPING SUCCESSFUL
- Page 78 and 79: CHAPTER 1 ■ DEVELOPING SUCCESSFUL
- Page 80 and 81: CHAPTER 1 ■ DEVELOPING SUCCESSFUL
- Page 82 and 83: CHAPTER 1 ■ DEVELOPING SUCCESSFUL
- Page 84 and 85: CHAPTER 1 ■ DEVELOPING SUCCESSFUL
- Page 86 and 87: CHAPTER 1 ■ DEVELOPING SUCCESSFUL
- Page 88 and 89: CHAPTER 1 ■ DEVELOPING SUCCESSFUL
- Page 90 and 91: CHAPTER 1 ■ DEVELOPING SUCCESSFUL
- Page 92: CHAPTER 1 ■ DEVELOPING SUCCESSFUL
- Page 95 and 96: 50 CHAPTER 2 ■ ARCHITECTURE OVERV
- Page 97 and 98: 52 CHAPTER 2 ■ ARCHITECTURE OVERV
- Page 99 and 100: 54 CHAPTER 2 ■ ARCHITECTURE OVERV
- Page 101 and 102: 56 CHAPTER 2 ■ ARCHITECTURE OVERV
- Page 103 and 104: 58 CHAPTER 2 ■ ARCHITECTURE OVERV
- Page 105 and 106: 60 CHAPTER 2 ■ ARCHITECTURE OVERV
- Page 107 and 108: 62 CHAPTER 2 ■ ARCHITECTURE OVERV
CHAPTER 1 ■ DEVELOPING SUCCESSFUL ORACLE APPLICATIONS 13<br />
Let’s now compare the two approaches in detail with runstats, a simple tool I’ve developed:<br />
■Note For details on setting up runstats <strong>and</strong> other utilities, please see the “Setting Up” section at the<br />
beginning of this book.<br />
ops$tkyte@ORA9IR2> exec runstats_pkg.rs_start<br />
PL/SQL procedure successfully completed.<br />
ops$tkyte@ORA9IR2> exec proc1<br />
PL/SQL procedure successfully completed.<br />
ops$tkyte@ORA9IR2> exec runstats_pkg.rs_middle<br />
PL/SQL procedure successfully completed.<br />
ops$tkyte@ORA9IR2> exec proc2<br />
PL/SQL procedure successfully completed.<br />
ops$tkyte@ORA9IR2> exec runstats_pkg.rs_stop(1000)<br />
Run1 ran in 159 hsecs<br />
Run2 ran in 516 hsecs<br />
run 1 ran in 30.81% of the time<br />
Now, that result clearly shows that by the wall clock, proc2, which did not use a bind variable,<br />
took significantly longer to insert 10,000 rows than proc1, which did. In fact, proc2 took<br />
three times longer, meaning that, in this case, for every “non-bind-variable” INSERT, we spent<br />
two-thirds of the time to execute the statement simply parsing the statement!<br />
■Note If you like, you can run the example in this section without runstats by issuing SET TIMING ON in<br />
SQL*Plus <strong>and</strong> running proc1 <strong>and</strong> proc2 as well.<br />
But the news gets even worse for proc2. The runstats utility produces a report that shows<br />
the actual values <strong>and</strong> calculates the differences in latch utilization, as well as statistics such as<br />
number of parses. Here I asked runstats to print out anything with a difference greater than<br />
1,000 (that is the meaning of the 1000 in the rs_stop call). When we look at this information,<br />
we can see a significant difference in the resources used by each approach:<br />
Name Run1 Run2 Diff<br />
STAT...parse count (hard) 4 10,003 9,999<br />
LATCH.library cache pin 80,222 110,221 29,999<br />
LATCH.library cache pin alloca 40,161 80,153 39,992<br />
LATCH.row cache enqueue latch 78 40,082 40,004<br />
LATCH.row cache objects 98 40,102 40,004


