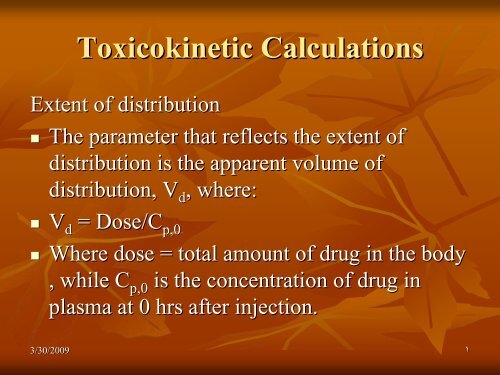
Toxicokinetic Calculations
Presentation 4
Presentation 4

Create successful ePaper yourself
Turn your PDF publications into a flip-book with our unique Google optimized e-Paper software.
<strong>Toxicokinetic</strong> <strong>Calculations</strong><br />
Extent of distribution<br />
• The parameter that reflects the extent of<br />
distribution is the apparent volume of<br />
distribution, V d , where:<br />
• V d = Dose/C p,0<br />
• Where dose = total amount of drug in the body<br />
, while C p,0 is the concentration of drug in<br />
plasma at 0 hrs after injection.<br />
3/30/2009 ١
Example:<br />
• After an IV bolus dose of 500 mg, the following data<br />
was collected: Find the elimination rate and the<br />
apparent volume of distribution.<br />
Time (hr)<br />
1<br />
2<br />
3<br />
4<br />
6<br />
8<br />
10<br />
C p, mg/L<br />
72<br />
51<br />
33<br />
20<br />
14<br />
9<br />
4<br />
Solution:<br />
• First, we should be familiar with the first order kinetics<br />
where:<br />
3/30/2009 ٢
• dC p /dt = -K el. C p<br />
• dC p /C p = -K el .dt<br />
• Integrationof the above equation gives:<br />
• C p = C p0 e -Kel.t<br />
, or<br />
• lnC p = lnC p0 - K el .t<br />
• Between time t 1 and t 2 , we have<br />
3/30/2009 ٣
• ln C p1 –lnC<br />
p2 = k el (t 2 – t 1 )<br />
• It follows that:<br />
• K el = (lnC p1 – lnC p2 )/(t 2 – t 1 )<br />
• Plotting lnC p versus time should yield a<br />
straight line with a slope equals k el<br />
• After plotting the curve, extrapolation should<br />
yield C p0 .<br />
• Finally the apparent volume can be calculated<br />
from the relation:<br />
• V d = Dose/C p,0<br />
3/30/2009 ٤
3/30/2009 ٥
• K el = (lnC p1 - lnC p2 )/(t 2 – t 1 )<br />
• K el = (ln87.1 – ln4.17)/(10 – 0)<br />
• K el = 0.304/hr<br />
• V d = Dose/C p,0<br />
• V d = 500/87.1 = 5.74 L<br />
3/30/2009 ٦
Half life of elimination<br />
• From first order kinetics we have:<br />
• lnC p = lnC p0 – k el t<br />
• lnC p - lnC p0 = -k el t<br />
• lnC p /C p0 = -k el t<br />
• The half life of elimination is defined as the time<br />
required for the concentration to decrease to one half.<br />
This means C p0 = 2C p<br />
• Substituting in the last equation above gives:<br />
• ln ½ = -k el t 1/2<br />
• Or: t 1/2 = 0.693/k el<br />
3/30/2009 ٧
3/30/2009 ٨
The steps to take are:<br />
1. Draw a line through the points (this tends to<br />
average the data)<br />
2. Pick any C p and t 1 on the line<br />
3. Determine C p /2 and t 2 using the line<br />
4. Calculate t 1/2 as (t 2 - t 1 )<br />
• And finally calculate k el = 0.693/t 1/2<br />
3/30/2009 ٩
• Cp/2<br />
Cp/4<br />
Cp/8<br />
Cp/16<br />
Cp/32<br />
Cp/64<br />
Cp/128<br />
in<br />
in<br />
in<br />
in<br />
in<br />
in<br />
in<br />
1 half-life life i.e. 50.0 % lost 50.0 %<br />
2 half-lives lives i.e. 25.0 % lost 75.0 %<br />
3 half-lives lives i.e. 12.5 % lost 87.5 %<br />
4 half-lives lives i.e. 6.25 % lost 93.75 %<br />
5 half-lives lives i.e. 3.125 % lost 96.875 %<br />
6 half-lives lives i.e. 1.563 % lost 98.438 %<br />
7 half-lives lives i.e. 0.781 % lost 99.219 %<br />
• Thus over 95 % is lost or eliminated after 5 half-lives<br />
lives<br />
3/30/2009 ١٠
3/30/2009 ١١
Example<br />
• If the rate of elimination of a drug is 0.3/hr,<br />
find the half life of elimination.<br />
• t 1/2 = 0.693/k el<br />
• t 1/2 = 0.693/0.3<br />
• t 1/2 = 2.31 hr<br />
3/30/2009 ١٢
At steady state<br />
• To describe the plasma concentration (C(<br />
p ) at<br />
any time (t)(<br />
) within a dosing interval ()(<br />
) at<br />
steady state:<br />
3/30/2009 ١٣
• Example:<br />
• Calculate the concentration of drug in plasma<br />
2 hrs after the last dose of a series of doses<br />
(6hrs interval and 100 mg each) that brought<br />
the patient to a steady state. K el = 0.3/hr and<br />
• V d =5.6 L.<br />
3/30/2009 ١٤
• Substitution gives:<br />
• C p = {100 (e -0.3*2<br />
) / 5.6(1 – e -0.3*6<br />
)}<br />
• = 54.88/4.67 = 11.74 mg/L<br />
3/30/2009 ١٥
3/30/2009 ١٦
Steady state from first principles<br />
At steady state the rate of drug administration is<br />
equal to the rate of drug elimination.<br />
Mathematically the rate of drug administration<br />
can be stated in terms of the dose (D)(<br />
) and<br />
dosing interval ().(<br />
It is always important to<br />
include the salt factor (S)(<br />
) and the<br />
bioavailability (F).(<br />
The rate of drug<br />
elimination will be the clearance of the plasma<br />
concentration at steady state:<br />
3/30/2009 ١٧
• F = AUC (extravascular) /AUC IV<br />
• S = amount of active drug/amount of total drug (salt)<br />
administered<br />
• Steady state:<br />
• Input rate = elimination rate<br />
• || ||<br />
• Maintenance dose (MD*F/) ) = CL*C ss<br />
• MD = CL*C ss */F<br />
3/30/2009 ١٨
3/30/2009 ١٩
3/30/2009 ٢٠
t = t o<br />
t’ = t<br />
3/30/2009 ٢١
C ss = C p0 = C pt /e -kel*t<br />
However, now t = t’–t , since t<br />
o = t<br />
Rearranging gives:<br />
3/30/2009 ٢٢
Loading dose<br />
The time required to obtain steady-state state plasma<br />
levels by IV infusion will be long. It is<br />
possible to administer an intravenous loading<br />
dose to attain the desired drug concentration<br />
immediately and then attempt to maintain this<br />
concentration by a continuous infusion.<br />
3/30/2009 ٢٣
3/30/2009 ٢٤
If the loading dose is to be administered orally, then<br />
the bioavailability<br />
term (F)(<br />
) needs to be introduced. Thus:<br />
3/30/2009 ٢٥
A 100 mg dose was administered every 8 h. At<br />
steady state, two plasma concentrations are<br />
measured:<br />
• Sample 1 is taken at 1 h post dose: Conc 9.6<br />
mg/L<br />
• Sample 2 is taken pre dose: Conc 2.9 mg/L<br />
3/30/2009 ٢٦
3/30/2009 ٢٧
3/30/2009 ٢٨
3/30/2009 ٢٩
The volume of distribution (V(<br />
d ) can be<br />
calculated from either the 1 h post- or pre-dose<br />
samples. From the 1 h post-dose sample<br />
The following equation describes the plasma<br />
concentration 1 h post dose at steady state:<br />
3/30/2009 ٣٠
3/30/2009 ٣١
3/30/2009 ٣٢
3/30/2009 ٣٣
A patient, aged 40 years and weighing 60 kg,<br />
receives an oral dose of Drug, 500 mg every<br />
12 h. The patient is at steady state. A plasma<br />
level is measured at 10 h post dose and is<br />
reported to be 18.2 mg/L.<br />
3/30/2009 ٣٤
Assume one-compartment kinetics, all doses<br />
were given and F = 1. Calculate the half-life life of<br />
the drug. Provided that : V d = 0.4 L/kg and CL<br />
= 0.05 L/h/kg.<br />
V d = 0.4 X 60 = 24L<br />
CL = 0.05 X 60 = 3.0 L/h<br />
CL = K el *Vd<br />
3.0 = K el *24<br />
k el = 0.125/h<br />
t 1/2 = 0.693/K el = 0.693/0.125<br />
t 1/2 = 5.5 h<br />
3/30/2009 ٣٥
Example<br />
• For a drug with : t 1/2 = 4 hr; IV dose 100 mg<br />
every 6 hours; V d = 10 liter, calculate C pmax<br />
and C pmin and when the plateau would be<br />
reached?<br />
• C<br />
0<br />
p = Dose/V d<br />
3/30/2009 ٣٦
3/30/2009 ٣٧
D/V d = C po<br />
k el = 0.693/4 = 0.17 hr -1<br />
R = e -kel<br />
* = e -0.17 x 6 = 0.35<br />
therefore<br />
Therefore the plasma concentration will fluctuate<br />
between 15.5 and 5.4 mg/liter during each dosing<br />
interval when the plateau is reached.<br />
3/30/2009 ٣٨
3/30/2009 ٣٩
Accumulation factor, R<br />
3/30/2009 ٤٠
We can also calculate the pharmacokinetic parameters<br />
k el and V d if we know the dose given and the plasma<br />
concentrations at two (or more) times after an I.V.<br />
bolus administration. This time we could use the<br />
equation:<br />
lnC p = ln C p0 - k el *t<br />
If C p 2 hours = 4.5 mg/liter and Cp 6 hours = 3.7<br />
mg/liter after a 400 mg I.V. bolus dose then:<br />
3/30/2009 ٤١
= - 0.0489 hr -1<br />
thus k el<br />
= 0.0489 hr -1<br />
Now ln C p<br />
2 hr = ln C p0<br />
-k el<br />
* t<br />
ln 4.5 = ln C p0<br />
- 0.0489 x 2<br />
ln Cp 0<br />
= 1.504 + 0.098 = 1.602<br />
3/30/2009 ٤٢
Given k el (= 0.17 hr -1 ) and V d = (25 L) for a<br />
given drug we can calculate the dose required,<br />
by rapid IV bolus, to achieve a plasma<br />
concentration of 2.4 g/ml (= 2.4 mg/L) at 6<br />
hours.<br />
Thus C p6 = C p0 * e -kel.t<br />
3/30/2009 ٤٣
or 2.4 x 25 = DOSE * e -1.02 = DOSE x 0.36<br />
3/30/2009 ٤٤
Calculation of K a<br />
1. Method of Residuals<br />
Starting with the equation for Cp versus time<br />
Cp versus Time after Oral Administration this can be written as<br />
Simplified Equation for Cp versus Time<br />
3/30/2009 ٤٥
Semi-log plot of Cp versus Time after Oral<br />
Administration<br />
3/30/2009 ٤٦
Semi-log Plot of Cp versus Time Showing C late p , Slope, and<br />
Intercept<br />
3/30/2009 ٤٧
and plotting C p<br />
late<br />
versus time gives a straight line<br />
on semi-log graph paper, with a slope (ln) = -kel and<br />
intercept = A.<br />
Now looking at the equation for Cp versus time<br />
again.<br />
Difference or Residual versus Time<br />
3/30/2009 ٤٨
3/30/2009 ٤٩
An Example Calculation Using the Method of Residuals<br />
Example Data for the Method of Residuals<br />
Time<br />
(hr)<br />
0.25<br />
0.5<br />
0.75<br />
1.0<br />
1.5<br />
2.0<br />
3.0<br />
4.0<br />
5.0<br />
6.0<br />
7.0<br />
Plasma<br />
Concentration<br />
(mg/L)<br />
1.91<br />
2.98<br />
3.54<br />
3.80<br />
3.84<br />
3.62<br />
3.04<br />
2.49<br />
2.04<br />
1.67<br />
1.37<br />
Cp(late)<br />
(mg/L)<br />
5.23<br />
4.98<br />
4.73<br />
4.50<br />
4.07<br />
3.69<br />
Residual<br />
[Col3 - Col2]<br />
(mg/L)<br />
3.32<br />
2.00<br />
1.19<br />
0.70<br />
0.23<br />
0.07<br />
3/30/2009 ٥٠
3/30/2009 ٥١
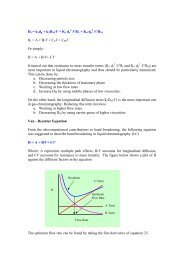
2. Wagner-Nelson Method<br />
• Advantages:<br />
i) The absorption and elimination processes can be quite similar<br />
and still accurate determinations of ka can be made.<br />
ii) The absorption process doesn't have to be first order. This<br />
method can be used to investigate the absorption process.<br />
• Disadvantages:<br />
The major disadvantage of this method is that you need to know<br />
the elimination rate constant, from data collected following<br />
intravenous administration.<br />
3/30/2009 ٥٢
• Amount absorbed = amount in body + amount eliminated<br />
• A = X + U<br />
• Differentiation gives:<br />
3/30/2009 ٥٣
• Change in amount of drug in the body with<br />
time is given by:<br />
• dX/dt = V.dC p /dt<br />
• Change in amount of drug eliminated is given<br />
by:<br />
• dU/dt = V.k el .C p<br />
• Therefore, dA/dt = V.dC p /dt + V.k el .C p<br />
• dA = V.dC p + V.k el .C p dt<br />
3/30/2009 ٥٤
• Where, A is the amount absorbed up to time t<br />
• C p = k el .AUC 0-t<br />
• Taking this to infinity gives the maximum amount<br />
absorbed (since C p equals zero after a time equals<br />
infinity:<br />
• A max = 0 + V . k el . AUC 0-<br />
3/30/2009 ٥٥
• The amount remaining to be absorbed (A max – A), can<br />
also be expressed as the amount remaining in the GI,<br />
X g<br />
• X g = (A max – A),<br />
• Dividing by V we get:<br />
• X g /V = {(A max /V) –(A/V)}<br />
• If the kinetics governing the process is a 1 st order one,<br />
then:<br />
• (X g /V) = (X g0 /V) e -kat<br />
• X/V = Concentration<br />
3/30/2009 ٥٦
• It follows that:<br />
• Plotting (A max -A)/V versus time produces a<br />
straight line on semi-log graph paper and a<br />
curved line on linear graph paper. From the<br />
slope of the line on the semi-log graph paper k a<br />
can be calculated (slope = K a )<br />
3/30/2009 ٥٧
3/30/2009 ٥٨
3/30/2009 ٥٩
3/30/2009 ٦٠
3. Method of inspection<br />
• The method of Residuals and the Wagner-Nelson methods are<br />
useful technique for determining good estimates of k a<br />
Requirements for the Method of Inspection<br />
• We assume that k a is much larger than k el . That is, that k a is at<br />
least five time greater than k el . This is the same requirement as<br />
for the Method of Residuals<br />
• Assume that absorption is complete (i.e. greater than 95 %<br />
complete) at the time of the peak concentration. This follows<br />
from the first assumption<br />
3/30/2009 ٦١
The Method<br />
• The first step is to estimate the time of the peak drug<br />
concentration by inspection. If we assume that the<br />
time of peak is approximately five time the<br />
absorption half-life:<br />
life:<br />
• t peak = 5t 1/2<br />
3/30/2009 ٦٢
• K a = (ln(<br />
2)/t<br />
2)/t 1/2 (absorption)<br />
• K a = 0.693/t 1/2(absorption)<br />
• K a = 0.693/ (t peak /5)<br />
• K a = 0.693*5 / (t(<br />
peak )<br />
3/30/2009 ٦٣
3/30/2009 ٦٤
Extent of absorption, F value<br />
• the fraction of the dose which is absorbed is<br />
termed F<br />
• Plotting C p versus time allow the<br />
calculation of k a and k el , as in the methods<br />
described previously.<br />
3/30/2009 ٦٥
• From the intercept, one can calculate the term:<br />
• The total amount absorbed can be calculated as:<br />
3/30/2009 ٦٦
3/30/2009 ٦٧
3/30/2009 ٦٨
Urine analysis<br />
• We can do the same thing using urine data alone.<br />
• F e is fraction excreted as the parent compound<br />
3/30/2009 ٦٩
Clearance<br />
3/30/2009 ٧٠
3/30/2009 ٧١
CL = K el .V d<br />
CL = 0.693V d /t 1/2<br />
3/30/2009 ٧٢
Example<br />
• What IV bolus dose is required to achieve a<br />
plasma concentration of 2.4 µg/ml (2.4 mg/L)<br />
at 6 hours after the dose is administered. The<br />
elimination rate constant, k el is 0.17 hr -1 ) and<br />
the apparent volume of distribution, V, is 25 L<br />
3/30/2009 ٧٣
3/30/2009 ٧٤
Example<br />
If C p after 2 hours is 4.5 mg/liter and C p after 6<br />
hours is 3.7 mg/liter, after a 400 mg IV bolus<br />
dose what are the values of k el and V.<br />
3/30/2009 ٧٥
mg/L<br />
3/30/2009 ٧٦
Example<br />
What is the concentration of a drug 0, 2 and 4<br />
hours after a dose of 500 mg. Known<br />
pharmacokinetic parameters are apparent<br />
volume of distribution, V d is 30 liter and the<br />
elimination rate constant, k el is 0.2 hr -1<br />
3/30/2009 ٧٧
3/30/2009 ٧٨
Make Predictions<br />
Once we have a model and parameter values we can use this<br />
information to make predictions. For example we can<br />
determine the dose required to achieve a certain drug<br />
concentration.<br />
3/30/2009 ٧٩
Finding a dose necessary to achieve a<br />
certain C p<br />
3/30/2009 ٨٠
3/30/2009 ٨١
Plasma drug concentration after multiple IV<br />
doses<br />
3/30/2009 ٨٢
• C p = {100/14}{[(1- e -12*0.23*4<br />
12*0.23*4 )/(1-e -0.23*12<br />
)]e -0.23*3<br />
)<br />
• C p = 3.8 mg/L<br />
3/30/2009 ٨٣
The following data was collected after<br />
administration of an IV and oral dose to a<br />
subject. Calculate C po , V d , and the<br />
bioavailability (F), as well as other kinetic<br />
parameters.<br />
3/30/2009 ٨٤
IV data , Dose = 100 mg<br />
3/30/2009 ٨٥
Thus the intercept value is 2.50 and the apparent volume of distribution is<br />
Dose/C p0 = 100/2.5 = 40 L. From the slope k el can be estimated as 0.201 hr -<br />
1<br />
. The AUC (AUC = Dose/V d K el ) from the IV data is 12.6 mg.hr.L - 1 .<br />
3/30/2009 ٨٦
Oral Dose = 250 mg<br />
3/30/2009 ٨٧
Semi-log Plot of Drug Concentration versus Time after an Oral<br />
dose<br />
3/30/2009 ٨٨
• The time of peak concentration is 1.5 hour, thus the t 1/2<br />
absorption might be estimated to be 0.3 hour:<br />
t 1/2 absorption = 1.5/5 = 0.3hr<br />
• and the absorption rate constant to be approximately<br />
2.3 hr -1 .<br />
• K a = 0.693/t 1/2 = 0.693/0.3 = 2.31<br />
• The AUC from the oral data is 24.91 mg.hr.L -1 and<br />
thus the bioavailability might be estimated as<br />
• F = (24.9 x 100) / (250 x 12.6) = 0.79.<br />
3/30/2009 ٨٩
Sample Preparation<br />
1. Centrifugation - removing excipients and/or<br />
macromolecules<br />
A significant separation can be achieved at times by<br />
simple centrifugation. Centrifugation of whole blood<br />
after clot formation produces serum with no red blood<br />
cells and fewer plasma proteins. Centrifugation of<br />
whole blood pretreated with anticoagulants such as<br />
heparin, EDTA or citrate produces plasma. Protein<br />
can be removed from plasma by centrifugation after<br />
the addition of trichloroacetic acid (TCA) or<br />
acetonitrile.<br />
3/30/2009 ٩٠
2. Extraction - using pH/pKa<br />
pKa partitioning or lipid/aqueous solubility<br />
differences<br />
• Extraction can be used to remove unwanted<br />
interfering compounds or to concentrate the<br />
compound(s) ) of interest. The use of various organic<br />
solvents of differing polarity and/or aqueous buffers<br />
can provide excellent resolution based on the<br />
solubility of the free compounds of interest and/or<br />
their salt forms. Extraction may be used to remove<br />
lipophilic interfering compounds or to remove the<br />
desirable compounds into a cleaner environment.<br />
3/30/2009 ٩١
3. Ultrafiltration<br />
One method of separating free drug from plasma<br />
samples is ultrafiltration. . The sample can be forced<br />
(by centrifugation) through a membrane filter. The<br />
filtrate is protein free solution of the compound.<br />
3/30/2009 ٩٢
4. Chromatography - Adsorption, partitioning, size, or charge<br />
• Chromatography can be used in a clean-up mode or in a<br />
sensitive analytical mode. In the clean-up mode the compound<br />
of interest may be adsorbed tightly onto a column while the<br />
interfering compounds are washed through it and subsequently<br />
flushed from the column with a 'stronger' eluting solvent. In<br />
the analytical mode the challenge is to choose the right column<br />
(stationary phase) and mobile phase so that the compound is<br />
eluted within a reasonable time and well resolved from other<br />
components in the sample.<br />
3/30/2009 ٩٣