The Earth Scientist
Download PDF File - The Math and Science Partnership Network
Download PDF File - The Math and Science Partnership Network

Create successful ePaper yourself
Turn your PDF publications into a flip-book with our unique Google optimized e-Paper software.
<strong>The</strong> <strong>Earth</strong> <strong>Scientist</strong><br />
~ NESTA – Celebrating 30 Years ~<br />
Volume XXIX • Issue 2 • Summer 2013 SPECIAL ISSUE $10.00*<br />
Free Inside<br />
“CHANGING EARTH”<br />
Poster from HHMI<br />
INSIDE THIS ISSUE<br />
From the President. .......................... 2<br />
From the Executive Director. ................... 3<br />
Editor’s Corner . ............................. 5<br />
NESTA Awards Presented in San Antonio........... 6<br />
Introduction to Using the Claims‐Evidence-<br />
Reasoning Framework in Middle School Science. ... 10<br />
An Instructional Unit on the Marcellus Shale for<br />
Middle School Students ...................... 15<br />
Exploring Regional Climate Patterns and Generalizing<br />
the Results to Enhance Deep Conceptualization . ... 20<br />
<strong>The</strong> Power of a Hurricane: Using Memorable Storms<br />
to Teach Inference and Graphing Skills. .......... 25<br />
Using iBooks Author to Create <strong>Earth</strong> Science<br />
Classroom Content for the iPad................. 29<br />
<strong>The</strong> Role of Gravity in Planetary Orbits ........... 32<br />
An Integrated Model for Instruction in Deep Time,<br />
Mass Extinctions and Radiometric Decay ......... 37<br />
<strong>The</strong> Successes and Challenges of Establishing PAESTA,<br />
a New Professional Community for Teachers. ...... 41<br />
A Collaborative Approach to Developing <strong>Earth</strong><br />
System Science Resources through PAESTA. ...... 46<br />
Student Conceptions of the Cause and<br />
Locations of <strong>Earth</strong>quakes..................... 50<br />
Student and Teacher Conceptions of the<br />
<strong>Earth</strong>’s Interior Structure...................... 55<br />
Subduction Zone Geometry in Three Dimensions:<br />
Using authentic data to explore relationships<br />
between earthquakes, volcanoes, and plates<br />
at convergent margins. ...................... 59<br />
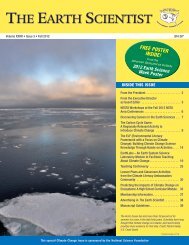
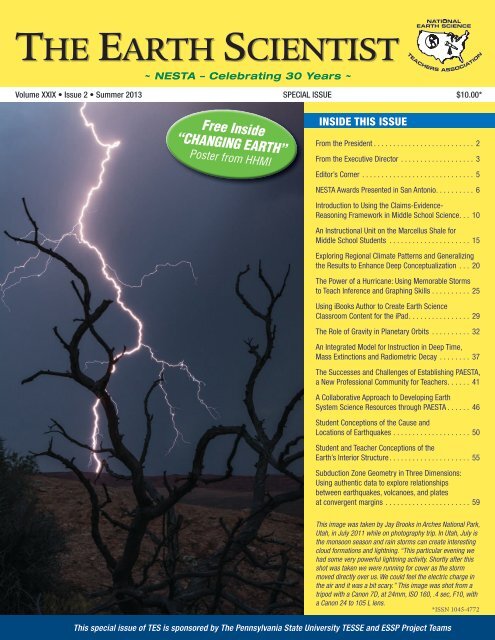
This image was taken by Jay Brooks in Arches National Park,<br />
Utah, in July 2011 while on photography trip. In Utah, July is<br />
the monsoon season and rain storms can create interesting<br />
cloud formations and lightning. “This particular evening we<br />
had some very powerful lightning activity. Shortly after this<br />
shot was taken we were running for cover as the storm<br />
moved directly over us. We could feel the electric charge in<br />
the air and it was a bit scary.” This image was shot from a<br />
tripod with a Canon 7D, at 24mm, ISO 160, .4 sec, F10, with<br />
a Canon 24 to 105 L lens.<br />
*ISSN 1045-4772<br />
This special issue of TES is sponsored by <strong>The</strong> Pennsylvania State University TESSE and ESSP Project Teams
Page 2<br />
<strong>The</strong> <strong>Earth</strong> <strong>Scientist</strong><br />
From the President<br />
by Missy Holzer, NESTA President, 2012-2014<br />
NESTA’S MISSION<br />
To facilitate and advance<br />
excellence in <strong>Earth</strong> and Space<br />
Science education.<br />
NESTA Contacts<br />
EXECUTIVE BOARD<br />
President<br />
Missy Holzer<br />
mholzer@monmouth.com<br />
President-Elect<br />
Michael J Passow<br />
michael@earth2class.org<br />
Secretary<br />
Jenelle Hopkins<br />
jhopkins@interact.ccsd.net<br />
Treasurer<br />
Howard Dimmick<br />
dimmick@esteacher.org<br />
Past-President<br />
Ardis Herrold<br />
amacio@comcast.net<br />
Board of Directors<br />
Representative<br />
Eddie Cohen<br />
ecohen@pway.org<br />
Executive Director and<br />
Association Contact<br />
Dr. Roberta Johnson<br />
rmjohnsn@gmail.com<br />
NESTA Webmaster<br />
Julia Genyuk<br />
jgenyuk@windows2universe.org<br />
NESTA Administrator<br />
Marlene DiMarco<br />
Phone: 720-982-8349<br />
[Contact the Administrator for<br />
address for Large Mailings]<br />
NESTA Address:<br />
PO Box 20854<br />
Boulder, CO 80308-3854<br />
Visit the NESTA website at<br />
http://www.nestanet.org<br />
No <strong>Earth</strong> & Space Science Teacher Left Inside<br />
We’ve all heard of the campaign for “no child left inside” and agree there are many benefits<br />
from experiencing nature. Last Child in the Woods, first written in 2005 by Richard Louv, served<br />
as the foundation for the arguments in this campaign, and provides numerous suggestions<br />
on what families can do to disconnect from technology and venture outside into our natural<br />
world. <strong>The</strong> 2008 edition of Louv’s book and his website (http://richardlouv.com/books/<br />
nature-principle/field-guide/) even contain a “Field Guide to the New Nature Movement”, with<br />
simple and practical methods for “saving our children from nature-deficit disorder.” (Note: the<br />
nature deficit disorder has not been classified as a medical disorder.) Louv’s most recent book<br />
<strong>The</strong> Nature Principle: Human Restoration and the End of Nature-Deficit Disorder (2011) turns the focus<br />
from children to adults and is “…about the power of living in nature—not with it...” (pg. 5) As<br />
<strong>Earth</strong> and space science teachers we have known this power since we made the decision to be<br />
<strong>Earth</strong> and space science teachers.<br />
Leaving our hectic school days behind, summers offer us so much potential to recharge as a<br />
person, as well as well as a professional. This summer, how about if we all try to live by the<br />
motto of “No <strong>Earth</strong> & Space Science Teacher Left Inside” and embark on a personal journey<br />
into the world about which we teach? Louv (2011) provides an extensive list of physical,<br />
mental, and social benefits to be gained from connecting or reconnecting with nature, but for<br />
those of us who are passionate about our subject areas, we only need to be reminded why we<br />
selected this domain over any other domain – our love of the natural world and how it works.<br />
However, when was the last time you took the time to get outside, by yourself, to observe,<br />
explore, and reflect as you had done in the past? If you can remember the last time you enjoyed<br />
the outside world, then you already live by the motto, but if your response has you scratching<br />
your head trying to remember when the last time was, then here are few simple things you can<br />
do this summer to personally reconnect with your domain.<br />
Many of us have easy access to the natural world comprising each of the domains of <strong>Earth</strong><br />
science, including the night sky, our atmosphere, our local geology, and our oceans and coasts.<br />
This access makes it easy for us to observe and explore, and otherwise engage with the outside<br />
world. Connecting with astronomy may, over the course of one evening, include simple activities<br />
such as looking up and watching the movement of a constellation or planet, or it may<br />
include grabbing a lawn chair and watching the Perseid meteor shower in August. While going<br />
for a walk or bike ride, a glance at the sky and feeling the direction of the breeze reminds us of<br />
how weather events form and migrate. Picking up a rock, tending the soil in our gardens, or<br />
considering the origin of that hill that challenges our walk, run, or bike ride reminds us of how<br />
the local geology is a part of life. For those living near ocean or lake coastlines, a walk along the<br />
shore reveals the energy of the water as it changes the shapes of our coastlines one sand grain at<br />
a time. While outside observing, exploring, and reflecting, the natural interactions among the<br />
atmosphere, geosphere, hydrosphere, and biosphere become apparent. Conceptualizing these<br />
interactions adds depth to our experiences and finds us “living in nature.”<br />
Within Richard Louv’s “Field Guide to the New Nature Movement” you can find other ways to<br />
connect and reconnect with the outside world, some of which may turn into new habits. Take<br />
time this summer to get outside, and encourage your fellow <strong>Earth</strong> and space science teachers to<br />
get outside, too, so that they are not left inside. Research has identified the benefits of getting<br />
© 2013 National <strong>Earth</strong> Science Teachers Association. All Rights Reserved.
Volume XXIX, Issue 2<br />
Page 3<br />
children outside, and guaranteed, adults can be the recipients of the benefits, too. Enjoy your<br />
summer and the fall will see you recharged and reconnected.<br />
Louv, Richard. (2011) <strong>The</strong> Nature Principle: Human Restoration and the End of Nature-Deficit Disorder. Algonquin<br />
Books.<br />
Louv, Richard. (2005) Last Child in the Woods: Saving Our Children from Nature-Deficit Disorder (Paperback edition).<br />
Algonquin Books.<br />
From the Executive Director<br />
At our NESTA conference events in San Antonio Thursday through Saturday, April 11-13, NESTA<br />
offered or hosted 16 events including four Share-a-Thons, five topical workshops, our Rock and<br />
Mineral Raffle, the NESTA VIP Breakfast, the NESTA <strong>Earth</strong> and Space Science Lunchtime Lecture,<br />
the AGU Lecture, and the NESTA Friends of <strong>Earth</strong> Science Reception, as well as our Board Meeting<br />
and our Annual Membership meeting. With over 1100 participants, our events were well attended,<br />
and we had record participation in financial support from our event sponsors, for which we are<br />
extremely grateful.<br />
Program Sponsors - We would particularly like to recognize our program sponsors, who provided<br />
critical overall financial support for NESTA’s activities in San Antonio. Program sponsors included<br />
the American Geophysical Union (at the Diamond Level), and Howard Hughes Medical Institute<br />
and the American Meteorological Society (at the Platinum Level).<br />
On Thursday, the NESTA Board met to go over accomplishments of the past year, to work on<br />
plans for the coming year, and to vote on several issues, including our upcoming dues increase.<br />
Early Friday morning, we held our NESTA VIP Breakfast, at which we honor those who have given<br />
so much to NESTA over the past year – including volunteers as well as organizations supporting<br />
our efforts. A list of those honored by NESTA appears in the pages of this issue. Thanks to everyone<br />
who has supported NESTA over the past year. Without your efforts and support, NESTA could not<br />
have the impact it does for so many teachers across the country!<br />
Our Share-a-Thons on Friday and Saturday were a great success! Thanks so much to Michelle Harris,<br />
our Share-a-Thon Coordinator, for all her hard work at organizing these events, making arrangements<br />
for acknowledgement/thank-you letters to presenters, and coordinating assembly of activity sets for<br />
all the presenters. Thanks also to all the volunteers that helped out in the Share-a-Thons. And a huge<br />
thanks to our Share-a-Thon sponsors: University Space Research Association, <strong>Earth</strong> Science Information<br />
Partners, Integrated Research Institutions in Seismology, Northrup-Grumman, Ocean Leadership and<br />
Ball Aerospace, who provided critical financial support for these events.<br />
Continuing our approach of the past several years, we also offered five topical workshops to<br />
teachers – all workshops were well attended, with 30 to 50 participants in each! Workshop topics<br />
included climate change, geology, <strong>Earth</strong> system science, planetary science and astronomy.<br />
In addition to our workshops, NESTA hosted the AGU Lecture at NSTA on Friday afternoon. <strong>The</strong><br />
lecture was presented by Prof. Andrew Dessler, of Texas A&M University, on “<strong>The</strong> Climate Science<br />
Debate: What Does the Science Tell Us and Why People on Both Sides Are So Angry About It”. <strong>The</strong> lecture<br />
was introduced by our President Elect, Dr. Michael Passow, and was attended by over 100 teachers.<br />
On Friday evening, NESTA hosted the Friends of <strong>Earth</strong> Science Reception. We were delighted<br />
to have well over 130 attendees at this enjoyable event where we honored Nathan Shotwell, the<br />
NESTA Contacts<br />
REGIONAL DIRECTORS<br />
Central Region - IL, IA, MN,<br />
MO, WI<br />
Chad Heinzel<br />
chad.heinzel@uni.edu<br />
East Central Region - IN, KY,<br />
MI, OH<br />
Jay Sinclair<br />
sinclair.jay@sbcglobal.net<br />
Eastern Region - DE, NJ, PA<br />
Peter Dorofy<br />
pdq72@optimum.net<br />
Far Western and Hawaii<br />
Region - CA, GU, HI, NV<br />
Wendy Van Norden<br />
wvannorden@hw.com<br />
Mid-Atlantic Region - DC, MD,<br />
VA, WV<br />
Michelle Harris<br />
michelle_harris@apsva.us<br />
New England Region - CT, ME,<br />
MA, NH, RI, VT<br />
Lisa Sarah Alter<br />
lalter@snet.net<br />
New York Region - NY<br />
Gilles Reimer<br />
greimer@hvc.rr.com<br />
North Central Region - MT, NE,<br />
ND, SD, WY<br />
Cassie Soeffing<br />
cassie_soeffing@strategies.org<br />
Northwest Region - AK, ID, OR,<br />
WA & British Columbia<br />
VACANT<br />
South Central Region - AR, KS,<br />
LA, OK, TX<br />
Wendy DeMers<br />
2ydnew2@gmail.com<br />
Southeastern Region - AL, FL,<br />
GA, MS, NC, PR, SC, TN<br />
Dave Rodriguez<br />
cdrodriguez@mac.com<br />
Southwest Region - AZ, CO,<br />
NM, UT<br />
Pamela Whiffen<br />
pwpwr@aol.com<br />
Appointed Directors<br />
Tom Ervin – tomervin@mchsi.com<br />
Ron Fabich –<br />
rfabick@zoominternet.net<br />
Parker Pennington IV –<br />
p.o.pennington@gmail.com<br />
Rick Jones –<br />
rmjones7@hawaii.edu<br />
Joe Monaco – monacoj@aol.com<br />
John Moore – mr.moore.john@<br />
gmail.com<br />
© 2013 National <strong>Earth</strong> Science Teachers Association. All Rights Reserved.
Page 4<br />
<strong>The</strong> <strong>Earth</strong> <strong>Scientist</strong><br />
NESTA<br />
Coordinators<br />
Affiliates Coordinator<br />
Ron Fabich<br />
rwfabich@gmail.com<br />
Conference Logistics<br />
Coordinators<br />
Kim Warschaw<br />
kschlussel@cox.net<br />
Michelle Harris<br />
michelle_harris@apsva.us<br />
Membership Contact<br />
Marlene DiMarco<br />
Phone: 702-982-8349<br />
Marlene.DiMarco@gmail.com<br />
Merchandise Coordinator<br />
Howard Dimmick<br />
dimmick@esteacher.org<br />
Procedures Manual<br />
Coordinator<br />
Parker Pennington IV<br />
p.o.pennington@gmail.com<br />
Rock Raffle Coordinators<br />
Parker Pennington IV<br />
p.o.pennington@gmail.com<br />
Kimberly Warschaw<br />
kschlussel@cox.net<br />
Share-a-thon Coordinator<br />
Michelle Harris<br />
michelle_harris@apsva.us<br />
Volunteer Coordinator<br />
Joe Monaco<br />
MonacoJ@aol.com<br />
Webpage Coordinator<br />
Jack Hentz<br />
hentz@aaps.k12.mi.us<br />
E-News Editor<br />
Richard Jones<br />
rmjones7@hawaii.edu<br />
recipient of the American Geosciences Institute Edward G. Roy Award for Excellence in K-8<br />
<strong>Earth</strong> Science Education. HHMI’s BioInteractive team shared several new, free resources for the<br />
earth science classroom, including the short film, “<strong>The</strong> Day the Mesozoic Died,” the “Changing<br />
Planet: Past, Present, Future” program featuring Andy Knoll, Naomi Oreskes, and Dan Schrag (free<br />
on DVD and as VOD from BioInteractive.org), and the <strong>Earth</strong>Viewer app for iPad. We were happy to<br />
offer our second silent auction (thanks to Michelle Harris and Kimberly Warschaw, who organized<br />
the auction, as well as those that donated resources to the auction!), at which we were able to raise<br />
over $900 for NESTA! Thanks so much to our sponsors, including HHMI, Carolina Biological, and<br />
the American Geosciences Institute, who together provided support for the reception, which is the<br />
most costly event in NESTA’s schedule of events at NSTA!<br />
On Saturday, our lunchtime lecture given by Dr. Mark Nielsen of HHMI focused on If <strong>The</strong>se<br />
Rocks Could Talk: <strong>Earth</strong>’s Climate in the Deep Past. Last year we decided that including a ticketed<br />
luncheon was making it difficult for teachers to attend (due to the cost of the luncheons) so we<br />
instead decided to refer to it as a “Lunchtime Lecture”, and encourage people to bring their lunches.<br />
We were delighted that this approach appeared to work, and over 50 people were able to enjoy the<br />
lecture and find out about the excellent resources offered by HHMI.<br />
Our Rock and Mineral Raffle, on Saturday afternoon, was as usual a great success, with lots of<br />
happy winners! We had well over 50 specimens available, as well as many give-aways donated by<br />
generous individuals. <strong>The</strong> raffle raised over $1500 for NESTA, and was attended by over 100 participants.<br />
Thanks to Parker Pennington and Kimberly Warschaw for their efforts in so successfully<br />
organizing the Rock and Mineral Raffle, as well as to all the generous donations from individuals<br />
and organizations.<br />
Our events in San Antonio closed on Saturday with the Annual NESTA Membership Meeting.<br />
<strong>The</strong> hardy 20+ attendees heard about NESTA plans for the coming year, and shared their insights<br />
about what we should do in the coming year.<br />
In addition to our events at the conference, NESTA also had a booth in the Exhibit Hall, which was<br />
well visited, and was responsible for generating an additional ~40 NESTA memberships (in addition<br />
to the ~40 people who joined in our main presentation room), this in addition to merchandise<br />
sales. A huge “Thank You” to NESTA’s Administrator, Marlene DiMarco, who put up and took<br />
down the booth, and also was chiefly responsible for<br />
shipping back resources from the conference. Marlene<br />
was the mainstay of the staff at the booth (doing an<br />
Check Out HHMI-BioInteractive’s excellent<br />
resources for teachers at the following links:<br />
EXCELLENT job), and we are thankful that several<br />
n <strong>Earth</strong>Viewer http://www.hhmi.org/<br />
individuals also volunteered to help out in the booth,<br />
biointeractive/earthviewer/index.html<br />
including John Herrold, Gail Gant, Tina Harris, and<br />
Denise Smith.<br />
n Changing Planet lecture series<br />
As you can see, putting the NESTA program on at the<br />
NSTA National Conference is a major undertaking,<br />
requiring the support of many individuals and organizations.<br />
Thanks to everyone that made this possible,<br />
and we look forward to another successful conference<br />
next Spring!<br />
Best Regards,<br />
Dr. Roberta Johnson<br />
Executive Director, NESTA<br />
n<br />
n<br />
http://www.hhmi.org/biointeractive/<br />
earth_history/<br />
Paleoclimate, geologic history of<br />
O 2 , and deep history of life on earth<br />
interactive features http://www.hhmi.org/<br />
biointeractive/click/index.html<br />
<strong>The</strong> Day the Mesozoic Died short film<br />
http://www.hhmi.org/biointeractive/<br />
shortfilms/<br />
© 2013 National <strong>Earth</strong> Science Teachers Association. All Rights Reserved.
Volume XXIX, Issue 2<br />
Page 5<br />
Editor’s Corner<br />
Welcome to the third special issue of <strong>The</strong> <strong>Earth</strong> <strong>Scientist</strong> sponsored by the Penn State<br />
TESSE team! Transforming <strong>Earth</strong> System Science Education (TESSE) was funded<br />
by the National Science Foundation (NSF GEOTeach Award #0631377) with <strong>The</strong><br />
Pennsylvania State University as one of four institutions involved in intensive and<br />
sustained teacher professional development, targeting the teaching and learning of<br />
<strong>Earth</strong> system science.<br />
In the summers of 2011 and 2012, with funding from a Targeted Math Science<br />
Partnership (MSP) grant (NSF Award #DUE-0962792), we welcomed middle and high<br />
school <strong>Earth</strong> and Space science teachers from partner school districts in Pennsylvania<br />
for summer workshops in plate tectonics, solar system astronomy, energy production,<br />
and climate change. Our Penn State <strong>Earth</strong> and Space Science Partnership (ESSP)<br />
presented each discipline-based workshop with a common pedagogical approach<br />
including content storyline, formative assessment, and claims-evidence-reasoning.<br />
In addition to our summer workshop offerings, we encourage teachers to pursue<br />
other avenues of professional development. Certainly, publishing curricular innovations<br />
in <strong>The</strong> <strong>Earth</strong> <strong>Scientist</strong> not only empowers teachers but helps to elevate the<br />
teaching profession and provide a voice for advocacy in the discipline (see Guertin and<br />
Furman, 2013). We have worked hard alongside teachers to establish and sustain the<br />
Pennsylvania <strong>Earth</strong> Science Teachers Association (PAESTA, http://www.paesta.org/),<br />
the Pennsylvania chapter of NESTA. PAESTA offers the opportunity for leadership<br />
and engagement for the teaching community online and at our annual conference.<br />
<strong>The</strong> articles featured in this issue reflect the enthusiasm, hard work and success of the<br />
teachers and Penn State project leaders in developing quality classroom activities and<br />
professional development opportunities available through PAESTA. We hope you will<br />
enjoy these articles, incorporate some of these innovative ideas and resources into your<br />
own classroom, and join up in supporting PAESTA and NESTA!<br />
Penn State TESSE and ESSP Project Leaders and Guest Writers of this Editor’s Corner –<br />
Tanya Furman, Laura Guertin<br />
Tom Ervin<br />
TES Editor<br />
Citation<br />
Guertin, L., & T. Furman (2013). Mentoring middle school and high school <strong>Earth</strong> science<br />
teachers to publish. In the Trenches, 3(1): 4-5.<br />
HELP WANTED!<br />
NESTA needs you to help run our events at the 2013 Fall NSTA Area<br />
Conferences in Portland, Charlotte and Denver. We need volunteers to help<br />
with our Share-a-thons and Rock Raffles. If you feel that you can help, contact<br />
Joe Monaco, NESTA Volunteer Coordinator: monacoj@aol.com<br />
<strong>The</strong> <strong>Earth</strong> <strong>Scientist</strong><br />
EDITOR<br />
Tom Ervin<br />
PUBLICATIONS COMMITTEE<br />
Linda Knight, Chair<br />
Tom Ervin, TES Editor<br />
Parker Pennington IV<br />
Howard Dimmick<br />
Ardis Herrold<br />
Missy Holzer<br />
Richard Jones<br />
CONTRIBUTING AUTHORS<br />
Lauren Beal, Meredith Hill Bembenic, Bryan<br />
Brightbill, Greg Collins, Abigail Dufoe, Alice<br />
Flarend, Tanya Furman, Laura Guertin, Jennifer<br />
Hoffman, Kelly Hunter, <strong>The</strong>resa Lewis-King,<br />
Peter Licona, Scott McDonald, Christopher<br />
Palma, Megan Pickard, Eliza Richardson, Seyed<br />
Mehdi Kamali Shahri, Heather Spotts<br />
<strong>The</strong> <strong>Earth</strong> <strong>Scientist</strong> is the journal of the<br />
National <strong>Earth</strong> Science Teachers Association<br />
(NESTA).<br />
<strong>The</strong> <strong>Earth</strong> <strong>Scientist</strong> is published quarterly (January,<br />
March, June, September) and distributed to<br />
NESTA members. Back issues of <strong>The</strong> <strong>Earth</strong><br />
<strong>Scientist</strong> are available for sale through the NESTA<br />
Office for $10 per copy.<br />
Advertising is available in each issue of <strong>The</strong> <strong>Earth</strong><br />
<strong>Scientist</strong>. If you wish to advertise, visit http://www.<br />
nestanet.org/cms/content/publications/tes/<br />
advertising.<br />
To become a member of NESTA visit www.<br />
nestanet.org.<br />
To get more information about NESTA or<br />
advertising in our publications, or to get copies<br />
of back issues, contact the NESTA Office at<br />
720-328-5351 or marlene.dimarco@gmail.com<br />
Copyright © 2013 by the National <strong>Earth</strong> Science<br />
Teachers Association. All rights thereunder<br />
reserved; anything appearing in <strong>The</strong> <strong>Earth</strong> <strong>Scientist</strong><br />
may not be reprinted either wholly or in part<br />
without written permission.<br />
DISCLAIMER<br />
<strong>The</strong> information contained herein is provided as<br />
a service to our members with the understanding<br />
that National <strong>Earth</strong> Science Teachers Association<br />
(NESTA) makes no warranties, either expressed<br />
or implied, concerning the accuracy, completeness,<br />
reliability, or suitability of the information.<br />
Nor does NESTA warrant that the use of this<br />
information is free of any claims of copyright<br />
infringement. In addition, the views expressed in<br />
<strong>The</strong> <strong>Earth</strong> <strong>Scientist</strong> are those of the authors and<br />
advertisers and may not reflect NESTA policy.<br />
DESIGN/LAYOUT<br />
Patty Schuster, Page Designs<br />
Printed and bound by<br />
Scotsman Press, Syracuse, NY on recycled<br />
paper using soy ink.<br />
© 2013 National <strong>Earth</strong> Science Teachers Association. All Rights Reserved.
Page 6<br />
<strong>The</strong> <strong>Earth</strong> <strong>Scientist</strong><br />
NESTA<br />
Membership<br />
Dues Structure<br />
Basic Membership (US<br />
and International) –<br />
includes access to the<br />
online version of <strong>The</strong> <strong>Earth</strong><br />
<strong>Scientist</strong>, E-News, special<br />
e-mailings, access to<br />
member-only sections of<br />
the website, and full voting<br />
privileges.<br />
• One year – $30<br />
• Two years – $60<br />
• Three years – $90<br />
Membership with Print<br />
Supplement (US) –<br />
includes both printed and<br />
access to online versions<br />
of <strong>The</strong> <strong>Earth</strong> <strong>Scientist</strong>,<br />
E-News, special e-mailings,<br />
access to member-only<br />
sections of the website,<br />
and full voting privileges.<br />
• One year – $50<br />
• Two years – $95<br />
• Three years – $140<br />
Membership with Print<br />
Supplement (Mexico and<br />
Canada) – same benefits<br />
as NESTA Membership with<br />
Print Supplement.<br />
• One year – $60<br />
• Two years – $115<br />
• Three years – $170<br />
Domestic Library Rate –<br />
includes print copies of <strong>The</strong><br />
<strong>Earth</strong> <strong>Scientist</strong> only, and<br />
does not include NESTA<br />
membership<br />
• One year – $70<br />
Windows to the Universe<br />
Educator Membership –<br />
provides access to special<br />
capabilities and services on<br />
NESTA’s premier <strong>Earth</strong> and<br />
Space Science Education<br />
website available at http://<br />
windows2universe.org,<br />
available for only $10/year<br />
for NESTA members (50%<br />
off the non-NESTA rate).<br />
Join today!<br />
NESTA Awards Presented in<br />
San Antonio<br />
By Tom Ervin, Dr. Richard Jones, and Parker O. Pennington, IV<br />
4/12/2013 – <strong>The</strong> National <strong>Earth</strong> Science Teachers Association (NESTA) is a volunteer based organization.<br />
We depend upon the efforts of our volunteers, and the support of our sponsors to make<br />
possible the services we provide. Each year, at the NSTA National Conference on Science Education,<br />
NESTA makes a special effort to recognize those who give of themselves for the betterment of<br />
NESTA. This year, in San Antonio, the following people and organizations were so recognized:<br />
Certificates of Appreciation were presented to the following individuals or organizations:<br />
n<br />
n<br />
American Geophysical Union (AGU) for their continuing sponsorship of NESTA’s ads in<br />
the NSTA Program and NSTA Reports at the Diamond Sponsorship Level, their support for<br />
the AGU Lecture, their support for and collaboration on the AGU-NESTA GIFT Workshops<br />
at the Fall AGU Conference, and for the Union’s Founding Partnership with Windows to the<br />
Universe<br />
Geoff Camphire, American Geosciences Institute (AGI) for sponsorship of NESTA’s Friends<br />
of <strong>Earth</strong> Science Reception at the Silver Sponsorship Level, providing 50, 2012 <strong>Earth</strong> Science<br />
Week Packets to NESTA members and <strong>Earth</strong> Science week posters for the Fall issue of <strong>The</strong><br />
<strong>Earth</strong> <strong>Scientist</strong>, and its support as a Founding Partner with Windows to the Universe<br />
n American Meteorological Society (AMS) for sponsorship of NESTA’s events at the 2013<br />
NSTA National Conference in San Antonio at the Platinum Sponsorship Level<br />
n<br />
n<br />
n<br />
n<br />
n<br />
n<br />
n<br />
n<br />
Ball Aerospace Technologies for sponsorship of NESTA’s events at the 2013 NSTA National<br />
Conference in San Antonio at the Silver Sponsorship Level<br />
Carolina Biological for sponsorship of NESTA’s Friends of <strong>Earth</strong> Science Reception at the<br />
Silver Sponsorship Level and their support in the form of material donations to the NESTA<br />
Rock and Mineral Raffle and Silent Auction<br />
Chandra X-Ray Observatory for their sponsorship of the Spring 2012 issue of <strong>The</strong> <strong>Earth</strong><br />
<strong>Scientist</strong> and for contributions of inserts for this issue<br />
Learn More About Climate, Climate and Energy Educators for their continued loyal advertising<br />
in <strong>The</strong> <strong>Earth</strong> <strong>Scientist</strong> in 2012<br />
Deep <strong>Earth</strong> Academy for their support of NESTA’s Share-a-Thon events at the 2013 NSTA<br />
San Antonio Conference<br />
Dr. Andrew Dressler of Texas A&M University for presenting the AGU Lecture, “<strong>The</strong> Climate<br />
Science Debate: What Does the Science Tell Us and Why People on Both Sides Are So Angry<br />
About It” at the 2013 NSTA Conference in San Antonio<br />
<strong>Earth</strong> Science Information Partners (ESIP) for their financial support of NESTA’s Share-a-<br />
Thons at the 2013 NSTA San Antonio Conference<br />
<strong>Earth</strong> & Space Models, GeoBlox for their continued loyal advertising in <strong>The</strong> <strong>Earth</strong> <strong>Scientist</strong><br />
in 2012<br />
© 2013 National <strong>Earth</strong> Science Teachers Association. All Rights Reserved.
Volume XXIX, Issue 2<br />
Page 7<br />
n Howard Hughes Medical Institute (HHMI) for sponsorship of NESTA’s events at the 2013<br />
NSTA National Conference at the Platinum Sponsorship Level<br />
n<br />
n<br />
n<br />
n<br />
n<br />
n<br />
n<br />
n<br />
n<br />
John Taber, Incorporated Research Institutions for Seismology (I.R.I.S.) for their financial<br />
support of NESTA’s Share-a-Thons at the 2013 NSTA San Antonio Conference<br />
What If? Scientific, Leave Only Bubbles for their continued loyal advertising in <strong>The</strong> <strong>Earth</strong><br />
<strong>Scientist</strong> in 2012<br />
National Oceanic and Atmospheric Administration (NOAA) for their<br />
financial support of NESTA’s Fall 2012 – Spring 2013 Professional<br />
Development Program<br />
Dr. Mark Nielson Science Education Fellow of the Howard Hughes<br />
Medical Institute for presenting the NESTA Luncheon Lecture, “If<br />
<strong>The</strong>se Rocks Could Talk: <strong>Earth</strong>’s Climate in the Deep Past” at the<br />
2013 NSTA Conference in San Antonio<br />
Peg Steffen, NOAA of NOAA, for poster contributions to the Summer<br />
and Winter 2012 issues of <strong>The</strong> <strong>Earth</strong> <strong>Scientist</strong><br />
Northrup Grumman for their support of NESTA’s <strong>Earth</strong> System<br />
Science Share-a-Thon at the 2013 NSTA Conference in San Antonio<br />
<strong>The</strong> Owners Manual, Passport to Knowledge <strong>Earth</strong> – T.O.M. for their<br />
continued loyal advertising in <strong>The</strong> <strong>Earth</strong> <strong>Scientist</strong> in 2012<br />
<strong>The</strong> Edge Of Kauai (T.E.O.K.) Tours for their continued loyal advertising<br />
in <strong>The</strong> <strong>Earth</strong> <strong>Scientist</strong> in 2012<br />
Simulation Curriculum, <strong>The</strong> Layered <strong>Earth</strong> for their continued loyal<br />
advertising in <strong>The</strong> <strong>Earth</strong> <strong>Scientist</strong> in 2012<br />
John Taber receiving IRIS’s<br />
Certificate of Appreciation from<br />
NESTA President Missy Holzer<br />
(left) and Executive Director Dr.<br />
Roberta Johnson (right).<br />
n<br />
Universities Space Research Association (URSA) for their financial<br />
support of NESTA’s Share-a-Thons at the Silver Sponsorship Level for<br />
the 2013 NSTA San Antonio Conference<br />
Certificates of Service were presented to the following NESTA members who, during the past year,<br />
contributed to the well being of NESTA:<br />
Geoff Camphire receiving AGI’s<br />
Certificate of Appreciation.<br />
n Ann Brown For service as Receiver at the NSTA National Conference in San Antonio, 2013<br />
n<br />
n<br />
n<br />
n<br />
n<br />
Eddie Cohen for service as the North Central Regional Director on the Board of Directors,<br />
2012-201<br />
Tom Ervin for help presenting NESTA’s events at the NSTA National Conference in San<br />
Antonio and for his continued service as TES Editor<br />
Michelle Harris for organizing NESTA’s Share-a-Thons in Fall 2012 – Spring 2013 and for<br />
help presenting NESTA’s workshops and events at the Atlanta NSTA Regional Conference in<br />
2012 and National conference in San Antonio in Spring 2013<br />
Chad Heinzel for service as the Central Regional Director on the Board of Directors,<br />
2011-2013<br />
Ardis Herrold for help presenting NESTA’s workshops and events at the Atlanta and<br />
Louisville NSTA Regional Conferences in 2012 and the Spring 2013 Conference in<br />
San Antonio<br />
© 2013 National <strong>Earth</strong> Science Teachers Association. All Rights Reserved.
Page 8<br />
<strong>The</strong> <strong>Earth</strong> <strong>Scientist</strong><br />
n<br />
n<br />
n<br />
Dr. Roberta Johnson for coordinating NESTA’s programs at the NSTA Fall 2012 Regional<br />
and Spring 2013 National Conference, organizing and leading workshops at these conferences,<br />
and for providing major financial support of all of NESTA’s programs through the<br />
Windows to the Universe project<br />
Dr. Richard Jones for help presenting NESTA’s workshops and events at the Phoenix NSTA<br />
Regional Conference in 2012 and for his continued service as ENews Editor<br />
Kurtis Koll for service as the South Central Regional Director on the Board of Directors,<br />
2011-2013<br />
n Randal Mandock for service as Receiver at the NSTA Area Conference in Atlanta, 2012<br />
n<br />
n<br />
n<br />
Dr. Michael Passow for help presenting NESTA’s workshops and events at the Louisville NSTA<br />
Regional Conference in 2012 and the National Conference in San Antonio in Spring 2013<br />
Parker Pennington, IV for help presenting NESTA’s workshops and events at the at the<br />
Atlanta NSTA Regional Conference in 2012 and the Spring 2013 Conference in San Antonio<br />
Gary Potter for service as Receiver, and at our events at the NSTA Area Conference in<br />
Louisville, 2012<br />
n Gilles Reimer for service as the New York Regional Director on the Board of Directors, 2011-<br />
2013 and for representing NESTA at the Fall 2012 STANYS Conference<br />
n<br />
Wendy Van Norden (2) for help presenting NESTA’s workshops and events at the at the<br />
Phoenix NSTA Regional Conference in 2012 and the Spring 2013 Conference in San<br />
Antonio for service as the Far West Regional Director on the Board of Directors, 2011-2013<br />
n Pam Wiffin (2) for assistance at the NSTA Area Conference in Phoenix, 2012<br />
n For service as the Southwest Regional Director on the Board of Directors, 2011-2013<br />
<strong>The</strong> Thomas B. Ervin Distinquished Service Award is presented to officers and volunteers<br />
who provide dedicated service to NESTA. In San Antonio, this Recognition was presented to the<br />
following NESTA members.<br />
n<br />
n<br />
n<br />
Ronald Fabich for Services Rendered in the Promotion of <strong>Earth</strong> Science Education, and<br />
Service to NESTA<br />
Ardis Herrold for Services Rendered in the Promotion of <strong>Earth</strong> Science Education, and<br />
Service to NESTA<br />
Missy Holzer for Services Rendered in the Promotion of <strong>Earth</strong> Science Education, and<br />
Service to NESTA<br />
Ardis Herrold receiving her Thomas B. Ervin-DSA Certificate.<br />
Missy Holzer receiving her DSA Certificate.<br />
© 2013 National <strong>Earth</strong> Science Teachers Association. All Rights Reserved.
Volume XXIX, Issue 2<br />
Page 9<br />
Parker Pennington receiving his DSA Certificate.<br />
Kim Warschaw receiving her DSA Certificate.<br />
n<br />
n<br />
n<br />
n<br />
Dr. Richard Jones for Services Rendered in the Promotion of <strong>Earth</strong> Science Education, and<br />
Service to NESTA<br />
Joe Monaco for Services Rendered in the Promotion of <strong>Earth</strong> Science Education, and Service<br />
to NESTA<br />
Parker Pennington, IV for Services Rendered in the Promotion of <strong>Earth</strong> Science Education,<br />
and Service to NESTA<br />
Kimberly Warschaw for Services Rendered in the Promotion of <strong>Earth</strong> Science Education, and<br />
Service to NESTA<br />
Fellows of the Association must have been members for at least five years and shall have contributed<br />
substantially and with excellence to <strong>Earth</strong> Science education and to NESTA itself. In San<br />
Antonio, this Recognition was presented to the following NESTA members.<br />
n<br />
n<br />
Lisa Alter In Recognition of Past Achievements and Contributions to the Goals of the<br />
Association<br />
Carl Katsu In Recognition of Past Achievements and Contributions to the Goals of the<br />
Association<br />
<strong>The</strong> Jan Woerner and Harold B. Stonehouse Award for Lifetime Achievement<br />
This Award, named in honor of NESTA’s first President, Janet J. Woerner, and its first Executive<br />
Advisor, Harold B. Stonehouse, is given at the discretion of the NESTA Executive Committee in<br />
recognition of an individual or organization’s lifetime effort in promoting <strong>Earth</strong> Science Education<br />
in keeping with the goals of NESTA. This award includes a plaque and a lifetime NESTA membership.<br />
This Award is NESTA’s highest form of recognition. In our entire history this award has<br />
only been presented to 7 individuals, and one organization, the Michigan <strong>Earth</strong> Science Teachers<br />
Association (MESTA). This year, in San Antonio, it was presented to two individuals. <strong>The</strong> extent<br />
of their importance to NESTA and their impact on <strong>Earth</strong> Science Education can be seen in the<br />
wording of their respective plaques:<br />
n<br />
n<br />
Sharon Stroud In Recognition Of Her Many Years Of Dedication And Service To NESTA,<br />
In Particular, Her Inspired Genius During NESTA’s Early Years When As President, She<br />
Originated <strong>The</strong> Share-a-thons, Rock Raffles, And President’s Reception.<br />
K Rod Cranson In Recognition Of His Many Years Of Dedication And Service To <strong>Earth</strong><br />
Science Education, In Particular, His 1967 Founding Of <strong>The</strong> Michigan <strong>Earth</strong> Science<br />
Teachers Association, Which Became <strong>The</strong> Template For <strong>The</strong> 1983 Founding Of NESTA.<br />
© 2013 National <strong>Earth</strong> Science Teachers Association. All Rights Reserved.
Page 10<br />
<strong>The</strong> <strong>Earth</strong> <strong>Scientist</strong><br />
Introduction to Using the<br />
Claims‐Evidence-Reasoning<br />
Framework in<br />
Middle School Science<br />
Heather Spotts, Bellefonte Area Middle School<br />
Lauren Beal, AMY Northwest Middle School<br />
Abstract<br />
This article reports on the Claims-Evidence-Reasoning (CER) framework for scientific<br />
explanation in two different middle school classroom environments. Initial implementation<br />
of this methodology brought immediate successes and challenges in both sixth and<br />
eighth grade classrooms. No differential struggles were observed across the grade levels<br />
explored here, as both groups faced the same challenges with adopting this new method<br />
for doing and describing science. It is expected that with the introduction of the CER<br />
framework at the lower grades this picture will change, as students who employ the framework<br />
grow rapidly in their abilities and could be expected to show greater facility over time.<br />
Effective strategies for improving quality of student explanations in the science classroom<br />
include structured peer review and exchanges of ideas among students. Incorporating the<br />
CER framework resulted in substantial observed improvements in student engagement,<br />
argumentation and use of evidence in class discussions.<br />
Introduction<br />
<strong>The</strong> National Science Education Standards (National Research Council, 1996) and Benchmarks for Science<br />
Literacy (American Association for the Advancement of Science, 1993, 2009) advocate the importance<br />
of scientific explanations in K-12 classrooms. <strong>The</strong> process of engaging students in scientific<br />
explanation has been shown to help them to better understand science concepts, to reason logically,<br />
to use evidence to support claims, and to both consider and critique alternative explanations as part<br />
of understanding the nature of science (McNeill and Krajcik 2012). This approach is supported in<br />
the writing strand of the Common Core State Standards Initiative English Language Arts which<br />
highlights that students should be able to write scientific arguments based upon claims, evidence,<br />
and reasoning (Common Core State Standard, 2010).<br />
Constructing scientific explanations can be challenging for students and requires multiple guided<br />
opportunities to practice. <strong>The</strong> Claims-Evidence-Reasoning (CER) framework presents an explicit method<br />
of teaching students how to write and use scientific explanations in the classroom (McNeill and Krajcik,<br />
2012). It mirrors the Claim-Data-Warrant model for analyzing arguments and open-ended scenarios<br />
(Toulmin, 1958) employed in English and Social Studies classrooms. This more recent application to the<br />
science classroom reflects an increasing desire to incorporate inquiry-based and problem-based learning<br />
strategies that require students to formulate interpretations rather than simply generating data and<br />
recording them on worksheets while trying to answer prescribed questions.<br />
© 2013 National <strong>Earth</strong> Science Teachers Association. All Rights Reserved.
Volume XXIX, Issue 2<br />
Page 11<br />
<strong>The</strong> framework’s three components are: (1) the Claim, a statement that answers a scientific question;<br />
(2) the Evidence, a summary of the quantitative and qualitative data that support the claim;<br />
and (3) the Reasoning, a logical discussion of the underlying scientific concept or principle that<br />
connects the claim and the evidence. <strong>The</strong> CER framework allows students to move effectively from<br />
analyzing collected data to formulating a conclusion because emphasis is placed on making sense<br />
of the data and delving deeply into the scientific concepts that explain what is happening in the<br />
activity. Students are encouraged to think critically and challenge each other’s ideas in the pursuit<br />
of scientific understanding.<br />
Initial Implementation<br />
<strong>The</strong> authors were introduced to the CER model during summer workshops sponsored by the <strong>Earth</strong><br />
Science Space Partnership (ESSP) though the Pennsylvania State University. ESSP is a collaborative<br />
project among Penn State scientists and science educators, along with practicing teachers from<br />
seven school districts across Pennsylvania. During the week-long workshops, the teachers received<br />
instruction in CER and practiced using the framework. In the subsequent school year, they began<br />
adapting existing science activities to this new model. This article reports on the successes and challenges<br />
that were experienced, and outlines strategies that were found helpful for the students and<br />
the authors.<br />
During the first weeks of the school year, two classrooms of middle school students (reported on<br />
in this article) received direction instruction in the framework and on its importance. In the urban<br />
eighth grade classroom, students received initial direct instruction on the entire framework using<br />
non-science examples, and followed this instruction with several opportunities to use the entire<br />
framework during subsequent inquiry lab investigations. In the rural sixth grade classroom, the<br />
students were initially introduced to the entire framework, but then focused on framework components<br />
individually through science inquiry labs.<br />
Figure 1. Sample work from a<br />
6 th grade student using Claims,<br />
Evidence and Reasoning<br />
(CER) one month after the first<br />
classroom introduction to this<br />
approach.<br />
Photo by Heather Spotts.<br />
In both classrooms, the scientific questions were provided to the<br />
students. Students then conducted the investigations that led to<br />
development of claims and evidence. Working in small groups, the<br />
students made claims, which they shared with the class while the<br />
teacher recorded a class consensus. Any discrepancies among claims<br />
led to discussion of supporting evidence. This guided discussion<br />
allowed the teachers to reinforce the components of the framework;<br />
many students struggled to understand the meaning of “evidence”.<br />
As an example, in an activity that involved measuring angles of light<br />
incidence and reflection from shining a laser pointer on a reflective<br />
surface, one sixth grader stated simply “the data was our evidence”.<br />
<strong>The</strong> teacher first guided the student to both realize and articulate the<br />
observation that the angles measured were the same in both cases. She<br />
then helped the student build on that observation by verbalizing that<br />
the numbers in the “Angle of Incidence” column were the same as the<br />
numbers in the “Angle of Reflection” column. Through this process,<br />
the student was then able to describe and codify her understanding<br />
that the angle of incidence equals the angle of reflection. <strong>The</strong> need for<br />
this type of conversation reinforced the chosen approach of providing<br />
the questions, for often students can easily become overwhelmed or<br />
distracted by trying the CER approach without ample scaffolding.<br />
© 2013 National <strong>Earth</strong> Science Teachers Association. All Rights Reserved.
Page 12<br />
<strong>The</strong> <strong>Earth</strong> <strong>Scientist</strong><br />
Although appropriate questions were provided to the students, the<br />
authors noticed an increase in student inquisitiveness; students<br />
quickly showed growth in their ability to develop their own questions.<br />
In the sixth grade classroom, in just one period of class,<br />
students developed a series of questions that addressed nearly all<br />
of the concepts that the teacher had already planned for the entire<br />
unit. A posted inquiry chart recording student-designed questions<br />
for future investigations was quickly filled. In the instance<br />
of the sixth grade classroom, a GoogleDoc was generated so that<br />
the faculty and graduate students of Penn State could correspond<br />
with the teacher to help answer the more difficult student questions.<br />
<strong>The</strong> authors used these student-generated questions to guide<br />
subsequent investigations.<br />
Figure 2. Throughout the unit,<br />
students posed over 700 thought<br />
provoking questions on this class<br />
“Parking Lot”. <strong>The</strong> shared efforts<br />
of the 6 th grade students, the<br />
teacher, Penn State University<br />
graduate students and faculty<br />
members helped answer all of<br />
these questions.<br />
Photo by Heather Spotts.<br />
Initial Successes and Challenges<br />
<strong>The</strong> authors noticed students’ quick grasp of the concept of a<br />
“claim”. <strong>The</strong> majority of students were soon able to write their own<br />
claims, or to respond with a clear statement in answer to a specific<br />
scientific question. <strong>The</strong> authors also witnessed an improvement<br />
in students’ choice of evidence as they began to recognize and<br />
verbalize the power of multiple sources of evidence in their explanations.<br />
When prompted for evidence, a small number of sixth<br />
and eighth grade students initially did struggle with the need to provide enough specific evidence to<br />
support their claims. Some students, like the one quoted earlier, initially recorded “the data chart”<br />
or “the experiment.” Once guided through the process, however, their ability to recognize and cite<br />
appropriate evidence improved rapidly. <strong>The</strong> majority of students in both the sixth and eighth grade<br />
classrooms struggled with the “reasoning” component of the framework. In many cases, students<br />
simply wrote a concluding sentence to end their explanation rather than constructing a paragraph<br />
based on reasoning. This aspect of the framework is the most challenging as well as the most<br />
fundamental to the practice of science, and the authors developed the following strategies to help<br />
students improve their ability to reason and evaluate their evidence critically.<br />
Strategies to Improve Quality of Student Scientific Explanations<br />
After the initial introduction and first uses of CER in their classrooms, the authors engaged in<br />
several guided activities aimed at improving student use of the framework. <strong>The</strong>se strategies are<br />
outlined below, with suggestions given in regard to timeline, process, result and potential challenges<br />
of each approach. In each of these activities, the teacher acted as the facilitator, using appropriate<br />
opportunities to re-teach and reinforce specific components while primarily guiding student discussion<br />
around use of the framework.<br />
Peer Review<br />
A peer review activity was designed to model constructive feedback among students and to challenge<br />
them to provide specific feedback that went beyond “good job” or “work on your claim.” In<br />
this peer review activity, the teacher reviewed the CER framework as a whole class lesson, and after<br />
completing a lab, guided students through two student group examples of CER. <strong>The</strong> teacher chose<br />
to focus specifically on the reasoning component, as this was the main area of weakness across the<br />
grade. Students then worked in collaborative groups to analyze one or more CER write-ups and<br />
© 2013 National <strong>Earth</strong> Science Teachers Association. All Rights Reserved.
Volume XXIX, Issue 2<br />
Page 13<br />
presented their feedback to the whole class. After engaging in a class discussion about the suggested<br />
feedback, students returned to their original lab groups and revised their own initial CER responses.<br />
While the peer review activity might not be done every time, there is value in using this instructional<br />
strategy after all the students have written their first CER report, and then requiring submission of<br />
a revised document based on feedback. In this situation, the authors<br />
noticed a significant improvement in the revised CER reports, especially<br />
in the area of students’ reasoning. This strategy proved to<br />
be especially useful when targeting a specific aspect of the written<br />
report.<br />
Gallery Walk<br />
A gallery walk activity provided students with the opportunity to<br />
see a variety of student responses and again practice constructive<br />
feedback. In this gallery walk activity, the teacher started the lesson<br />
by reviewing the CER framework. Students worked in pairs to write a<br />
CER report using data from a recent lab. <strong>The</strong> student responses were<br />
posted on chart paper and displayed around the room. <strong>The</strong> teacher<br />
modeled procedures and constructive feedback. With their partner,<br />
students took a “gallery walk” around the room and used sticky<br />
notes to provide feedback for the posted CER reports. <strong>The</strong> lesson<br />
concluded with a whole class discussion and a self-reflection about the activity.<br />
After facilitating several Gallery Walk activities, the authors witnessed continued improvement in<br />
students’ ability to evaluate peer responses and to provide constructive feedback. Students’ selfreflections<br />
also revealed the additional benefit of seeing their work in comparison to others. One<br />
of the eighth graders wrote, “I thought ours was good until I saw everybody else’s. Now I see what<br />
everybody means when they said we didn’t give enough evidence and our claim wasn’t clear. We<br />
should have given more than two sources of evidence.”<br />
Figure 3. Students participating<br />
in a Gallery Walk activity.<br />
Photo by Lauren Beal.<br />
Board Meeting/Class Meeting<br />
Similar to a Gallery Walk, the Board Meeting is a class meeting activity that allows students the<br />
opportunity to engage in a whole class discussion about student CER responses. In this activity,<br />
each group wrote their CER report on chart paper. <strong>The</strong> groups displayed and shared their work<br />
with the rest of the class, looking for similarities, differences and errors. <strong>The</strong> teacher modeled<br />
appropriate guidelines for discussion, such as “I politely disagree because…” Students participated<br />
in critiquing their peers’ CER reports by questioning aspects of claims or evidence. <strong>The</strong> authors<br />
found the Board Meeting activity to be extremely effective in helping students identify the most<br />
appropriate CER components. <strong>The</strong> students quickly revealed an increased ability to notice errors,<br />
question their peers and engage in positive argumentation. Regardless of grade, students were<br />
engaged participants. <strong>The</strong> sixth grade students, however, required the teacher’s encouragement to<br />
establish a sense of ownership in the process, instead of immediately looking to the teacher for what<br />
was deemed as the correct answer. This was fostered further, by continually asking the students for<br />
their opinion, instead of quickly providing judgment.<br />
Cross-curricular Comparisons<br />
Throughout the first months of school, teachers and students engaged in conversations comparing<br />
and contrasting the construction of explanations in science to written responses in language arts,<br />
social studies and math. Upon introduction of the framework, the eighth grade students immediately<br />
drew parallels between the CER framework and the writing outline used in the language<br />
© 2013 National <strong>Earth</strong> Science Teachers Association. All Rights Reserved.
Page 14<br />
<strong>The</strong> <strong>Earth</strong> <strong>Scientist</strong><br />
About the<br />
Authors<br />
Lauren Beal is an eighth<br />
grade Science teacher at<br />
AMY Northwest Middle<br />
School in Philadelphia, PA.<br />
She received her Masters<br />
degree in Integrated<br />
Science Education<br />
from the University of<br />
Pennsylvania in spring<br />
2008. Lauren can be<br />
reached at lgbeal@<br />
philasd.org.<br />
Heather Spotts is a sixth<br />
grade Science teacher at<br />
Bellefonte Area Middle<br />
School, Bellefonte, PA. In<br />
December 2013, she will<br />
complete her master’s<br />
degree in Curriculum<br />
and Instruction with an<br />
emphasis in Language<br />
and Literacy Education at<br />
<strong>The</strong> Pennsylvania State<br />
University, University<br />
Park, PA. Heather<br />
can be reached at<br />
heatherspotts@gmail.com<br />
arts classrooms. This observation led to a discussion of the similarities and differences between<br />
providing data as evidence in science and giving supporting details in language arts. This discussion<br />
also helped to spotlight one potential difficulty the students had constructing their reasoning<br />
paragraphs. In language arts, students write a single concluding sentence, whereas with the CER<br />
frameworkthe reasoning component demands that students use their understanding of the underlying<br />
science principles to connect their claim and evidence.<br />
Results of CER Use in the Classroom<br />
After implementing CER during the first months of the school year, the authors found similar<br />
results in both the sixth and eighth grade classrooms. In the sixth grade classroom, a heightened<br />
level of awareness was evident from the number of recorded visits to the class website. This year, on<br />
the class website, the author posted all lab CER reports. In just one month, the site recorded more<br />
than 650 views, compared to fewer than 50 in the previous year. Parents also provided positive feedback<br />
about the framework during student conferences; many remarked they liked having the posted<br />
CER documents as a technique for them to see what students were doing in class, and as a study<br />
tool for their child.<br />
<strong>The</strong> authors observed an increased level of student inquisitiveness and a deeper understanding<br />
of the content. Both also witnessed a heightened demand for evidence from peers and discourse<br />
that reflected more highly structured arguments. In both classrooms, “What’s your evidence?” has<br />
become a common question asked by students to their own classmates. Student work samples<br />
in both grades from September through January show a steady improvement in student claims,<br />
evidence and reasoning.<br />
<strong>The</strong> authors’ report of the introduction of CER and subsequent challenges, successes and activities<br />
were based on the first five months of the 2012-2013 school year. As stated earlier, the authors noticed<br />
a significant increase in student engagement, focus on evidence, and heightened levels of argumentation.<br />
As this school year progresses, the authors will continue to make CER a focal point in their<br />
science classrooms and continue to document their challenges, successes and follow-up lessons. While<br />
it is noted that the authors’ claims of success are observational in nature, during in the 2013-2014<br />
academic year, the authors intend to measure student engagement through a quantitative analysis of<br />
pre and post-assessments. In a push for adoption of the framework in their own schools, the authors<br />
will continue to share with their colleagues, their very positive CER experiences.<br />
References<br />
American Association for the Advancement of Science. 1993. Benchmarks for science literacy. New York:<br />
Oxford University Press. 298-300.<br />
Common Core State Standard Initiative.2010. http://www.corestandards.org/ELA-Literacy/ RST/<br />
introduction<br />
McNeill, K.L. and Krajcik, J. 2012. Supporting Grade 5-8 Students in Constructing Explanations in Science: <strong>The</strong><br />
Claim, Evidence and Reasoning Framework for Talk and Writing. Boston, MA: Pearson Education. 2-42.<br />
National Research Council. 1996. National Science Education Standards. Washington, DC: National Academy<br />
Press.105-117.<br />
Toulmin, S. 1958. <strong>The</strong> uses of argument. Cambridge, UK: Cambridge University Press, 94-146.<br />
© 2013 National <strong>Earth</strong> Science Teachers Association. All Rights Reserved.
Volume XXIX, Issue 2<br />
Page 15<br />
An Instructional Unit on the<br />
Marcellus Shale for<br />
Middle School Students<br />
Meredith Hill Bembenic, <strong>Earth</strong> and Space<br />
Science Partnership, Pennsylvania State University<br />
Bryan Brightbill, Park Forest Middle School<br />
Seyed Mehdi Kamali Shahri, Department of Chemical<br />
Engineering, Pennsylvania State University<br />
Tanya Furman, Department of Geosciences, Pennsylvania<br />
State University<br />
Abstract<br />
Central Pennsylvania is an area rich in natural energy resources with a complex geologic<br />
history. Classroom investigations often focus on how the modern regional topography<br />
developed following formation of the Appalachian Mountains. <strong>The</strong> last ten years have<br />
seen tremendous interest in utilizing natural gas, especially from the Marcellus Shale,<br />
as an alternative to coal and petroleum for providing electricity and transportation fuel.<br />
This article presents a Marcellus Shale instructional unit spanning five instructional<br />
days as part of a cohesive <strong>Earth</strong> Science curriculum for middle school students in central<br />
Pennsylvania. Students investigate relevant geologic, environmental, and social issues<br />
for this particular natural gas formation along with energy exploration in general. <strong>The</strong><br />
Marcellus Shale instructional unit consists of readings, in-class instruction and activities<br />
that help students to connect this content with preceding and subsequent learning.<br />
Background/Introduction<br />
Widespread interest in the Marcellus Shale provides the opportunity to introduce several new <strong>Earth</strong><br />
system science concepts at the middle school level including: 1) clays as important sedimentary<br />
minerals, 2) hydrocarbon formation stemming from entrapment of organic material during sediment<br />
deposition, and 3) shale as an important sedimentary rock that has been deposited on passive<br />
margins (i.e., a transition between continental and oceanic crust that is not associated with a plate<br />
boundary). Students will also recognize that <strong>Earth</strong> system science extends below the surface to<br />
landscapes that cannot be seen. <strong>The</strong> unit is intended to connect with and transition to other lessons<br />
in the broader context of middle school <strong>Earth</strong> Science (e.g., rocks and minerals, geology and geography,<br />
global climate change), but can also be used as a stand-alone instructional unit.<br />
This unit was developed collaboratively by a graduate student and a postdoctoral researcher in<br />
the energy field (Kemali and Bembenic) in consultation with a middle school science teacher<br />
(Brightbill). Brightbill collaborated with other English and science teachers at his local school to<br />
design appropriate assessments based on the unit material that encourage integrative thinking<br />
across disciplines.<br />
© 2013 National <strong>Earth</strong> Science Teachers Association. All Rights Reserved.
Page 16<br />
<strong>The</strong> <strong>Earth</strong> <strong>Scientist</strong><br />
Unit Components and Implementation<br />
This article presents a five-day instructional unit organized to engage students in the scientific<br />
foundation of a topic that has widespread and far-reaching political and economic significance in<br />
many parts of the nation. <strong>The</strong> unit is organized around multiple instructional components:<br />
Day 1: Introductory slide-show evoking prior knowledge, followed by a hands-on activity to<br />
investigate the energy resource properties of local sedimentary rocks<br />
Day 2: Simulated hydrocarbon prospecting activity<br />
Day 3: Exploration of an online Marcellus information resource<br />
Day 4: Class discussion of benefits and challenges in energy exploration<br />
Day 5: Writing a position letter regarding hydrofracturing to extract natural gas<br />
<strong>The</strong> variety of activities allows students to become involved in constructing their own knowledge<br />
regarding our hydrocarbon-based natural resources. Some of the components lend themselves to<br />
stand-alone use, while others are best contextualized within a longer unit.<br />
Day 1: Geologic Formation of Sedimentary Rocks and Minerals<br />
Through prior learning and in-class discussion, students are reminded how shale forms, including<br />
the time scale of its formation. This step was carried out effectively by connecting this lesson to<br />
an immediately preceding unit on the geomorphology of central Pennsylvania (Ellis et al., 2009).<br />
Through use of a slide-show based discussion, the location of the Marcellus Shale resource play<br />
is introduced to the students so they can begin to identify the geological features and rock types<br />
associated with this formation. A resource play, often abbreviated as play, is a term used to describe<br />
large, known sources of gas trapped beneath the earth’s surface (Encana, 2013). A typical cross<br />
sectional map of central Pennsylvania geology was shown to the students with the location of the<br />
Marcellus Shale indicated. In addition to observing and describing important sedimentary rocks,<br />
students also made their own sedimentary rock using Epsom salt, water, gravel and sand (Rogers<br />
Group Inc., 2011). This activity focuses on lithification processes. In the first trial of this experiment,<br />
other mineral salts were substituted for Epsom salt, with limited success. Subsequent trials<br />
with Epsom salt have proven successful. <strong>The</strong> variation of grain size between gravel and sand leads to<br />
“rocks” with different pore spaces, which directly connects student thinking to the next section.<br />
Day 2: Hydrocarbon-Based Fuels and Formation<br />
<strong>The</strong> students read about different types of hydrocarbon fuels (i.e., fuels that primarily contain the<br />
elements hydrogen and carbon) such as natural gas, coal, and crude oil. Reading resources included<br />
description of the chemical and physical properties involved in the formation of these fuels via different<br />
geologic processes. Petroleum and natural gas are the primary focus of this part of the unit since the two<br />
form through similar processes and therefore share chemical and physical properties. <strong>The</strong> burial of the<br />
organic matter followed by its transformation into the different fuels and their migration underground<br />
is also discussed. In order to demonstrate the importance of pore space to the formation of reservoirs,<br />
reference is made to the rock formation activity of the previous day. Demonstration can even be made<br />
with those artificial rocks by pouring vegetable oil through them. Alternatively, if the rock formation<br />
activity has been omitted, an investigation of pore space can be done independently (Women in Mining<br />
Education Foundation, 2007). Either activity directly leads to discussion of the relationship between<br />
energy-bearing shales, sandstone reservoirs, and capstone rock formations. <strong>The</strong> role of shales in formation<br />
and entrapment of these hydrocarbons was also explored. Students viewed a map of Pennsylvania<br />
that showed the locations of various petroleum and natural gas fields. <strong>The</strong> many byproducts of hydrocarbons<br />
and their impacts on our daily lives were also discussed.<br />
© 2013 National <strong>Earth</strong> Science Teachers Association. All Rights Reserved.
Volume XXIX, Issue 2<br />
Page 17<br />
This reading, demonstration and discussion lays the foundation for an oil-prospecting activity<br />
targeted at allowing students to use critical thinking skills to identify where oil is most likely to be<br />
trapped. Depending on the type of hydrocarbon, different hydrocarbon exploration techniques are<br />
used. <strong>The</strong> activity is adapted from one used by Furman in a Pennsylvania State University introductory<br />
geosciences course and is available from http://www.paesta.psu.edu; a simplified version that<br />
introduces the concept of hydrocarbon migration can be found online (Kluge, 2013). Students first<br />
applied the skills from the prior unit (Ellis et al., 2009) in determining the arrangement, folding,<br />
and faulting of rock layers on a cross section that includes possible drilling locations. Students<br />
then choose where to distribute their investments ($50,000 in $10,000 lots) between the six possible<br />
wells. In addition to drawing in the layers and choosing the wells, students must provide to their<br />
theoretical investors, a justification for why they should invest in those locations. In the end, each<br />
well was given a value in oil that would be obtained there and distributed amongst those investors<br />
based on the number of lots put into that well (number of $10,000 investment increments). <strong>The</strong><br />
winning student is the one who makes the most profit, which could mean choosing a well that<br />
produced less but that was selected by fewer other investors.<br />
Day 3: Details of the Marcellus Shale Formation<br />
Next, more specifics about the Marcellus Shale Formation, including its broad geographic expanse,<br />
were presented and discussed. Compared to conventional natural gas removal, the natural gas<br />
from the Marcellus Shale Formation needs to be extracted using a different technique. Recent<br />
technological developments in hydraulic fracturing (a.k.a. fracking) and deep lateral drilling have<br />
allowed extraction from this formation to be possible, as well as economically feasible. Students<br />
spent a day learning about and discussing the technology involved in reaching the Marcellus Shale.<br />
This involved use of a video about horizontal well drilling and hydraulic fracturing, which can be<br />
obtained from the Marcellus Center for Outreach and Research (2010). Students explore the factors<br />
that make the Marcellus Shale Formation so different from conventional natural gas reservoirs and<br />
why different methods and technologies are required for removal. <strong>The</strong> authors are fortunate to have<br />
access to a local expert on Marcellus Shale who speaks about the rocks, the extraction processes and<br />
related environmental concerns.<br />
Day 4: Energy in the United States<br />
Students explored individually the website explore shale.org (Penn State Public Broadcasting,<br />
2011), which provides information about how water is used in fracking. Students learn about the<br />
consequences of removing natural gas using different methods and technologies, also, including<br />
water quality concerns involving the chemicals used in the fracking extraction process. Students<br />
are encouraged to consider and document how extracting and using natural gas from Marcellus<br />
Shale compares to extracting and using other energy sources, which aided them when preparing<br />
the upcoming assignment described in Day 5. After individual examination, the students, as a<br />
group, discuss their findings. This activity tied into a reading initiative at Brightbill’s school where<br />
students are taught a standardized way to read and annotate documents. Students were required to<br />
comment on 5 different aspects of the website, discuss them in small groups, and bring the biggest<br />
issue or two from each group to the whole class.<br />
<strong>The</strong> final component of the unit focuses more broadly on the different types and uses of energy<br />
sources in the United States. Students learn how different sources of energy (petroleum, natural<br />
gas, coal, nuclear and renewable options) are allocated, or assigned, to certain sectors in the United<br />
States like transportation and electricity, and how energy consumption has changed over time.<br />
For example, Figure 1 shows how petroleum, natural gas, coal, renewable sources and nuclear<br />
energy are allocated to the transportation and residential electricity sectors. <strong>The</strong> United States is<br />
© 2013 National <strong>Earth</strong> Science Teachers Association. All Rights Reserved.
Page 18<br />
<strong>The</strong> <strong>Earth</strong> <strong>Scientist</strong><br />
most dependent on petroleum for transportation needs, while<br />
the residential electricity sector has a diversified portfolio of<br />
energy sources. <strong>The</strong> concerns of using fossil fuels (i.e., greenhouse<br />
gas emissions) and the present day and future impacts<br />
on society were discussed. Supplemental information for this<br />
discussion, including descriptions of coal, petroleum and<br />
natural gas and their geographic distribution can be found in<br />
Bembenic et al. (2012) and at http://www.paesta.psu.edu/book/<br />
coal-and-energy-unit<br />
Figure 1.<br />
Day 5: Position statement on hydraulic fracturing<br />
On the final day of this unit, students were asked to apply their<br />
scientific understanding of energy resource distribution and<br />
extraction to the social and political arena. Each student wrote<br />
a one-page position statement regarding the appropriate regulation<br />
of hydraulic fracturing use in deep gas resource plays in the central Appalachians. <strong>The</strong> students<br />
were to choose a side and support it with at least 3 valid reasons. In Brightbill’s class, letters were<br />
written to Pennsylvania State Representative, Scott Conklin, but writing to other policy makers is<br />
equally valuable, including state, local and national officials in the energy and environmental fields.<br />
This activity promotes clear communication of scientific ideas, and has, for maximum impact, been<br />
implemented successfully as an assignment between science and language arts teachers.<br />
Conclusions/Lessons Learned<br />
This week-long unit regarding the Marcellus shale integrates several different strands of <strong>Earth</strong><br />
science learning, from sedimentary processes to formation of hydrocarbon resources which in<br />
turn are used as some of our primary sources of energy. It also opens the door for students to have<br />
informed opinions and discussions surrounding issues of societal and economic importance.<br />
Students completing this unit will learn to explore the science behind local political issues that play<br />
into national policy in the energy and environmental arenas. At the end of the unit, the students<br />
are empowered to develop a personal opinion based on, and supported by, factual and scientific<br />
evidence. It is important that these assignments be graded on the basis of the quality of evidencebased<br />
reasoning employed, not on the individual student’s opinion, so that the fundamental<br />
difference between prejudice and fact-based argumentation is preserved. It is hoped that students<br />
who master this skill in middle school will be able to translate the experience to other politicallycharged<br />
areas of their lives.<br />
References<br />
Annual Energy Review. 2011. Primary energy consumption by source and sector. Retrieved April 23, 2013, from<br />
http://www.eia.gov/totalenergy/data/annual/pdf/aer.pdf<br />
Bembenic, M.H., Cratsley, C.E., Hartwell, B., Guertin, L.and Furman, T. 2012. Adaptable inquiry-based<br />
activities about national patterns of coal and energy use. Science Scope, 35, 49-55.<br />
Ellis, J., Furman, T, McAninch, S. and Stout, H. 2009. Improving comprehension of geomorphic concepts<br />
through inquiry-based learning. <strong>The</strong> <strong>Earth</strong> <strong>Scientist</strong>, 25, 14-18.<br />
Encana. 2013. Glossary. Retrieved April 23, 2013, from http://www.encana.com/glossary.html<br />
Kluge, S. Physical geology subsurface geology and oil exploration. Retrieved February 19, 2013, from http://<br />
stevekluge.com/geoscience/apg/labs/subsurfaceexploration.pdf<br />
Marcellus Center for Outreach and Research. 2010. Hydraulic well drilling and hydraulic fracturing video.<br />
Retrieved February 19, 2013, from http://www.marcellus.psu.edu/resources/drilling/index.php<br />
Penn State Public Broadcasting. 2011. Explore shale. Retrieved January 4, 2012, from http://exploreshale.org<br />
© 2013 National <strong>Earth</strong> Science Teachers Association. All Rights Reserved.
Volume XXIX, Issue 2<br />
Page 19<br />
Rogers Group Inc. 2011.Sedimentary rock activity. Retrieved January 5, 2012, from http://rogersgroupinc.com/<br />
IndustryResources/Rockology101Activities/ActivitySedimentaryRock/tabid/105/Default.aspx<br />
Women in Mining Education Foundation.2007. Going places in those wide open spaces. Activities Database.<br />
Retrieved January 5, 2012, from http://www.womeninmining.org/activities/PORUSLAB.pdf<br />
About the Authors<br />
Meredith Hill Bembenic is a post-doctoral research associate with the <strong>Earth</strong> and Space Science Partnership<br />
at Penn State University, University Park, PA. In 2011, she completed her PhD at Penn State in Energy and<br />
Mineral Engineering with a focus in fuel sciences. Meredith can be reached at mah339@psu.edu<br />
Bryan Brightbill is a teacher at Park Forest Middle School in State College, PA. He is in his 6th year of<br />
teaching, having obtained a MEd in Curriculum and Instruction with a science education emphasis from <strong>The</strong><br />
Pennsylvania State University in 2008 and a BS in Geosciences from PSU in 2005. Bryan can be reached at<br />
bkb13@scasd.org<br />
Seyed Mehdi Kamali Shahri is a PhD student in the Department of Energy and Mineral Engineering at<br />
Penn State University, University Park, PA. He has received his BS and MS in Chemical Engineering and is<br />
currently working on an environmental project. Mehdi can be reached at suk251@psu.edu<br />
Tanya Furman is a Professor of Geosciences and Assistant Vice President and Associate Dean for<br />
Undergraduate Education at the Pennsylvania State University. Her scientific research uses the<br />
geochemistry of volcanic rocks to understand global tectonic processes. Tanya can be reached at furman@<br />
psu.edu<br />
Open Windows to the Universe at<br />
www.windows2universe.org<br />
From <strong>Earth</strong> science to astronomy,<br />
your <strong>Earth</strong> and space science<br />
ecosystem for learning!<br />
• Science content – 9000+ pages<br />
• Over 100 classroom-tested<br />
activities, interactives and games<br />
• 3 levels, English and Spanish<br />
• Free Educator newsletter<br />
• Educator Members receive<br />
special services and benefits:<br />
‣ Free access to formatted classroom<br />
activities, student worksheets, Teacher keys, associated graphics<br />
and data, downloadable ppts and more! $230 value!<br />
‣ My W2U, Journal, store discounts, calendars, opportunities<br />
for teachers, web seminars, and no ads!<br />
Join Today<br />
$20/yr - $10/yr for<br />
NESTA members!<br />
www.windows2universe.org/<br />
membership.html<br />
Windows to the Universe is a project of the National <strong>Earth</strong> Science Teachers Association<br />
© 2013 National <strong>Earth</strong> Science Teachers Association. All Rights Reserved.
Page 20<br />
<strong>The</strong> <strong>Earth</strong> <strong>Scientist</strong><br />
Exploring Regional Climate<br />
Patterns and Generalizing<br />
the Results to Enhance<br />
Deep Conceptualization<br />
http://simpleclimate.wordpress.com. Credit: PNNL<br />
Bryan Brightbill,<br />
Park Forest Middle School<br />
Abstract<br />
An understanding of climate science and the processes that control <strong>Earth</strong>’s past, present<br />
and future climate is increasingly important for students both as potential scientists and<br />
as future decision-makers in our society. Before students can begin grappling with the<br />
concept of anthropogenic climate change, they must build the necessary vocabulary and<br />
background knowledge for participating in meaningful discussion about the natural<br />
climate system. This article describes a 1-2 week unit on the factors influencing regional<br />
climate, focusing on student abilities to describe data, generalize the trends they see, and<br />
make predictions justified by their data.<br />
Introduction<br />
Context and Development<br />
This unit is intended to be used as part of a larger middle grades <strong>Earth</strong> science curriculum. <strong>The</strong><br />
typical sequence for <strong>Earth</strong> science that has been done with this lesson begins with geology and<br />
geomorphology, looking at the local landscape in terms of the rock types present and their<br />
erosional behaviors (Ellis et al., 2009). Next is a transition to a brief natural resources unit on<br />
oil and gas (Bembenic et al., this issue) which provides a jumping off point for discussion of<br />
climate change. In this discussion students have always recognized their own need for greater<br />
understanding of climate in general before they can address climate change. This self-reflective<br />
recognition is the transition that leads the class into investigating how climate varies around the<br />
globe and the causes of these variations. Following this investigation, the class returns to a discussion<br />
of climate change, traditionally in the form of a well-researched debate regarding the causes<br />
and effects of global climate change.<br />
<strong>The</strong> original form of this unit was inspired by a plate tectonics activity designed for a hypothetical<br />
planet that was introduced in an upper-level <strong>Earth</strong> history class at the Pennsylvania State University.<br />
<strong>The</strong> activity was originally envisioned as an applied way of helping students remember the climate<br />
regions and their characteristics. Following the author’s participation in <strong>Earth</strong> and Space Science<br />
Partnership (ESSP) workshops with a focus on using the Claim-Evidence-Reasoning (CER) framework<br />
of McNeill & Krajcik (2012), the purpose and method of this unit were redesigned. <strong>The</strong> unit<br />
© 2013 National <strong>Earth</strong> Science Teachers Association. All Rights Reserved.
Volume XXIX, Issue 2<br />
Page 21<br />
now emphasizes student efforts at making claims and predictions based on data and supporting<br />
them with logical and reasoned discourse.<br />
Unit Components and Implementation<br />
Introduction<br />
While this unit could creatively be positioned in many ways within the curriculum, in the author’s<br />
classroom it is nested between units on energy resources and climate change, serving as the transition<br />
between the two. <strong>The</strong> first day following completion of the energy resource unit begins with a<br />
brief discussion of climate and climate change, eliciting what the students already know or think<br />
about the two terms, and concludes in a class brainstorm of the questions that need to be answered<br />
in order to begin to understand climate change. Inevitably some variation of these questions arises:<br />
“What causes/affects climate?” and “Why is climate different in different places?” <strong>The</strong>se are questions<br />
that the students can recognize as being essential to their ability to understand and discuss<br />
climate change, and the investigations begin.<br />
In order to discuss the phenomena that cause climate to vary geographically, it is necessary to adopt<br />
a classification system. Without a mechanism of generalizing the regional climate characteristics<br />
on a global scale, students easily become overwhelmed and unable to investigate in a consistent<br />
manner the factors that lead to these variations. For simplicity the organization included in the<br />
Pearson Prentice Hall textbook Science Explorer: Weather and Climate was used (Brooks Simons,<br />
2007). This system classifies <strong>Earth</strong>’s climates into 5 regions (Tropical Rainy, Dry, Temperate Marine,<br />
Temperate Continental, Polar) that are subdivided into a total of 12 climates, including one specific<br />
to mountain elevations that does not belong to any of the 5 larger regions.<br />
Step 1: Noticing Trends in Air and Ocean Circulation<br />
<strong>The</strong> first step in investigating the complexities of climate comes in trying to understand the fluid<br />
dynamics of atmospheric circulation. Prevailing winds play a major role in regional climate, and<br />
are caused by interaction between the large, latitude-based convection cells and the Coriolis Effect<br />
that results from <strong>Earth</strong>’s rotation. An understanding of the generation and structure of the Hadley,<br />
Ferrel and Polar Cells is essential background to the study of <strong>Earth</strong>’s overall climate system, and<br />
is particularly relevant to predicting the existence and direction of prevailing winds. <strong>The</strong> students<br />
must be able to refer to this information in order to build their explanations later in the unit. While<br />
there are inquiry-based options available for both of these topics, for this unit they are taught<br />
through direct instruction to establish common ground among the students and to reserve their<br />
creative energy for the subsequent activity.<br />
Figure 1. Map of world ocean<br />
currents (http://blue.utb.edu/<br />
paullgj/geog3333/lectures/<br />
physgeog.html)<br />
Once the students are familiar with the Coriolis Effect,<br />
they are given a world map displaying ocean currents (see<br />
Figure 1) and asked to explain both the pattern of currents<br />
and the reason why some currents are warm and others<br />
are cold. This task is completed as a brief writing assignment<br />
where the students are prompted to make claims<br />
that address two specific questions: (1)Why do ocean<br />
currents flow the directions that they do? and (2)Why is<br />
an individual current either warm or cold? <strong>The</strong>y must<br />
support each of the two claims with reference to actual<br />
currents on the map and provide a scientific explanation<br />
for what makes their claim valid (emphasizing the CER framework). <strong>The</strong> goal of this task is for<br />
students to recognize the generally clockwise rotation in the northern hemisphere, the generally<br />
© 2013 National <strong>Earth</strong> Science Teachers Association. All Rights Reserved.
Page 22<br />
<strong>The</strong> <strong>Earth</strong> <strong>Scientist</strong><br />
counterclockwise rotation in the southern hemisphere, and the movement of warm currents away<br />
from the equator and the cold currents away from the poles.<br />
Latitude, altitude, geography and proximity of large bodies of water all impact regional climates<br />
and recognizing these effects will contribute to student understanding of climate in general. <strong>The</strong>re<br />
are various ways of addressing each of these, and in this curriculum these factors have generally<br />
been taught through a mix of discussion and demonstration. Latitude is classically demonstrated<br />
by shining the beam from a flashlight directly onto a board and tracing the outline of the light, and<br />
then shining the light from the same distance but at an angle to demonstrate that the same amount<br />
of light is spread out over a greater area when the sun is at lower angles, which leads both to cooler<br />
weather at greater latitudes as well as the variation between seasons as that angle changes ( http://<br />
tinyurl.com/bkxhs3s ).<br />
Students investigate altitude and geography directly, as they document the locations of deserts in<br />
relation to mountain ranges and the existence of highland climate regions. <strong>The</strong> significant effect of<br />
proximity to large bodies of water can be shown using heat capacity lab exercises or demonstrations (See<br />
“A Day at the Beach” at this link: http://tinyurl.com/aw4l26x). A second effective method is to show a<br />
weather map that represents graphically the temperature buffering effects of proximity to water.<br />
Step 2. Noticing Features that Define Climate Regions<br />
<strong>The</strong> significant learning in this unit comes as students are asked to create generalizations from<br />
a diverse suite of data and then apply those generalizations in a new context. Students are asked<br />
(either in pairs or in small groups) to list the 12 types of climate as listed in the textbook (Brooks<br />
Simons, 2007) and describe where they generally occur. <strong>The</strong>y are given the following instruction:<br />
List the 12 types of climate and describe where each tends to occur. This can mean various things, but<br />
generally speaking you should address whether each climate:<br />
l Tends to be on just one side of a continent<br />
l Tends to be next to or away from water/oceans<br />
l Is influenced by warm or cold ocean currents<br />
l Is influenced by an interaction between geography and the prevailing winds<br />
l Tends to only exist at certain latitudes<br />
l Tends to occur only within certain elevations<br />
<strong>The</strong> students typically converge around 3-5 location characteristics for each type of climate. Given<br />
the previous instruction in the unit, students have traditionally been very successful in forming<br />
these generalizations through discussion with their partners or in their groups. When students<br />
struggle, the Mediterranean may be used as an example to work through as a class. This type of<br />
climate has very specific criteria: it occurs between 30 and 40 degrees north or south latitude and on<br />
the west coast of land masses at those latitudes. Students may at this point also begin looking for<br />
the factors (cool ocean currents, prevailing winds moving over land from the ocean) that produce<br />
the regional climatic features, but they are not asked to furnish that information until the application<br />
and justification section.<br />
Application and Justification<br />
Once the students have a set of criteria of their own making for determining the climate region<br />
that would appear in any given geographic location, they are given a hypothetical planet with a<br />
different distribution of landmasses (see Figure 2). <strong>The</strong> students are informed that the atmospheric<br />
and oceanic circulation processes on <strong>Earth</strong> work the same way on this planet and therefore the<br />
only difference is the location of the continents. As a class, students decide on names for notable<br />
© 2013 National <strong>Earth</strong> Science Teachers Association. All Rights Reserved.
Volume XXIX, Issue 2<br />
Page 23<br />
geographic features (continents, oceans, mountain ranges) in order to facilitate<br />
discussion of climates on the alien planet. <strong>The</strong>y are then asked to apply<br />
their knowledge of prevailing winds and ocean currents to mark<br />
those winds, warm currents, and cold currents that would likely<br />
form on this planet. An alternative approach to developing a<br />
hypothetical arrangement of continental masses is to employ<br />
paleogeographic plate tectonic reconstructions (http://www.<br />
scotese.com/) that may have particular significance for a<br />
specific region or time period.<br />
Once all of the winds and currents are indicated, and the<br />
geographic features are named, students must identify one location<br />
on this planet for each of the twelve climate regions. This selection must<br />
be based upon the generalizations about each region that they had derived<br />
earlier. <strong>The</strong>y must also justify the choice of each climate region in one or two sentences to<br />
explain their reasoning. Working in groups, students complete the map, while the reasoning statements<br />
are done independently after the map is completed. This step ensures that each member<br />
participates and develops an understanding of the material.<br />
Figure 2. Alien planet map<br />
provided to students for labeling<br />
and identification of climate<br />
regions.<br />
Grading<br />
<strong>The</strong> map and the documents containing the geographic justifications serve as the final assessment<br />
for this short unit. <strong>The</strong> author works through the process along with the students as a demonstration<br />
every year. This joint effort creates an ‘answer key’ in hand once the maps are submitted, but<br />
because there is no unique solution this map is not the sole criterion on which the assignment is<br />
graded. <strong>The</strong> grade comes principally from the justification provided for each region. If a group’s<br />
submission for any given region does not match the teacher’s conception of this alien planet, but<br />
the members of the group provide a solid justification based on the evidence on the <strong>Earth</strong>’s climate<br />
map, they receive full credit. On the other hand, if a student’s reasoning is poor but the region is<br />
located in the same place as on the teacher map, that student receives only partial credit. Provided<br />
by the author, the following examples illustrate this grading system:<br />
Example full-credit (3 pt.) explanation: Located on the east coast of Katniss is the humid subtropical climate<br />
region. This region experiences hot summers and cool winters. This climate region is influenced by the warm<br />
ocean currents which cause the temperature in the summer to get hot and the temperature in the winter to<br />
stay mild.<br />
Note the description in the above example of how the warm ocean currents influence the nearby<br />
land. This is the type of reasoning that leads to full credit being awarded.<br />
Example partial-credit (2 pt.) explanation: <strong>The</strong> wet humid subtropical climate is found from 20-40º, and<br />
typically above the tropics. It is on the southeastern coast of Brightville, and the middle eastern coast of<br />
Harperstan. This climate is found on east coasts, adjacent to warm currents. Prevailing winds do not affect<br />
this climate.<br />
This explanation lacks a description of the role of warm currents, saying only that they are adjacent.<br />
<strong>The</strong> location given for the climate is reasonable, as are the trends, but adequate reasoning is lacking.<br />
Example low-credit (1 pt.) explanation: <strong>The</strong> humid continental region was located on the Northeastern coast<br />
of Jeffathotmaildotcom near the Donkey Teeth Mountains. It gets high temperatures of 10ºC and -3ºC and<br />
lower in the winter. It is humid in the summer and cold in the winter.<br />
© 2013 National <strong>Earth</strong> Science Teachers Association. All Rights Reserved.
Page 24<br />
<strong>The</strong> <strong>Earth</strong> <strong>Scientist</strong><br />
About the<br />
Author<br />
Bryan Brightbill is a<br />
teacher at Park Forest<br />
Middle School in State<br />
College, PA. He is in his<br />
6th year of teaching,<br />
having obtained a BS<br />
in Geosciences (2005)<br />
and a MEd in Curriculum<br />
and Instruction with<br />
a science education<br />
emphasis (2008) from<br />
<strong>The</strong> Pennsylvania State<br />
University. Bryan can be<br />
reached at bkb13@scasd.<br />
org .<br />
This example gives a location for the climate, but provides no justification or explanation whatsoever.<br />
Even though the location is reasonable, only 1 point is given for this response.<br />
Example no-credit (0 pt.) explanation: West side of continent and northern side of continent. Hot summers<br />
cold winters near equator and is near cold ocean currents. Located on Normanland.<br />
<strong>The</strong> above description earns no credit, as it includes incorrect information and lacks explanation. In<br />
addition, the poor writing quality renders this answer unacceptable for credit.<br />
Conclusions<br />
This activity has resulted in an appreciable difference in the ability of the author’s students to<br />
discuss climate and begin to understand its complexities. This project also provides students with<br />
an excellent opportunity to exercise their skills in using reasoning to justify claims by making reference<br />
to solid evidence. <strong>The</strong> unit offers a great deal of flexibility for the teacher in choosing how to<br />
address each of the factors affecting climate. In this way, students are better able to make connections<br />
both within and across the curriculum and become poised to become informed citizens and<br />
decision-makers.<br />
Bibliography<br />
Brooks Simons, B. 2007. Science Explorer: Weather and climate. Boston: Pearson Prentice Hall.<br />
Ellis J, Furman T, McAninch S & Stout H. 2009. Improving comprehension of geomorphic concepts through<br />
inquiry-based learning. <strong>The</strong> <strong>Earth</strong> <strong>Scientist</strong>, 25, 14-18.<br />
McNeill, K. L., & Krajcik, J. S. 2012. Supporting grade 5-8 students in constructing explanations in science: <strong>The</strong><br />
claim, evidence, and reasoning framework for talk and writing. Boston: Pearson.<br />
Visit<br />
American<br />
Geosciences<br />
Institute<br />
Resources<br />
Your one-stop shop for marine<br />
science curriculum supplies.<br />
www.LeaveOnlyBubbles.com<br />
715-659-5427<br />
support@leaveonlybubbles.com<br />
Leave Only Bubbles is a subsidiary of “What If…?” Scientific, a teacherowned<br />
and operated earth science supply company founded in 1997.<br />
Excellence in <strong>Earth</strong><br />
Science Education<br />
• <strong>Earth</strong> Science Week<br />
• <strong>Earth</strong> Magazine<br />
• Curriculum resources<br />
• Teacher PD<br />
• Geoscience Career Info<br />
http://www.agiweb.org/geoeducation.html<br />
© 2013 National <strong>Earth</strong> Science Teachers Association. All Rights Reserved.
Volume XXIX, Issue 2<br />
Page 25<br />
<strong>The</strong> Power of a Hurricane:<br />
Using Memorable Storms to Teach<br />
Inference and Graphing Skills<br />
Greg Collins, Southern Lehigh High School<br />
Eliza Richardson, Department of Geosciences,<br />
Pennsylvania State University<br />
Abstract<br />
Using real-time or near-real-time data in the classroom can form the basis for exciting<br />
guided inquiry lessons that build necessary scientific thinking skills. Choosing data from<br />
recent newsworthy events also motivates students to learn because they feel personally<br />
connected to the observations surrounding such events. <strong>The</strong> lesson presented here challenges<br />
students to collect a variety of types of near-real time authentic meteorologic data<br />
associated with a memorable hurricane of their choice, to decide how to best display that<br />
data to facilitate interpretation, and finally to interpret the multiple datasets in order to<br />
draw conclusions about how meteorological conditions change as a hurricane approaches<br />
and passes by a weather station.<br />
Introduction<br />
Twenty-first century skills have been a recent area of focus for schools around the globe, and for<br />
good reason. Technological literacy continues to rise in importance in the job market, and as information<br />
becomes more available the ability to draw conclusions from data is becoming more prized.<br />
Working with real-time data in inquiry-based exercises develops necessary critical thinking skills as<br />
identified by the National Science Education Standards (NRC, 1996) and also can engage students<br />
by giving them the opportunity to analyze timely and personally relevant data (e.g. the various<br />
“Remote Sensing Laboratories” described by Moore et al., 2013). For high school <strong>Earth</strong> science<br />
teachers, this change in focus presents a great opportunity. While most students in the class will<br />
likely not become geologists or meteorologists, they will all need to be able to make inferences and<br />
present data. <strong>Earth</strong> science is unique among the sciences in terms of the number of passive observatories<br />
that collect data and make it openly available to the public. <strong>The</strong>refore, <strong>Earth</strong> science lessons<br />
that take advantage of such datasets are well-positioned to help students develop these interpretation<br />
skills, adding to the relevance of the class and motivating students to learn (Mulvey and Bell,<br />
2012; Wildeboer, 2012).<br />
Also relevant and motivating to students are news reports of local, national and global interest.<br />
<strong>The</strong> devastating tsunami that struck Japan in 2011 provided such a “teachable moment,” as did the<br />
eruption of Iceland’s Eyjafjallajökull in 2010. More recently for residents of the United States’ east<br />
coast, Hurricane Sandy proved to be an invaluable opportunity to capture students’ attention and<br />
to pique their curiosity about meteorology.<br />
© 2013 National <strong>Earth</strong> Science Teachers Association. All Rights Reserved.
Page 26<br />
<strong>The</strong> <strong>Earth</strong> <strong>Scientist</strong><br />
<strong>The</strong> lesson presented here, which involves data analysis of a memorable hurricane, is both relevant<br />
and content-rich. It has been taught, as presented, as a guided-inquiry exercise to college-bound<br />
juniors and seniors as part of a unit on hurricanes. It asks students to access publicly available data<br />
and generate graphs to make trends readily apparent. Students are provided with the location of<br />
the data repository to be used in this lesson, as well as the means to access it, but they must choose<br />
which data to download and decide the best way to plot that data in order to be able to interpret<br />
the data and arrive at the answer to their question. This structured inquiry process is an important<br />
part of building the kind of mentally flexible framework called “multiple external representation”<br />
by cognitive scientists that aids in scientific learning progressions (Ainsworth, 1990). Students<br />
are guided to present their graphs in the format of a meteogram, which is a standard document<br />
depicting weather data over time, usually a 24-hour period. Students then use their meteograms as<br />
tools to aid in data analysis, where students identify trends and make inferences about hurricanes.<br />
Goals<br />
<strong>The</strong> three overarching goals of this lesson are:<br />
n<br />
n<br />
n<br />
making inferences from scientific data<br />
plotting data<br />
learning how meteorological observations at a location change as a hurricane approaches<br />
and then leaves the region<br />
<strong>The</strong> Lesson<br />
To begin the lesson, students are presented with a question to stimulate their interest: “How could<br />
the location of a hurricane be determined without access to radar or satellite images?” After a brief<br />
brainstorming session, the students attack the general question by investigating a specific case.<br />
Each student studies a historic hurricane of their choice, by analyzing<br />
the weather records of the storm. Several websites, primarily those of<br />
university meteorology departments, make data archives freely available<br />
online. Plymouth State University’s website (http://vortex.plymouth.<br />
edu/statlog-u.html) provides an easy-to-search archive with hourly data<br />
for nearly two thousand cities in North America going back to 1998.<br />
Figure 1.<strong>The</strong> main website page<br />
for Plymouth State University’s<br />
weather data archive.<br />
Students visit the archives and access the data for a station near their<br />
chosen storm on the day of the event. Because not all weather stations<br />
are able to report complete records during hurricanes, it may be beneficial<br />
to direct students to certain stations for a given storm. Once they<br />
have accessed the site, students will see the data in text format; they<br />
must copy and paste that text into a spreadsheet program such as<br />
Excel. At this point, some data formatting is required. If teachers have<br />
a concern about the ability of their students to format the data, they<br />
can pre-format the table and make a file available for their students.<br />
Alternatively, for advanced students, to keep the authenticity of accessing the data online, consider<br />
providing a macro or short program that does the formatting for them.<br />
Once students have the data in a usable format, they begin the graphing process. Meteograms<br />
include three separate graphs and several weather symbols, all plotted as a function of time, for<br />
a single 24-hour period. Meteograms do follow a standard format (see Figure 2), but students<br />
should be encouraged to experiment with different ways of displaying the multiple datasets they<br />
have acquired. Engaging in plotting experimentation is an important part of developing scientific<br />
© 2013 National <strong>Earth</strong> Science Teachers Association. All Rights Reserved.
Volume XXIX, Issue 2<br />
Page 27<br />
inquiry skills and it also helps students think about the importance of<br />
clear and coherent plots as scientific communication tools (Tufte, 2001).<br />
Students can be guided towards producing a meteogram in standard<br />
format, in which the first graph plots temperature, dew point and relative<br />
humidity on a single panel; the second graph shows both visibility<br />
and cloud ceiling; and the third plots barometric pressure. Also included<br />
are symbols for cloud cover, wind speed and direction, and precipitation.<br />
<strong>The</strong>se symbols require drawing by hand, so a file can be provided to<br />
students with the symbols pre-drawn, or the students can annotate their<br />
completed meteogram after printing it.<br />
Next, the completed meteogram is used to analyze the storm. Students can<br />
then be given a worksheet (for a sample worksheet go to http://www.paesta.<br />
psu.edu/classroom/power-hurricane-using-memorable-storms-teach-inference-and-graphing-skills)<br />
that asks them to identify trends with respect<br />
to time for the observations of temperature, pressure, cloud cover, and the<br />
other data. <strong>The</strong>y are also asked to look for correlations among different<br />
types of data, for example, whether wind speed and pressure change simultaneously<br />
or whether the change in one observation lags the other.<br />
When students analyze trends in wind, they are led back to the original motivating question about<br />
hurricane location. By looking at both wind speed and direction and applying their knowledge of<br />
the rotation of low-pressure systems, they can generate a claim regarding the position of the eye<br />
and support their claim with their evidence and reasoning. <strong>The</strong>y are specifically asked to identify<br />
the time they believe the eye of the storm was closest to the weather station and the position of the<br />
storm at that time. Once students have generated their claim, they share their hypothesis with the<br />
teacher before checking their hypothesis against additional data.<br />
<strong>The</strong> final step of this lesson is for students to investigate the actual path their storm took. Through an<br />
internet search, students can find maps for most historic storms. <strong>The</strong>y then compare their claim about<br />
the storm’s position to its actual movement and explain any possible causes for error in their claim.<br />
This activity leads into good class discussion of student results and any lessons and/or skills learned.<br />
Figure 2. Sample 24-hour<br />
meteogram generated in<br />
this lesson for station KJFK<br />
(New York City). Top panel<br />
shows Temperature (blue) and<br />
dew point (green) in F° and<br />
relative humidity (purple) as a<br />
percentage. Middle panel plots<br />
cloud height (x’s) in feet and<br />
visibility (red line) in statute<br />
miles. Bottom panel plots<br />
barometric pressure in millibars.<br />
Symbols in between the top and<br />
middle panel indicate wind speed<br />
and direction.<br />
Conclusions<br />
This lesson provides a fun way to teach several key science skills at once, making it both effective<br />
and efficient. Taught as presented in this article, the lesson is both rigorous and relevant for collegebound<br />
high school juniors and seniors. It can, however, be easily modified to serve other levels.<br />
For younger students or students with less developed graphing skills, it is appropriate to graph<br />
only certain key measurements or to access already-completed meteograms via the Plymouth State<br />
website for their chosen hurricane. In this implementation, students focus on analyzing the data<br />
without spending as much time on graphing.<br />
For students who need a greater challenge, this lesson can be used to begin a unit on low-pressure<br />
systems. Assign groups to a certain storm but have each student in the group analyze the data from<br />
a different nearby weather station. By putting together information on wind speed, direction, and<br />
barometric pressure around a storm, student groups can discover some key characteristics of hurricanes<br />
before direct instruction, which would hopefully improve their understanding and retention.<br />
As the Next Generation Science Standards are ushered in, there will be an increased focus on<br />
teaching science as process. <strong>The</strong> lesson presented here, works to grow the general, science skills of<br />
inferring and graphing while also building content knowledge through discovery.<br />
© 2013 National <strong>Earth</strong> Science Teachers Association. All Rights Reserved.
Page 28<br />
<strong>The</strong> <strong>Earth</strong> <strong>Scientist</strong><br />
Bibliography<br />
Ainsworth, S., 1990, “<strong>The</strong> Functions of Multiple Representations,” Computers and Education, 33, 131-152.<br />
Moore, J.D., P. Dorofy, M. Holzer, J. Hopkins, 2013, “An Opportunity for Innovation in STEM Education:<br />
GeoSTEM,” <strong>The</strong> <strong>Earth</strong> <strong>Scientist</strong>, XXIX, 29-35.<br />
Mulvey, B. and R. Bell, 2012, “A Virtual Tour of Plate Tectonics,” <strong>The</strong> Science Teacher, 79, 53-58.<br />
National Research Council (NRC), 1996, National Science Education Standards, Washington, DC, National<br />
Academies Press.<br />
Tufte, E.R., 2001, “<strong>The</strong> Visual Display of Quantitative Information,” Graphics Press, Cheshire CT, 197pp.<br />
Wildeboer, B., 2012, “Data Analysis: Tropical Storm and Hurricane Frequency,” <strong>The</strong> <strong>Earth</strong> <strong>Scientist</strong>, XXVIII,<br />
13-15.<br />
About the Authors<br />
Greg Collins earned bachelor’s degrees in Physics and Mechanical Engineering from Wilkes University and<br />
an M.Ed. in Curriculum and Instruction from Kutztown University. He is a candidate in the M.Ed. in <strong>Earth</strong><br />
Sciences program at <strong>The</strong> Pennsylvania State University. He is presently a science teacher at Southern<br />
Lehigh High School in Center Valley, PA, leading students in courses on natural hazards, energy, physics,<br />
and a survey of <strong>Earth</strong> science. Greg can be reached at collinsg@slsd.org<br />
Eliza Richardson earned her bachelor’s degree in Geology and Geophysics from Princeton University and<br />
her PhD in Geophysics from MIT. She is currently an assistant professor in the Department of Geosciences<br />
and the director of the M.Ed. in <strong>Earth</strong> Sciences program at <strong>The</strong> Pennsylvania State University, University<br />
Park, PA. Her current research focus is on the spectrum of fault slip in subduction zones. Eliza can be<br />
reached at eliza@psu.edu<br />
Are you looking for some quality<br />
mineral or fossil specimens<br />
for your classes? Or maybe for you?<br />
Check out the assortment of<br />
minerals and fossil specimens<br />
available on our Online Store<br />
from Nature’s Own!<br />
Classroom specimens and collections,<br />
jewelry, and household items available!<br />
Visit our online store at<br />
www.windows2universe.org/store,<br />
and click on “Nature’s Own”<br />
Windows to the Universe members get a 10% discount!<br />
© 2013 National <strong>Earth</strong> Science Teachers Association. All Rights Reserved.
Volume XXIX, Issue 2<br />
Page 29<br />
Using iBooks Author to Create<br />
<strong>Earth</strong> Science Classroom<br />
Content for the iPad<br />
Abigail Dufoe, <strong>The</strong> Pennsylvania State University<br />
Laura Guertin, Penn State Brandywine<br />
Abstract<br />
With Apple’s freely available iBooks Author software, teachers have the ability to create<br />
customized iBooks for their students viewable on iPads. iBooks Author allows for the<br />
creation of content that is interactive and enhanced with multimedia, which can engage<br />
students in current and relevant <strong>Earth</strong> Science topics. Described here are two iBooks<br />
created as examples for use in middle school classrooms. Controversies in the Hydrosphere is a<br />
collection of case studies related to global water issues. Deepwater Horizon Oil Spill outlines<br />
the specific 2010 oil spill event in the Gulf of Mexico. iBooks provide the opportunity<br />
for <strong>Earth</strong> Science content to be presented via new technology as well as the creation of a<br />
different learning environment.<br />
Introduction<br />
<strong>The</strong> National Center for Education Statistics reports that only 29% of public school teachers are<br />
using Macintosh or PC computers as an instructional tool (Gray et al., 2010). However, there has<br />
been an increasing presence of iPads in the K-12 classroom, with Apple reporting in January 2012<br />
that 1.5 million iPads are being used in schools (Kessler, 2012). With teachers acquiring iPads for<br />
personal and professional use, and many schools providing iPads and iPad carts for classrooms in<br />
place of outdated computer carts, the iPad now offers a portable, lightweight option for teaching<br />
and student learning.<br />
One advantage of using iPads in schools is that iPads offer the availability of electronic classroom<br />
resources such as iBooks. An iBook is a digital resource available from Apple’s iTunes store or<br />
from additional websites that can be downloaded onto an iPad via the iBooks App. <strong>The</strong> cost of an<br />
individual iBook can range from free to over $20 each. Teachers can adapt iBooks to their existing<br />
lesson plans or create their own new classroom approach incorporating customized iBooks.<br />
<strong>The</strong> challenge remains that although the technology is getting into the hands of students and<br />
teachers, freely available <strong>Earth</strong> Science iBooks and relevant digital materials are still lacking. This<br />
article describes how to use iBooks Author to create customized content for the <strong>Earth</strong> science classroom,<br />
then discusses two custom-made iBooks connecting to global water issues. <strong>The</strong> goal was to<br />
create iBooks that can be used in the middle school classroom by <strong>Earth</strong> science teachers. <strong>The</strong> iBooks<br />
are designed for classroom situations where teachers are able to connect an iPad to a LCD classroom<br />
projector and guide students through the projected iBook content. Alternatively, if enough<br />
iPads are available, students may work in teams or individually to read through the iBook, answer<br />
questions, complete worksheets, etc.<br />
© 2013 National <strong>Earth</strong> Science Teachers Association. All Rights Reserved.
Page 30<br />
<strong>The</strong> <strong>Earth</strong> <strong>Scientist</strong><br />
Methods<br />
iBooks Author (see http://www.apple.com/ibooks-author/) is a free application available from<br />
Apple’s App Store. <strong>The</strong> program requires Mac OS Version 10.7 or later and is only available for<br />
the Macintosh computer. <strong>The</strong> electronic books created by the iBooks Author program can only<br />
be opened on an iPad through the iBooks App. However, a completed iBooks Author file can be<br />
exported as a PDF file and read in any PDF reader on any computer platform. Note, however, that<br />
the interactive features of the iBook will not function in the PDF export.<br />
Keeping the classroom audience in mind, each chapter in the iBooks was formatted with four<br />
sections: case studies, review quiz, discussion questions, and references. <strong>The</strong> content can be typed<br />
directly into the iBooks Author software, copied and pasted from any text-editing software, or<br />
“dragged and dropped” from a MS Word file. Review questions were created based on Bloom’s<br />
Taxonomic Scale (Bloom, 1956 as updated by Anderson &Krathwohl,2001), with the multiplechoice<br />
review quizzes on the low end of Bloom’s Taxonomic Scale and the discussion questions<br />
towards the top of the Scale. <strong>The</strong> discussion questions were presented without the answers, so<br />
students would have to work their way through the responses. Answer guides for the open-response<br />
questions are not provided with the iBooks.<br />
Photos and videos are provided as supporting media to the iBooks. To ensure free distribution of<br />
the completed iBooks, copyright-free images from Wikimedia Commons (http://commons.wikimedia.org)<br />
and Flickr were used. <strong>The</strong> Flickr images selected are under a Creative Commons license,<br />
and photographers are credited in the references for each chapter. Additional images in the public<br />
domain were used from the government agencies: NASA, NOAA, EPA and USGS. To gain access to<br />
the many quality videos that exist online, widgets for YouTube videos from Bookry (http://www.<br />
bookry.com) were utilized so that the online videos would stream and play in the iBooks.<br />
In addition to the supporting photos and videos, interactive components of the books were assembled<br />
with widgets provided with the iBooks Author software. With the copyright-free images, image<br />
galleries were created that the user can swipe through as a slideshow. Multiple-choice review quizzes<br />
were also created that allow the user to check their selection immediately with the “Check Answer”<br />
button underneath each question and to see a final score upon completion of the quiz. Additional<br />
widgets were used from the Bookry website, such as the real-time Twitter feed viewer and a full-screen<br />
webpage viewer, both of which automatically update if the iPad has a live internet connection.<br />
<strong>The</strong> completed books were saved as .ibooks files and made available on the PAESTA (Pennsylvania<br />
<strong>Earth</strong> Science Teachers Association) website (http://www.paesta.psu.edu/ibooks-earth-spacescience)<br />
for free download. To download the books, the URL should be accessed from Safari on an<br />
iPad that already has the iBooks App.<br />
Controversies in the Hydrosphere<br />
<strong>The</strong> goal of Controversies in the Hydrosphere is to explore a variety of controversial issues regarding<br />
water on the planet. <strong>The</strong> hydrosphere is an integral part of <strong>Earth</strong>’s interconnected spheres and<br />
features prominently in the Big Ideas of <strong>Earth</strong> Science (<strong>Earth</strong> Science Literacy Initiative, 2009).<br />
This six-chapter iBook begins with an overview of the Big Ideas, supplemented with embedded<br />
corresponding AGI (American Geosciences Institute) videos for each idea (from http://www.earthscienceliteracy.org/videos.html).<br />
<strong>The</strong> second chapter reviews <strong>Earth</strong>’s lithosphere, hydrosphere,<br />
biosphere and atmosphere, focusing on the linkages between these realms. Each subsequent chapter<br />
focuses on a specific water issue: aquifer depletion (chapter 3); freshwater chemical contamination<br />
(chapter 4); marine debris (chapter 5); and glacial melting (chapter 6). Each chapter is presented in<br />
a case study format that highlights the history of the issue, its current scientific and political status<br />
© 2013 National <strong>Earth</strong> Science Teachers Association. All Rights Reserved.
Volume XXIX, Issue 2<br />
Page 31<br />
(if applicable), and some solutions that have been generated by organizations such as NOAA and<br />
the EPA. <strong>The</strong> case studies include short, comprehensive multiple-choice quizzes, as well as critical<br />
thinking questions. <strong>The</strong> questions, presented in an open-ended format, focus on the Big Ideas,<br />
proposing solutions for rectifying the situation, and/or assignments specifically targeting an idea<br />
presented in the case study. <strong>The</strong>se questions were created for discussion purposes and/or for individual<br />
responses. <strong>The</strong> iBook ends with a glossary of the terms that may be new or challenging for<br />
middle school students.<br />
Deepwater Horizon Oil Spill<br />
<strong>The</strong> goal of the Deepwater Horizon Oil Spill iBook is to provide a summary of the history and status<br />
as of November 2012 of the worst oil spill in the history of the Gulf of Mexico. This single-topic<br />
iBook starts by defining oil spills and reviewing different methods and technologies used to clean<br />
up spilled oil in ocean and freshwater environments. <strong>The</strong> text then presents specific details of<br />
the volume of oil spilled in the Gulf of Mexico over time. <strong>The</strong> case study explains the impacts of<br />
the Deepwater Horizon spill on the environment, economy and public health, and also explores<br />
the different audiences responsible for the financial remuneration and environmental restoration<br />
efforts. <strong>The</strong> iBook includes images, videos, external links to websites for further exploration<br />
and multiple choice and open-ended questions. Just like Controversies in the Hydrosphere, this iBook<br />
contains a multiple-choice review quiz and open-ended discussion questions as well as a glossary,<br />
time-lapse photo section of the spill, and supplemental links.<br />
Initial Feedback<br />
Neither iBook has been formally tested in the classroom. Controversies in the Hydrosphere was presented<br />
at the PAESTA conference in October 2012 and at the American Geophysical Union (AGU) conference<br />
in December 2012. Visitors to the AGU poster presentation were able to engage with the iBook on an<br />
iPad and view images projected on a large monitor. <strong>The</strong> iBook was positively received by conference<br />
attendees, which included classroom teachers and informal educators. Visitors were surprised and<br />
pleased to learn there is no charge for the final product. Some attendees asked where one could find a<br />
corresponding lesson plan for the iBook. Lesson plans were not developed so that teachers could adapt<br />
materials to their classrooms and use the iBook in a way that was appropriate for their instruction,<br />
either as a source of content to drive a classroom exercise or as a supplemental tool.<br />
<strong>The</strong> iBooks Author software is intuitive for teachers to use to create their own iBooks with specialized<br />
content for their students. An iBook can be a multi-chapter book or cover a smaller, more<br />
focused topic. Teachers may also choose to create a textbook experience for a course, which can<br />
be easily and quickly updated so that content for students is always current. Additional iBooks<br />
continue to be created and are available through the PAESTA website to help provide teachers an<br />
engaging resource for <strong>Earth</strong> science instruction.<br />
About the<br />
Authors<br />
Abigail Dufoe is a<br />
recent graduate with<br />
a bachelors degree<br />
in Media Studies and<br />
minors in Environmental<br />
Inquiry and Civic &<br />
Community Engagement,<br />
at <strong>The</strong> Pennsylvania State<br />
University, University<br />
Park, PA. She is beginning<br />
her masters degree in<br />
environmental studies<br />
and nature conservation<br />
journalism at the<br />
University of Montana in<br />
fall 2013. Abigail can be<br />
reached at abbey.dufoe@<br />
gmail.com<br />
Laura Guertin is an<br />
Associate Professor of<br />
<strong>Earth</strong> Science at Penn<br />
State Brandywine, Media,<br />
PA. Her research involves<br />
studying how new and<br />
emerging technologies<br />
impact teaching and<br />
student learning in<br />
introductory-level <strong>Earth</strong><br />
science courses at the<br />
university level. Dr.<br />
Guertin can be reached at<br />
guertin@psu.edu<br />
References<br />
Anderson, L. W. & Krathwohl, D. R. 2001. A taxonomy for learning, teaching, and assessing: A revision of Bloom’s<br />
taxonomy of educational objectives. New York: Addison Wesley Longman.<br />
Bloom B. S. 1956. Taxonomy of Educational Objectives, Handbook I: <strong>The</strong> Cognitive Domain. New York: David McKay<br />
Co Inc.<br />
<strong>Earth</strong> Science Literacy Initiative. 2009. <strong>Earth</strong> Science Literacy Principles. Retrieved January 3, 2013, from<br />
http://www.earthscienceliteracy.org/document.html<br />
Gray, L., Thomas, N. & Lewis, L. 2010. Teachers’ Use of Educational Technology in U.S. Public Schools: 2009 (NCES<br />
2010-040). National Center for Education Statistics, Institute of Education Sciences, U.S. Department of<br />
Education. Washington, DC. Retrieved January 3, 2013, from http://nces.ed.gov/pubs2010/2010040.pdf<br />
Kessler, S. 2012. Why the iPad won’t transform education just yet. Retrieved January 3, 2013, from http://cnn.<br />
com/2012/01/20/tech/innovation/ipad-wont-transform-education/index.html<br />
© 2013 National <strong>Earth</strong> Science Teachers Association. All Rights Reserved.
Page 32<br />
<strong>The</strong> <strong>Earth</strong> <strong>Scientist</strong><br />
Figure from Isaac Newton’s “A<br />
Treatise of the System of the<br />
World” that Newton used to<br />
present his analogy between the<br />
motion of the Moon in its orbit<br />
around the <strong>Earth</strong> and a projectile<br />
fired from a high mountain.<br />
Image retrieved from a scanned<br />
copy of the book and made<br />
available through Google Books.<br />
<strong>The</strong> Role of Gravity in<br />
Planetary Orbits<br />
Alice Flarend, Bellwood-Antis High School<br />
Christopher Palma, Department of Astronomy &<br />
Astrophysics, Pennsylvania State University<br />
Figure 1. Diagram of a planet<br />
in a stable orbit around the<br />
Sun, with both the gravitational<br />
pull of the Sun and the planet’s<br />
tangential velocity vectors<br />
labeled. Not to scale. Drawn by<br />
C. Palma.<br />
Force of Gravity<br />
Abstract<br />
Recorded interviews with students from grades 6, 11 and 12 in Reading, Pennsylvania and<br />
in the districts of Bellefonte Area and Bald Eagle Area both located in central Pennsylvania,<br />
consistently revealed that students had, at most, a superficial understanding of the roles<br />
both gravity and velocity play in planetary orbits. This level of understanding may reflect<br />
the Pennsylvania state standards for 10 th grade students that unintentionally reinforce<br />
the misconception that gravity alone is responsible for planetary orbits. To address this<br />
shallow student understanding, the authors designed an activity for in-service teachers<br />
regarding the role that a planet’s tangential velocity plays, along with that of gravity, in<br />
determining the orbit of an object. After the teachers investigated the required velocity<br />
for the orbit of a simulated planet around a simulated Sun, the content of their postactivity<br />
discussion revealed that the activity improved teacher understanding of the<br />
additional component of velocity, which should in turn improve instruction and student<br />
understanding.<br />
Introduction<br />
<strong>The</strong> purpose of this article is twofold: (1) to share results of student interviews that corroborate<br />
misconception work of previous authors relating to the student understanding of the nature of<br />
planetary orbits; and (2) to share an in-service teacher professional development activity and suggestions<br />
for classroom instruction to improve student understanding of the<br />
roles of velocity and gravity in planetary orbits.<br />
Tangential Velocity of Planet<br />
Classroom textbooks serve as one introduction for students to the science of<br />
planetary orbits. <strong>The</strong> description of planetary orbits in a typical textbook in<br />
grades 6-12 is accompanied by an image similar to Figure 1. <strong>The</strong> discussion<br />
accompanying the image typically explains that a planetary orbit requires<br />
two elements: the planet’s tangential velocity perpendicular to the Sun/<br />
planet line and the gravitational force of the Sun, which pulls the planet<br />
in the direction of the Sun, accelerating the planet in that direction. <strong>The</strong><br />
combination of the planet’s tangential velocity and the gravitational pull<br />
of the Sun creates the curved orbital path illustrated in Figure 1. Planets<br />
that are further from the Sun have a smaller tangential velocity since they<br />
experience a smaller gravitational force.<br />
© 2013 National <strong>Earth</strong> Science Teachers Association. All Rights Reserved.
Volume XXIX, Issue 2<br />
Page 33<br />
However, the Pennsylvania State Standards may contribute to misunderstandings about planetary<br />
orbits. Contrasting the textbook discussion of orbits with the statements in the PA state standards<br />
documents indicates that the standards appear to reinforce a shallow understanding of orbital<br />
motion. In the Pennsylvania Academic Standards for Science and Technology and Engineering<br />
Education (2010), standard 3.3.10.B1 reads in part, “Explain how gravity is responsible for planetary<br />
orbits”. This statement does not acknowledge the essential role that the planet’s velocity also plays<br />
in determining the orbit. <strong>The</strong> questions accompanying textbooks are written to directly address<br />
the standards and serve as a focus for a teacher’s instruction. Yet, at least one middle school science<br />
textbook had questions in the section on planetary orbits that focused exclusively on gravity and<br />
asked nothing about the planet’s velocity, even though the accompanying text correctly identified<br />
the role of velocity. <strong>The</strong> standards and the textbooks together are reinforcing the incomplete idea<br />
that gravity alone is responsible for planetary orbits.<br />
Student Understanding of Orbits<br />
Part of a research effort through the Penn State <strong>Earth</strong> and Space Science Partnership (NSF Award<br />
#DUE-0962792) is to probe how students develop an increasingly sophisticated understanding of<br />
topics in Solar System astronomy. <strong>The</strong> authors have been interviewing thirty-eight students from<br />
grade 6 through 12 in central Pennsylvania (Plummer, Flarend, Palma, Rubin, &Botzer, 2013).<br />
Participants were asked a series of questions about the nature of the Solar System, including questions<br />
about the composition of the planets, the motions of objects in the Solar System, the reasons<br />
for those motions, and the formation of the Solar System. Some specifics about the interviews<br />
are given below. Shortly after beginning analysis of the first set of interviews, it was apparent that<br />
students not only exhibited misconceptions but also had a hard time answering any questions<br />
about planetary orbits that went beyond description.<br />
When asked about the reason that a planet stays in orbit around the Sun, over 70% of the interviewed<br />
students stated simply that gravity keeps the planets in orbit, an answer that does imply<br />
some level of understanding of the nature of planetary orbits. However, when the students were<br />
probed more deeply to find out what they understood about exactly how gravity causes the orbits,<br />
it was found that they often could not say much more than “gravity is what keeps planets in orbit”.<br />
Interestingly, the students often had no explanation about why the planets did not crash into the<br />
Sun, even though the Sun’s gravity attracted the planets towards it. Some explanations that were<br />
offered involved non-normative ideas such as gravity being both an attractive and repulsive force,<br />
the presence of another force at work in the Solar System, or the idea that the planets cannot crash<br />
into the sun simply because then there would not be a Solar System.<br />
<strong>The</strong> interviewed students were also asked a series of questions involving hypothetical situations<br />
with a test mass (e.g., “what if there were a small rock…”) at different locations, including at rest<br />
near a planet. <strong>The</strong> students did not show any understanding that this initially motionless test mass<br />
should behave differently than one with tangential velocity. Since the test mass is initially at rest, it<br />
would immediately be pulled gravitationally towards the planet instead of achieving an orbit. This<br />
was meant as a further probe about why the planets do not crash into the Sun. While, some of the<br />
interview subjects were sixth graders, who might not fully understand the question, the answers<br />
from 11 th and 12 th graders in a high school physics course were often qualitatively very similar to the<br />
answers of the 6 th grade students’.<br />
<strong>The</strong> hypothetical test mass interview questions also revealed misconceptions about the behavior of<br />
gravity with distance similar to those found by Palmer (2001) and Williamson & Willoughby (2012).<br />
For example, many students interviewed appeared to share the “boundary model” misconception<br />
© 2013 National <strong>Earth</strong> Science Teachers Association. All Rights Reserved.
Page 34<br />
<strong>The</strong> <strong>Earth</strong> <strong>Scientist</strong><br />
described in the latter article, where they believe that outside of some boundary, such as the <strong>Earth</strong>’s<br />
atmosphere, somehow gravity is zero. While these new interviews revealed correspondence with the<br />
misconception work of these cited authors, none of the studies asked questions about the nature of<br />
planetary orbits as did the ones included in the authors’ interview protocol. Thus, these interviews<br />
reveal new understanding about student thinking regarding planetary orbits, not found in the<br />
literature.<br />
Overall, only 10% of the students used the planets’ velocities in their explanation of planetary<br />
orbits and fewer than 25% could describe the behavior of gravity with distance. Ultimately, these<br />
interviews provided enough evidence to support the hypothesis that students have at best, only a<br />
superficial understanding of the role of gravity in supporting planetary orbits and almost no understanding<br />
of the additional need for a tangential velocity.<br />
Outline of a Lesson for Teaching<br />
<strong>The</strong> Role of Gravity in Planetary Orbits<br />
<strong>The</strong> interview data, documents that students do not seem to fully understand that that orbits<br />
are a balance between a planet’s motion and the Sun’s gravity as opposed to being solely caused<br />
by the Sun’s gravity. Specifically to help teachers address this concept, an activity was designed<br />
and included in a summer 2012 professional development workshop on Astronomy for in-service<br />
teachers.<br />
Figure 2. Photograph of a<br />
whiteboard from the 2012<br />
workshop that shows the<br />
teachers’ visualization of their<br />
data as they reported out to their<br />
peers during a “board meeting”.<br />
Photo by Alice Flarend.<br />
<strong>The</strong> workshop activity used the Physics Education Technology (PhET) simulation: “My Solar<br />
System” (http://phet.colorado.edu/en/simulation/my-solar-system), created by science content<br />
specialists, education specialists and software engineers at the University of Colorado at Boulder.<br />
This simulation displays the path of up to four astronomical objects as they interact via Newtonian<br />
gravity. <strong>The</strong> mass, initial velocity and distance between these objects can be specified either numerically<br />
or by manipulating screen icons. <strong>The</strong> teachers in the workshop (or students who would do<br />
a similar activity in class) were able to gather both quantitative data such as orbital period and<br />
qualitative data such as the orbital shape. <strong>The</strong> versatility of the simulation allows for exploration<br />
of multiple phenomena. An advantage to using the PhET simulations is that<br />
they can be downloaded to be used offline, so no class internet connection is<br />
required.<br />
During the workshop, the activity began with a general exploration to familiarize<br />
the participants with the simulation. As the participants explored the<br />
simulation’s controls, workshop facilitators guided them to explore the conditions<br />
needed for a less massive object (e.g., a planet) to orbit a more massive<br />
object (e.g., the Sun). <strong>The</strong> participants worked in small groups and experimented<br />
with changing the properties of objects in their simulated solar system,<br />
in order to make orbits of multiple shapes and sizes. <strong>The</strong> simulation is general<br />
enough that it can simulate, for example, binary stars of nearly equal mass.<br />
However, since the objective was to focus on conditions like those in the Solar<br />
System where there is a massive Sun orbited by significantly lower mass planets,<br />
they were provided with suggested initial conditions. A minimum mass of<br />
2000 kg for the central body and 20 kg for the satellite were specified so that<br />
the motion of the central body would be minimized, as it is in our own Solar<br />
System. Other than this, the parameters were left open for them to experiment<br />
on their own. After gathering data, each group of teachers recorded on a large<br />
(2’x3’) whiteboard the different parameters they tested and whether they were<br />
able to achieve a stable orbit of their planet around their Sun in the simulation.<br />
© 2013 National <strong>Earth</strong> Science Teachers Association. All Rights Reserved.
Volume XXIX, Issue 2<br />
Page 35<br />
Following Desbien (2002), the participants were asked to share their findings by displaying their<br />
boards to each other in a “board meeting” (Figure 2). This board meeting technique is useful when<br />
there have been different investigations occurring (e.g., different parameters being explored by each<br />
group). A board meeting allows for efficient information sharing and critiquing as well as discussion<br />
of general trends across a variety of data sets. During the debriefing session, the participants<br />
noticed that different velocities led to variations in both the shape and stability of an orbit.<br />
After getting a broad overview of the patterns seen by varying multiple parameters, the teachers<br />
engaged in an in-depth exploration of a specific parameter. For example, one group investigated<br />
how the velocity needed for a circular orbit changed with the distance from the central body, and<br />
another investigated how the velocity varied with the mass of the central body. <strong>The</strong> results were<br />
again displayed on whiteboards and the participants critiqued each other. By the end of the board<br />
meetings, the teachers saw patterns that showed how orbits required a delicate balance between<br />
velocity and gravitational pull: too little velocity led to an impact, while too much velocity led to an<br />
escape of the satellite from the gravity of the central body.<br />
A Pedagogical Framework for this Activity<br />
During this workshop, the teachers were also introduced to the “Claim, Evidence, and Reasoning”<br />
(CER) framework of McNeill and Krajcik (2012), so that they might in turn employ this methodology<br />
in their own instruction. <strong>The</strong> purpose of this framework is to advance the scientific writing<br />
skills of K-12 students as well as to emphasize that scientific conclusions are based on data and<br />
theoretical models. <strong>The</strong>se science process skills are part of the new Framework for K-12 Science<br />
Education and the Next Generation Science Standards (2012). Teachers were required to employ<br />
this pedagogical technique by articulating a claim about the nature of planetary orbits. <strong>The</strong>y used<br />
their work with the simulation to provide evidence that supported that claim, and then relied on<br />
their prior scientific knowledge about gravity to provide scientific reasoning for how their evidence<br />
supported their claim. Each group of four teachers wrote statements on their whiteboards with<br />
their group’s claim, evidence and reasoning. <strong>The</strong>y then shared their work in a final board meeting<br />
where each group provided the others a chance to give feedback. <strong>The</strong> discourse among the teachers<br />
following this activity was particularly rich. For example, by comparing the data used as evidence,<br />
the teachers found for themselves that planets that are more distant from the Sun can achieve<br />
stable orbits with smaller tangential velocities. <strong>The</strong>y then reasoned that this shows that the force<br />
of gravity falls off with increased distance, even though this particular point about the nature of<br />
gravity was not emphasized at any point previous to the concluding discussion.<br />
Conclusion<br />
<strong>The</strong> experience with this research project, and subsequent efforts in a teacher professional development<br />
workshop, have reinforced the importance of incorporating data on student learning as<br />
feedback that directly informs instruction. <strong>The</strong> instruction necessary for students to understand<br />
planetary orbits at more than a very superficial level, requires a focus on the balance between<br />
tangential velocity and gravity, and not just the presence of gravity alone, as indicated by the<br />
Pennsylvania standards. <strong>The</strong> authors feel strongly that this disconnect between scientific theory<br />
and educational standards needs to be addressed by a rich professional development experience<br />
for teachers, and classroom instruction for students. In this article, the authors presented one way<br />
in which this goal might be accomplished. It is expected that the disconnect between Pennsylvania<br />
standards related to gravity and planetary orbits is not widely recognized by teachers or curriculum<br />
developers. <strong>The</strong> cohort of teachers who attended the 2012 workshop have reported that activities<br />
like the one detailed here, have improved their content knowledge in Solar System astronomy and<br />
altered their instructional practice. One teacher reported that her students have impressed her with<br />
© 2013 National <strong>Earth</strong> Science Teachers Association. All Rights Reserved.
Page 36<br />
<strong>The</strong> <strong>Earth</strong> <strong>Scientist</strong><br />
their level of understanding following her revised astronomy instruction; this anecdotal remark<br />
is supported by classroom video of students asking questions that reveal expert understanding of<br />
planetary orbits. This exciting result suggests that teacher professional development efforts in Solar<br />
System astronomy can lead to real changes in student understanding.<br />
References<br />
Desbien, D. 2002. Modeling Discourse Management Compared to Other Classroom Management Styles in<br />
University Physics, Ph.D. <strong>The</strong>sis, Arizona State University.<br />
McNeill, K. L. and Krajcik J. S. 2012. Supporting Grade 5 – 8 Students in Constructing Explanations in Science.<br />
Boston, MA: Pearson.<br />
National Research Council, 2012. A Framework for K-12 Science Education Practices, Crosscutting Concepts,<br />
and Core Ideas,<br />
http://www.nap.edu/catalog.php?record_id=13165#toc<br />
Palmer, D. 2001. Students’ alternative conceptions and scientifically acceptable conceptions of gravity,<br />
International Journal of Science Education, 23:7, 691-706.Pennsylvania Department of Education, 2010.<br />
Pennsylvania Academic Standards for Science and Technology and Engineering Education, http://<br />
static.pdesas.org/content/documents/ Academic_Standards_for_Science_and_Technology_and_<br />
Engineering_Education_(Secondary).pdf<br />
Plummer, J.D., Flarend, A., Palma, C., Rubin, K., and Botzer, B.2013. Development of a learning progression for<br />
the formation of the solar system. Presented at the annual meeting of the National Association for Research in<br />
Science Teaching, Rio Grande, PR.<br />
Williamson, K. E. and Willoughby S. 2012. Student Understanding of Gravity in Introductory College<br />
Astronomy, Astronomy Education Review, 11, 010105.<br />
About the Authors<br />
Alice Flarend works as a veteran high school physics teacher at Bellwood-Antis High School and is a<br />
National Board Certified Teacher. She is a Physics Teacher Resource Agent of the American Association of<br />
Physics Teachers, and is also a doctoral candidate in the Science Education Program of Curriculum and<br />
Instruction at Penn State. Her research interests involve in-service teacher professional development. Alice<br />
can be reached at amf@blwd.k12.pa.us<br />
Christopher Palma is a Senior Lecturer of Astronomy and Astrophysics at Penn State, and he also served<br />
recently as the Associate Director of Outreach in the Eberly College of Science. His teaching interests<br />
include informal science education for K-12 students. His research interests include the study of globular<br />
clusters, dwarf galaxies, and stellar populations. Chris can be reached at cpalma@astro.psu.edu.<br />
Why should I open and read my NESTA ENews emails?<br />
NESTA’s monthly ENews provides brief summaries of stories and projects that<br />
have a direct link to the <strong>Earth</strong> Sciences and or the teaching of <strong>Earth</strong> Science.<br />
Many of these short articles provide links to more information or complete<br />
websites that those interested can follow. <strong>The</strong> ENews also contains information<br />
regarding teacher opportunities for research, professional development, and<br />
even grants. <strong>The</strong> reader will also find a calendar with items that have time<br />
critical information or may be occurring later that month or the next month. Each<br />
month, the ENews provides links to a selected state’s <strong>Earth</strong> Science sites. For<br />
example in the November 2012 issue we focused on <strong>Earth</strong> Science resources in<br />
Arizona, the state where the 2012, December NSTA Area Conference was held.<br />
© 2013 National <strong>Earth</strong> Science Teachers Association. All Rights Reserved.
Volume XXIX, Issue 2<br />
Page 37<br />
An Integrated Model<br />
for Instruction in<br />
Deep Time, Mass Extinctions<br />
and Radiometric Decay<br />
Tanya Furman, Department of Geosciences,<br />
Pennsylvania State University<br />
Abstract<br />
Within the scientific community there is nearly universal consensus about the age of the<br />
<strong>Earth</strong>, but neither the time scale nor the methodology by which it was determined is intuitively<br />
familiar to teachers and learners of <strong>Earth</strong> science. Contextualized instruction about<br />
rocks, minerals and fossils can develop greater understanding by making explicit linkages<br />
among deep time, the development of the geological time scale, mass extinctions and the<br />
techniques used to measure the ages of rocks. This approach also integrates numeracy and<br />
literacy skills across the curriculum and can be used for differentiated instruction within a<br />
single classroom or across grade levels.<br />
Introduction: Deep Time and the Age of the <strong>Earth</strong><br />
Deep time, or geologic time, is fundamental to understanding <strong>Earth</strong> processes. Most geological<br />
events happen slowly and over such extremely long periods of time that are outside the realm of<br />
human experience and observation. This foundational concept was first fully articulated in the<br />
18 th century by James Hutton (1788) and today still provides challenging opportunities for instruction.<br />
While scientists readily agree that the <strong>Earth</strong> formed ~4.5 billion years ago, understanding the<br />
evidence used to establish this age requires detailed knowledge of solar system formation or great<br />
faith in scientific observations and interpretations that appear impossible to verify. Not only are the<br />
time periods involved disconcertingly long, but the processes of radiometric decay (used to calculate<br />
the age of an appropriate rock or mineral) and planetary accretion (used to justify the choice<br />
of meteorites as analogues to <strong>Earth</strong>) are typically introduced in middle or high school, years after<br />
the introduction of rocks, minerals, dinosaurs and geologic time. This article explores an alternative<br />
approach to teaching this suite of topics that helps students go beyond memorizing unfamiliar<br />
and disconnected names, and replaces them with a historically and scientifically sound reasoning<br />
scheme to scaffold understanding of geologic terms and processes.<br />
Research has consistently found that learners of all ages typically grasp and retain the overall<br />
sequence of biological events in <strong>Earth</strong> history, from the appearance of first life to the rise of the dinosaurs<br />
and finally the advent of humans (Trend, 1998, 2000, 2001; Dodick and Orion, 2003; Libarkin<br />
et al., 2007; Guertin et al., 2011). Other biological events, such as the origin of vertebrates or the<br />
extinction of the dinosaurs, are less frequently mentioned by students and indeed may generate<br />
© 2013 National <strong>Earth</strong> Science Teachers Association. All Rights Reserved.
Page 38<br />
<strong>The</strong> <strong>Earth</strong> <strong>Scientist</strong><br />
substantial confusion. Further, the dates at which any particular biological events occurred are<br />
poorly recollected. For example, Guertin et al. (2011) found that among a group of Pennsylvania<br />
teachers from grades 4-12 at a workshop on Plate Tectonics, while over 90% knew the correct<br />
sequence of the above events, only 29% knew the date at which the first humans appeared and only<br />
18% could provide the date at which the dinosaurs first evolved. Without knowing the actual ages<br />
of significant <strong>Earth</strong> events – biological or geological – it becomes impossible to facilitate learning<br />
about <strong>Earth</strong> history and processes, as well as sending a message that quantification is neither<br />
important nor relevant to scientific understanding.<br />
Evidence for the age of the <strong>Earth</strong><br />
<strong>The</strong>re is no direct scientific evidence from which we can easily explain the age of the <strong>Earth</strong>. <strong>The</strong><br />
oldest rocks on our planet, found on the cratonic portions of Australia, Africa, North America, Asia<br />
and Greenland, are between 3.8-3.9 billion years old. Sedimentary minerals within these rocks have<br />
been dated to 4.1-4.2 billion years, but both the rocks and the minerals provide us with a minimum<br />
age only: <strong>Earth</strong> must have formed and cooled substantially before sedimentary processes became<br />
established. Our evidence for the age of the <strong>Earth</strong> comes from study of meteorites. Multiple isotopic<br />
analyses of some ~70 meteorite samples yield ages that cluster around 4.55 billion years, and that<br />
value is adopted for the <strong>Earth</strong> as well (e.g., Stassen, 2005). Many assumptions are invoked as we<br />
establish the age of the <strong>Earth</strong>, and while they are scientifically valid and appropriate they are not<br />
intuitively apparent to students and are often omitted in classroom discussion. A consequence of<br />
this omission is that it opens the door to non-scientific explanations by asking students to accept<br />
unsubstantiated and untestable claims. Assumptions involved in determining the age of the <strong>Earth</strong><br />
include the following: (1) meteorites formed contemporaneously with our planet, (2) meteoritic<br />
materials have not undergone material recycling through plate tectonic processes, (3) while individual<br />
meteorites are not compositionally like the <strong>Earth</strong>, a weighted aggregate of meteorites does<br />
share <strong>Earth</strong>’s bulk composition, (4) elements such as Pb and U were distributed evenly in the solar<br />
nebula. While full discussion of these assumptions is likely beyond the scope of the middle school<br />
classroom, acknowledgement of the scientific approach is important to include.<br />
Improving classroom understanding of radiometric decay<br />
Classroom discussions of geologic time are often presented in the context of radiometric decay.<br />
Many laboratory activities that introduce this topic involve candy pieces, and assume that students<br />
already have an understanding of atomic structures. Application of these activities to geologic<br />
processes is challenging, because most of our useful information comes from atoms that decay<br />
to generate atoms of a different and unfamiliar element (e.g., K-Ar, U-Pb, Sm-Nd, Rb-Sr) and<br />
this process is difficult to mimic with candy. In contrast, 14 C dating is more accessible to student<br />
learning, because the root element is already familiar and remains constant. <strong>The</strong> reliance on 14 C<br />
introduces two fundamental difficulties that are worth recognizing. First, the time scale of carbon<br />
decay is not applicable to deep time and thus provides no insight into the age of the <strong>Earth</strong>. Second,<br />
and more importantly, dateable carbon is found exclusively in organic materials. As discussed<br />
below, life forms and their remains (fossils) can only be used to establish a relative geological time<br />
scale whereas the absolute time scale must be determined from igneous or metamorphic rocks.<br />
Emphasizing the use of 14 C dating can thus lead to fundamental confusions regarding the geologic<br />
time scale.<br />
Understanding radiometric decay in a geological context can be facilitated by using relevant<br />
examples from rocks and minerals. We start by explaining that a radiometric age date records the<br />
amount of time that has passed since the sample cooled to a temperature at which solid state diffusion<br />
stops. This statement helps present geologic systems as dynamic and thermally-driven, both<br />
© 2013 National <strong>Earth</strong> Science Teachers Association. All Rights Reserved.
Volume XXIX, Issue 2<br />
Page 39<br />
key concepts for eventual comprehension of plate tectonic processes. From that perspective, the<br />
need for igneous and metamorphic rocks – both of which have been very warm – becomes clear.<br />
This recognition also provides an important segue into instruction about minerals: rather than<br />
memorizing suites of uncommon sample names, students can focus their learning on abundant<br />
and common minerals that provide key insights into the age of the <strong>Earth</strong>. <strong>The</strong> element potassium<br />
(root element for K-Ar dating) is abundant in K-feldspar, micas and amphiboles, while uranium<br />
(root element for U-Pb dating) is abundant in zircon and apatite. All of these minerals are common<br />
in granites and in many metamorphic rocks, as well as being readily available as student samples<br />
within an <strong>Earth</strong> Science classroom, and this approach helps students tie together the many threads<br />
of <strong>Earth</strong> science.<br />
<strong>The</strong> geological time scale<br />
<strong>The</strong> geological time scale is a beautiful example of interdisciplinary collaboration carried out by<br />
scientists over centuries and across continents. Fossil sequences provide clear relative time scales,<br />
but only where rocks of any particular age are exposed. <strong>The</strong> relative time scale based on fossil<br />
evidence thus captures research carried out on sedimentary sequences in quarries and road cuts on<br />
every continent. <strong>The</strong> geological eras and periods often take their names from key localities where<br />
this research was performed (Table 1). It is important to recognize that every named, geologic<br />
period records a fundamental global change in the fossil record, i.e., a mass extinction event related<br />
to profound environmental change of uncertain cause. Absolute ages as determined from igneous<br />
and metamorphic rocks are required to date these events in the geologic record, and also require the<br />
discovery and age determination of appropriate samples in key locations around the world.<br />
Classroom time spent discussing the geological time scale provides important cross-curricular<br />
linkages. <strong>The</strong> time scale in Table 1 explains the period names in accessible language that is easily<br />
related to geographic and historical themes, promoting literacy engagement across science and the<br />
CENOZOIC ERA<br />
(Age of Recent Life)<br />
MESOZOIC ERA<br />
(Age of Medieval Life)<br />
PALEOZOIC ERA<br />
(Age of Ancient Life)<br />
PRECAMBRIAN ERA<br />
Quaternary Period<br />
Tertiary Period<br />
Cretaceous Period<br />
Jurassic Period<br />
Triassic Period<br />
Permian Period<br />
Pennsylvanian Period<br />
Mississippian Period<br />
Devonian Period<br />
Silurian Period<br />
Ordovician Period<br />
Cambrian Period<br />
<strong>The</strong> geologic eras were originally named Primary, Secondary, Tertiary and<br />
Quaternary. <strong>The</strong> first two names are no longer used. Tertiary and Quaternary are<br />
now used as period designations.<br />
Derived from Latin word for chalk (creta) and first applied to extensive deposits<br />
that form white cliffs along the English Channel.<br />
Named for the Jura Mountains, located between France and Switzerland, where<br />
rocks of this age were first studied.<br />
Taken from the word “trias” in recognition of the threefold character of these<br />
rocks in Europe.<br />
Named after the province of Perm, Russia, where these rocks were first studied.<br />
Named for the state of Pennsylvania where these rocks have produced much<br />
coal.<br />
Named for the Mississippi River Valley where these rocks are well exposed.<br />
Named after Devonshire, England, where these rocks were first studied.<br />
Named after Celtic tribes, the Silures and the Ordovices, that lived in Wales<br />
during the Roman Conquest.<br />
Taken from the Roman name for Wales (Cambria) where rocks containing the<br />
earliest evidence of complex forms of life were first studied.<br />
<strong>The</strong> time between the birth of the planet and the appearance of complex forms<br />
of life. More than 80% of the <strong>Earth</strong>’s estimated 4.55 billion years of history fall<br />
within this era.<br />
http://pubs.usgs.gov/gip/geotime/divisions.html<br />
© 2013 National <strong>Earth</strong> Science Teachers Association. All Rights Reserved.
Page 40<br />
<strong>The</strong> <strong>Earth</strong> <strong>Scientist</strong><br />
humanities. Many good activities around the scale of geologic time help promote numeracy and the<br />
familiarity with large numbers that are the hallmarks of <strong>Earth</strong> science.<br />
Conclusion<br />
Teachers of <strong>Earth</strong> science typically face challenges in delivering a curriculum that is integrative and<br />
focused on building connections, rather than one which emphasizes memorization and lower-order<br />
thinking skills, because of the tremendous number of terms that are in everyday use in the field.<br />
This article provides a way to introduce a small suite of rock and mineral names within the context<br />
of understanding radiometric decay in a geological context as well as both absolute and relative<br />
geologic time. It also promotes discussion of the historical and geographic origins of the geological<br />
time scale, which enables further links to both literacy and numeracy that can be addressed within<br />
a self-contained classroom or with partner teachers in other disciplines. By using this approach,<br />
it is possible to introduce an understanding of the age of the <strong>Earth</strong> in light of the processes that<br />
formed our planet rather than asking students to accept an unimaginably large number as the indefensible<br />
truth. With this approach, the integrated nature of the science can be brought to bear in a<br />
welcoming environment where significant ideas and processes are discussed and made to connect<br />
with one another.<br />
Bibliography<br />
Dodick, J. and Orion, N., 2003. Cognitive factors affecting student understanding of geologic time. Journal of<br />
Research in Science Teaching, 40, 415-422.<br />
Guertin, L., Licona, P. and Pickard, M., 2011. Middle and high school teacher misconceptions of geologic time.<br />
Abstracts with Programs (Geological Society of America), 43, 67.<br />
Hutton, J., 1788. <strong>The</strong>ory of the <strong>Earth</strong>; or an investigation of the laws observable in the composition,<br />
dissolution, and restoration of land upon the Globe. Transactions of the Royal Society of Edinburgh,<br />
1,209–304.<br />
Libarkin, J.C., Kurdziel, J.P. and Anderson, S.W., 2007. College student conceptions of geological time and the<br />
disconnect between ordering and scale. Journal of Geoscience Education, 55, 413-422.<br />
Stassen, C. 2005. <strong>The</strong> age of the <strong>Earth</strong>. http://www.talkorigins.org/faqs/faq-age-of-earth.html.<br />
Trend, R., 1998. An investigation into understanding of geological time among 10- and11-year old children.<br />
International Journal of Science Education, 20, 973–988.<br />
Trend, R., 2000. Conceptions of geological time among primary teacher trainees, with reference to their<br />
engagement with geosciences, history and science. International Journal of Science Education, 22,<br />
539–555.<br />
Trend, R., 2001. Deep time framework: A preliminary study of UK primary teachers’ conceptions of geological<br />
time and perceptions of geoscience. Journal of Research in Science Teaching, 38, 191–221.<br />
About the Author<br />
Tanya Furman is both a Professor of Geosciences and Assistant Vice President and Associate Dean for<br />
Undergraduate Education at Penn State University in University Park, PA. Her research focuses on the<br />
geochemistry of volcanoes in extensional environments and on teaching and learning in <strong>Earth</strong> Science<br />
classrooms at the university level. Dr. Furman can be reached at furman@psu.edu<br />
© 2013 National <strong>Earth</strong> Science Teachers Association. All Rights Reserved.
Volume XXIX, Issue 2<br />
Page 41<br />
<strong>The</strong> Successes and Challenges<br />
of Establishing PAESTA,<br />
a New Professional<br />
Community for Teachers<br />
<strong>The</strong>resa Lewis-King, AMY Northwest Middle School<br />
Laura Guertin, Penn State Brandywine<br />
Abstract<br />
<strong>The</strong> Pennsylvania <strong>Earth</strong> Science Teachers Association (PAESTA) was established in 2011<br />
as a professional community for <strong>Earth</strong> and Space science educators across Pennsylvania<br />
and beyond. <strong>The</strong> organization is led by an Executive Committee and a Teacher Advisory<br />
Committee that meet monthly to shape plans for the membership. PAESTA provides<br />
opportunities for networking through its annual conference and for member recognition<br />
through monthly, eNewsletter features, and a year-end teaching award. A supporting<br />
website provides access to existing resources and curricular materials provided by PAESTA<br />
members, as well as an advocacy page that speaks to national needs in the <strong>Earth</strong> and Space<br />
sciences. Although its initial growth has been successful, PAESTA faces the challenge of<br />
broadening the participation of teachers and increasing the resources available to the<br />
<strong>Earth</strong> and Space science community.<br />
Introduction<br />
<strong>The</strong> Pennsylvania <strong>Earth</strong> Science Teachers Association (PAESTA, Figure 1) was chartered<br />
in 2011 as a state chapter of the National <strong>Earth</strong> Science Teachers Association (NESTA).<br />
PAESTA was established with the purpose of promoting, improving and coordinating<br />
<strong>Earth</strong> and Space science education at all levels in the state of Pennsylvania. PAESTA<br />
membership is currently free and is open to all K-16 educators; however, our main audience<br />
comprises Pennsylvania K-12 classroom teachers, informal educators and pre-service teachers.<br />
<strong>The</strong> current membership also includes educators from five states outside of Pennsylvania.<br />
Figure 1. <strong>The</strong> logo of the<br />
Pennsylvania <strong>Earth</strong> Science<br />
Teachers Association (PAESTA).<br />
<strong>The</strong> organization was conceived by two Pennsylvania State University faculty members, Tanya<br />
Furman (Geosciences, Penn State University Park) and Laura Guertin, (<strong>Earth</strong> Science, Penn State<br />
Brandywine) who understood the value and necessity of including in the initial development of<br />
a statewide organization, the voices of practicing K-12 teachers, especially those from the middle<br />
grades where <strong>Earth</strong> and Space science are taught in Pennsylvania. <strong>The</strong>y were guided by accepted<br />
research on the role of teacher leadership in implementing and sustaining educational reform<br />
(e.g., Wynne, 2001) in addition to lessons they learned from their engagement with K-12 teacher<br />
professional development projects such as the Transforming <strong>Earth</strong> System Science Education<br />
(TESSE) program (Graham et al., 2007). PAESTA was established and continues to be funded<br />
© 2013 National <strong>Earth</strong> Science Teachers Association. All Rights Reserved.
Page 42<br />
<strong>The</strong> <strong>Earth</strong> <strong>Scientist</strong><br />
from the Penn State <strong>Earth</strong> and Space Science Partnership (National Science Foundation Award<br />
#DUE-0962792).<br />
<strong>The</strong> Teacher Advisory Committee<br />
<strong>The</strong> PAESTA Executive Committee (President, President-Elect, Secretary/Treasurer and Past<br />
President), challenged with the mission of connecting <strong>Earth</strong> and Space science teachers throughout<br />
the entire state of Pennsylvania, conceived of the formation of a teacher advisory committee. <strong>The</strong><br />
thought was that an active PAESTA Teacher Advisory Committee (TAC) could be instrumental in<br />
ensuring that PAESTA was responsive to the needs of the teachers it serves. <strong>The</strong> first meeting of<br />
TAC, composed of four experienced middle school teachers of <strong>Earth</strong> and Space science, took place<br />
in June 2012 at the Penn State Brandywine campus. <strong>The</strong>y envisioned their primary role as creating<br />
opportunities for Pennsylvania <strong>Earth</strong> and Space science teachers to develop professional communities<br />
across curricular content, grade level and district/geographical boundaries.<br />
Some early proposals from the TAC have proven valuable in advancing the growth of the organization,<br />
especially in showcasing teaching achievements. Based on TAC suggestions, PAESTA<br />
recognizes a Featured Member and monthly PAESTAR on its website and in its eNewsletter. <strong>The</strong><br />
Featured Member highlights an individual teacher and the specific ESS content taught in that<br />
teacher’s classroom. <strong>The</strong> featured teachers present “best” instructional practices in their own words<br />
and provide additional resources useful for teaching that specific content. This format provides an<br />
authentic context for teacher-to-teacher exchange of age appropriate <strong>Earth</strong> science lessons proven<br />
in the classroom. <strong>The</strong> TAC also felt strongly about the importance of recognizing and promoting<br />
ordinary teachers who often do the extraordinary work providing leadership and support for other<br />
teachers in their school buildings and districts. <strong>The</strong> PAESTAR, a monthly Pennsylvania <strong>Earth</strong><br />
Science Teacher Achievement Recognition, shines a spotlight on a PAESTA member who has made<br />
a notable contribution to the <strong>Earth</strong> and space science community and/or has served as a leader in<br />
the discipline.<br />
<strong>The</strong> PAESTA Executive Committee<br />
<strong>The</strong> PAESTA Executive Committee relies on the TAC to help develop and sustain an organization<br />
relevant to and responsive to the needs of Pennsylvania educators and students. In many school<br />
districts throughout Pennsylvania, <strong>Earth</strong> science teachers work in isolation with minimal opportunities<br />
for professional collaboration with other teachers or <strong>Earth</strong> science professionals. <strong>The</strong>re are a<br />
limited number of <strong>Earth</strong> science classes offered in Pennsylvania high schools, instead the emphasis<br />
is placed on physical and life science with Biology, Physics and Chemistry the predominate high<br />
school course offerings. <strong>Earth</strong> science is primarily taught in an integrated middle school science<br />
curriculum that covers life, physical, <strong>Earth</strong> and environmental science content. Pennsylvania middle<br />
school <strong>Earth</strong> science content includes: systems, models and patterns; <strong>Earth</strong> features and processes;<br />
weather, climate, and atmosphere; and the composition and structure of the universe. Improving<br />
<strong>Earth</strong> science instruction requires connecting professional geologists, research scientists, teachers<br />
and students. Professional geologists can provide teachers with current information about industry<br />
needs and help teachers prepare their students for possible careers in <strong>Earth</strong> science. Developing<br />
professional communities between academic researchers and classroom teachers helps develop<br />
<strong>Earth</strong> science educators equipped with the knowledge and skills necessary to teach rich, complicated<br />
science content using effective strategies that engage students.<br />
<strong>The</strong> PAESTA Conference<br />
<strong>The</strong> Executive Committee’s desire to build bridges between professional geoscientists, the Penn<br />
State academic faculty, teachers and students sparked the creation of an annual conference.<br />
© 2013 National <strong>Earth</strong> Science Teachers Association. All Rights Reserved.
Volume XXIX, Issue 2<br />
Page 43<br />
PAESTA held its first conference October 12-13,<br />
2012, at Penn State Brandywine in Media, PA, with<br />
49 educators in attendance (Figure 2). <strong>The</strong> TAC<br />
provided valuable leadership in designing the conference<br />
format and ultimately presenting some of the<br />
dynamic teacher-led workshop sessions. <strong>The</strong> focus<br />
of this inaugural conference was on linking <strong>Earth</strong><br />
and Space science instruction with career opportunities,<br />
which was coincident with the theme of the<br />
National <strong>Earth</strong> Science Week for 2012. <strong>The</strong> keynote<br />
speaker for the conference was Heather Houlton,<br />
Outreach Coordinator at the American Geosciences<br />
Institute (AGI) Workforce Program. She highlighted<br />
the importance of helping students explore the<br />
wide range of careers available in the geosciences, connecting the students’ personal interests with<br />
current and future career opportunities in <strong>Earth</strong> science related fields. She gave conference participants<br />
a guided tour of the student-friendly resources available through the AGI Geosciences Career<br />
website (https://www.agiweb.org/workforce ).<br />
A collaborative model of developing <strong>Earth</strong> system<br />
science resources for the PAESTA community was<br />
used in the design of the conference. <strong>The</strong> TAC<br />
was enthusiastic about getting teachers to have<br />
productive conversations with each other during<br />
the conference sessions. One effective approach was<br />
to have conference participants working in small<br />
groups using a set of Pennsylvania State Standards<br />
from across disciplines to begin developing a structure<br />
for an online professional community. <strong>The</strong><br />
online community will ultimately provide a place<br />
where all members can find instructional materials<br />
on <strong>Earth</strong> science topics, actively contribute<br />
to lesson planning resources, and find inspiration<br />
for their teaching. Incorporated in the conference<br />
schedule were several opportunities for participants to selfselect<br />
small workshop sessions organized around topics<br />
directly related to their professional interests. Some of the<br />
classroom instruction related sessions included: Claims,<br />
Evidence, Reasoning (CER): Helping Students to Construct<br />
Scientific Explanations; <strong>The</strong> iPad as an Instructional Tool;<br />
A Cemetery as a Site for Multidisciplinary Teaching; and<br />
Introduction to Google Apps. <strong>The</strong>re also were sessions<br />
focused on professional practices, educational research and<br />
specific <strong>Earth</strong> science content knowledge.<br />
In addition to the conference sessions, the Executive<br />
Committee instituted the PAESTA Award for Teaching<br />
Excellence (separate from the regional NAGT Outstanding<br />
<strong>Earth</strong> Science Teacher Award) for the purpose of acknowledging<br />
a dedicated Pennsylvania K-12 educator who makes<br />
Figure 2. Introduction to the<br />
PAESTA conference session,<br />
“Collaborative Approach to<br />
Developing <strong>Earth</strong> System Science<br />
Resources Through PAESTA.”<br />
Photo by Laura Guertin.<br />
Figure 3. Conference participants<br />
working in small groups during<br />
the PAESTA conference.<br />
Photo by Laura Guertin.<br />
Figure 4. Heather Spotts, winner<br />
of the 2012 PAESTA Award for<br />
Teaching Excellence.<br />
Photo by Laura Guertin.<br />
© 2013 National <strong>Earth</strong> Science Teachers Association. All Rights Reserved.
Page 44<br />
<strong>The</strong> <strong>Earth</strong> <strong>Scientist</strong><br />
exemplary contributions to the field of <strong>Earth</strong> and Space science education. <strong>The</strong> 2012 PAESTA<br />
Award for Teaching Excellence was presented to Heather Spotts, a 6 th grade, general science teacher<br />
from a rural district in Centre County, PA (Figure 4). Heather has worked hard to build strong<br />
partnerships with colleagues, thus laying the foundation for a thriving professional learning<br />
community in her district and beyond. For example, since its beginning, Heather has been a major<br />
partner in the Academic STEM Alliance which is composed of three rural school districts in central<br />
Pennsylvania. She remains actively involved because she is always seeking out opportunities for<br />
herself and her students to enrich their understanding of science.<br />
From conference participant feedback, the PAESTA Executive Committee hasrealized the need<br />
to help teachers develop professional learning communities across curricular content, grade level<br />
and district/geographical boundaries. Although this is a legitimate organizational goal, there<br />
are clear challenges that include time constraints, insufficient content knowledge on the part of<br />
teachers, lack of high-quality material and instructional resources, and at times, lukewarm school<br />
district administrative support. All conference participants agreed that a collaborative approach<br />
was the most effective way to help develop and sustain PAESTA and its mission. Participants were<br />
extremely excited about the conference’s <strong>Earth</strong> science career focus because it was thought practical<br />
to connect quality <strong>Earth</strong> science instruction to the prospect of increasing the number of students<br />
interested in the geosciences. Having up-to-date information about career options helps teachers<br />
design coursework that is relevant to existing <strong>Earth</strong>-related issues, encourages exploration and<br />
pursuit of careers in the geosciences, and helps them answer their students’ question, “Why is <strong>Earth</strong><br />
science important to study?”<br />
Next Steps for PAESTA<br />
Within a short period of time,PAESTA has established a foundation for growing and maintaining a<br />
vibrant statewide organization. In the spirit of collaboration, to avoid replicating resources that are<br />
currently available and for the purpose of sharing and exchanging information, PAESTA has begun<br />
an active outreach program. It has also begun to contact PA school districts, classroom teachers,<br />
state universities and colleges with active <strong>Earth</strong> science degree programs, and state and national<br />
science organizations such as the National <strong>Earth</strong> Science Teachers Association (NESTA), the<br />
National Science Teachers Association (NSTA), and the Pennsylvania Science Teachers Association<br />
(PSTA). <strong>The</strong> Executive Committee will be forming other committees as needed to help advance the<br />
mission of the organization.<br />
<strong>The</strong> PAESTA website (http://www.paesta.org/) is established and yet is under continual development.<br />
<strong>The</strong> website is designed to be the principal vehicle for promoting professional community,<br />
disseminating information about <strong>Earth</strong> and Space science, and providing relevant information<br />
about current geological events. <strong>The</strong> website has recently been re-designed with teacher input to<br />
make it easier for teachers to navigate quickly and efficiently based on their instructional needs. <strong>The</strong><br />
goal is to provide teachers and other community educators a central clearinghouse for accurate and<br />
reliable sources of information about <strong>Earth</strong> and Space science.<br />
By its very nature and mission, PAESTA must confront the challenge of building professional<br />
community and maintaining connections among its members. This situation requires effective<br />
use of limited resources and funding available through the Penn State <strong>Earth</strong> and Space Science<br />
Partnership to provide <strong>Earth</strong> and Space science curricular materials that have proven benefits in<br />
strengthening instructional outcomes for students. PAESTA’s success is dependent upon providing<br />
opportunities for K-12 teachers and community educators to communicate their needs, showcase<br />
their praxis, submit standards-based lesson activities, nominate themselves and colleagues for the<br />
various PAESTA recognitions, and serve as leaders in the organization. PAESTA is an example of an<br />
© 2013 National <strong>Earth</strong> Science Teachers Association. All Rights Reserved.
Volume XXIX, Issue 2<br />
Page 45<br />
active and developing organization that has established some important links among its members<br />
in Pennsylvania and beyond. Readers are invited to visit the PAESTA website and take advantage of<br />
the resources that are available to members and visitors. <strong>The</strong>re have been some important lessons<br />
learned that could benefit others who might be considering the development of their own statewide<br />
chapter of an <strong>Earth</strong> science teachers organization, like PAESTA.<br />
References<br />
Graham, K.J., Bryce, J.G., Brown, D., Darwish, A., Finkel, L., Froburg, E., Furman, T., Guertin, L., Hale, S.R.,<br />
Johnson, J., Porter, W., Smith, M., Varner, R. & Von Damm, K. 2007. <strong>The</strong> Transforming <strong>Earth</strong> System<br />
Science Education (TESSE) Program.EOS, Trans. AGU, 88(52), Fall Meet. Suppl., Abstract ED51A-0123.<br />
Wynne, J. 2001. Teachers as leaders in education reform. ERIC Digest, ERIC Clearinghouse on Teaching And<br />
Teacher Education. Washington, DC: American Association of Colleges for Teacher Education. ED462376<br />
2001-11-00. 7 p.<br />
About the Authors<br />
<strong>The</strong>resa Lewis-King is a middle school teacher at AMY Northwest Middle School in Philadelphia.<br />
<strong>The</strong>resa can be reached at paestateacher@gmail.com<br />
Laura Guertin is an Associate Professor of <strong>Earth</strong> Science at Penn State Brandywine, Media, PA. Her<br />
research involves studying how new and emerging technologies impact teaching and student learning<br />
in introductory-level <strong>Earth</strong> science courses at the university level. Dr. Guertin can be reached at<br />
guertin@psu.edu<br />
<br />
<br />
® <br />
Inexpensive<br />
Hands-on<br />
Accurate<br />
<strong>Earth</strong> & Space Models<br />
Alluvial Fan<br />
~ Topographic<br />
Landform Models<br />
Wave Refraction<br />
~ Oceanography<br />
Block Models<br />
geoblox.com<br />
© 2013 National <strong>Earth</strong> Science Teachers Association. All Rights Reserved.
Page 46<br />
<strong>The</strong> <strong>Earth</strong> <strong>Scientist</strong><br />
A Collaborative Approach to<br />
Developing <strong>Earth</strong> System Science<br />
Resources through PAESTA<br />
Jennifer Hoffman, <strong>The</strong> Agnes Irwin School<br />
Kelly Hunter, Snyder-Girotti Middle School<br />
Abstract<br />
<strong>The</strong> Pennsylvania <strong>Earth</strong> Science Teachers Association (PAESTA) is a a non-profit,<br />
educational organization committed to the advancement, extension, improvement and<br />
coordination of <strong>Earth</strong> Science education across all levels. It was created in 2011 as a state<br />
affiliate of the National <strong>Earth</strong> Science Teachers Association (NESTA). This article describes<br />
a workshop created by the Teacher Advisory Committee of PAESTA for the first annual<br />
PAESTA conference in October 2012 at the Brandywine campus of Penn State University.<br />
<strong>The</strong> goal of A Collaborative Approach to Developing <strong>Earth</strong> System Science Resources Through<br />
PAESTA was to facilitate partnership of K-12 teachers from across Pennsylvania in the<br />
construction of Pennsylvania standards based interdisciplinary units of study emphasizing<br />
current events and career opportunities related to <strong>Earth</strong> systems science. Via an initital<br />
conference session and continuing online discussion forums housed on the PAESTA<br />
website, the interdisciplinary units will continuously evolve. <strong>The</strong> organizers of the conference<br />
also sought to encourage greater participation in PAESTA and create a new paradigm<br />
for ongoing, personally directed professional development with emphasis on colleagial<br />
support and interaction. It is hoped that this article can be used as a template for other<br />
states that wish to start their own state affiliate of NESTA.<br />
Introduction<br />
<strong>The</strong> first annual conference of the Pennsylvania <strong>Earth</strong> Science Teachers Association (PAESTA) was<br />
held October 12-13, 2012 at Penn State Brandywine in Media, PA. Roughly 50 science teachers and<br />
other science professionals from across Pennsylvania and surrounding states attended the conference.<br />
This article describes a conference session which aimed to create Pennsylvania standards based<br />
interdisciplinary units through collaborations of teachers across all grade levels. A Collaborative<br />
Approach to Developing <strong>Earth</strong> System Science Resources Through PAESTA, developed by the PAESTA<br />
Teacher Advisory Committee (including Lewis-King and Guertin, this issue) and facilitated by the<br />
authors. <strong>The</strong> goal of the workshop was to bring teachers together across distance and grade band<br />
with the shared mission of improving curricular resources around several key <strong>Earth</strong> and Space<br />
© 2013 National <strong>Earth</strong> Science Teachers Association. All Rights Reserved.
Volume XXIX, Issue 2<br />
Page 47<br />
science topics that are relevant to the Pennsylvania state standards as well as the Next Generation<br />
Science Standards soon to be implemented nationwide. <strong>The</strong> Teacher Advisory Committee also<br />
sought to introduce a dedicated web-based vehicle to continue the collaboration after the close of<br />
the meeting.<br />
<strong>The</strong> Collaborative Approach<br />
To facilitate the workshop, the committee created several templates for incipient online forums on<br />
the PAESTA website (http://www.paesta.org/) that emphasize topical current events and associated<br />
career options in the realm of <strong>Earth</strong> systems science. <strong>The</strong>se several templates can be emulated<br />
by other ESTA organizations. <strong>The</strong> committee selected seven topics for the online communities: (1)<br />
<strong>Earth</strong>quakes as natural disasters; (2) Hurricanes as natural disasters; (3) Natural gas extraction in<br />
Pennsylvania; (4) Solar system exploration – do moons support life?; (5) <strong>The</strong>ory of plate tectonics;<br />
(6) Water cycle; and (7) Weather patterns. Conference<br />
attendees were given the opportunity at the onset of the<br />
workshop to select the topic that resonated most with their<br />
personal or professional interest. Teams were given time for<br />
introductions and then were presented with the template<br />
for their topical area – a selection of statements from several<br />
Pennsylvania and Common Core standards – to act as an<br />
initial focus for discussion and collaboration within the<br />
team (see Table 1). Standards chosen to frame the units on<br />
Natural gas extraction in Pennsylvania and Hurricanes as<br />
natural disasters, as well as the other topics, can be found<br />
in the Collaborative Approach discussion boards on the<br />
PAESTA website (http://www.paesta.psu.edu/forums/<br />
collaborative-approach). Teacher Advisory Committee<br />
members viewed the templates as a starting point for<br />
collaboration, acknowledging that the team may add to or<br />
subtract from the standard statements over time.<br />
Question: <strong>The</strong> natural gas industry is booming in Pennsylvania. Why<br />
is natural gas under Pennsylvania and what regions of the state have<br />
this natural resource? What job opportunities exist in the natural gas<br />
industry and what education or training is required? What are the<br />
impacts of the natural gas industry on the environment and how can<br />
technology play a role in protecting the environment?<br />
Question: Hurricanes are a common natural disaster that affects<br />
the Eastern and Southern Coasts of the US. With the destruction<br />
caused by massive hurricanes, like Hurricane Katrina, scientists are<br />
constantly exploring conditions that cause hurricanes. What are the<br />
conditions that create Hurricanes? What preparations can be done<br />
to help eliminate hurricane damage? What type of scientists work<br />
on hurricane predictions, preparations, and after effects? What<br />
technologies are used to study hurricanes?<br />
Instruction for each of the topics chosen by the Teacher Advisory Committee could be conducted<br />
as a stand-alone science unit or as part of a larger interdisciplinary unit across several disciplines.<br />
For example, a unit “Natural gas extraction in Pennsylvania” could be integrated with a variety of<br />
other subjects including, but not limited to, history, economics, English composition or language<br />
arts, <strong>Earth</strong> science, chemistry and environmental science. From a historical perspective, the unit<br />
could include a history of natural gas extraction in Pennsylvania, a history of the extraction of<br />
other natural resources in Pennsylvania, the role of the government and special interest groups in<br />
natural gas extraction, or a look at the societal impacts of the process. An economics class could<br />
conduct cost/benefit analyses of natural gas extraction in Pennsylvania and other states, as well as<br />
a cost comparison between natural gas and coal. Any language arts class could conduct research<br />
on the topic followed by a debate, presentation, or written assignment. Most standardized testing<br />
focuses on non-fiction reading comprehension and the language arts classes could also read essays<br />
on natural gas extraction for analysis. <strong>Earth</strong> science was the original focus for the unit; however, it<br />
could also be expanded within a chemistry or environmental science class as well.<br />
A “Hurricanes as a natural disaster” unit could also be designed with an interdisciplinary approach<br />
by including the following disciplines: geography, algebra, economics, history, language arts, <strong>Earth</strong><br />
science and environmental science. Within a geography class, the unit could examine the effects<br />
that physical processes have on an area’s topography and how the topography changes over time<br />
Table 1. Framing Questions for<br />
Group Discussions on Natural<br />
Gas Extraction in Pennsylvania,<br />
and Hurricanes as a Natural<br />
Disaster.<br />
© 2013 National <strong>Earth</strong> Science Teachers Association. All Rights Reserved.
Page 48<br />
<strong>The</strong> <strong>Earth</strong> <strong>Scientist</strong><br />
because of these processes. An algebra class could compute equations determining the speed of the<br />
hurricane or the distance it would travel, as well as, track and predict the path of the hurricane.<br />
Economics classes could determine costs for preparation, clean-up, and support and the effects<br />
these costs would have on local, state, and national governments. Since the United States has such<br />
an extensive history of hurricanes, history classes could examine past major hurricanes and their<br />
effects on the impacted area. Finally, language arts classes could analyze newspaper articles about<br />
past hurricanes or write essays from an emotional standpoint about what would happen if they lost<br />
everything in a hurricane or a scenario where they did not evacuate and lived through the hurricane.<br />
During the workshop, each team brainstormed for about 45 minutes while reflecting on the<br />
template of standard statements. Note-takers were assigned within each group to capture the brainstorming<br />
as the first entries for each online discussion forum on the PAESTA website. Participants<br />
were encouraged to continue submitting information, questions and resources to the discussion.<br />
As the communities worked on the unit development, members of the PAESTA Teacher Advisory<br />
Committee moved among the teams to answer questions, suggest ideas and facilitate discussions.<br />
As the communities worked, open communication and mutual respect among the group members<br />
was essential. All members played an active role in the development of the communities which<br />
led to a diverse range of ideas. This diversity created great discussions in the groups and a variety<br />
of ideas for the unit that would be beneficial to composing material accessible to teachers from<br />
any district, regardless of their school’s structure. Suggestions were presented for activities across<br />
many spectrums: urban to rural settings, low-budget to high-budget activities, elementary to postsecondary<br />
levels, minimal technology access to maximal technology access, private school settings<br />
to public school settings. <strong>The</strong> communities embraced all of the different backgrounds and worked<br />
to find ways to meet the needs of all its constituents.<br />
Outcomes<br />
<strong>The</strong> PAESTA Teacher Advisory Committee identified as the primary product of this workshop the<br />
creation of several online discussion forums housed on the PAESTA website. <strong>The</strong>se forums were<br />
conceived as a model of ongoing professional development that could serve to enhance teacher<br />
access to content resources, pedagogical strategies, interdisciplinary collaboration and career<br />
options related to specific topics in earth systems science. Online forums also serve to connect<br />
science teachers across the region, encouraging dissemination of information and resources.<br />
Additionally, the Committee hopes to encourage greater participation in PAESTA as participants<br />
continue to visit the PAESTA website to access their online forums. <strong>The</strong> workshop united teachers<br />
from various backgrounds into interactive communities that can continue into the future. This<br />
structured activity allowed teachers a chance to have a voice and to develop a product, as well as to<br />
build new professional relationships. Post-conference surveys indicated that participants valued the<br />
opportunity to work collaboratively in this setting. <strong>The</strong> hope is to continue to build these professional<br />
communities within PAESTA to achieve this purpose while also creating comprehensive units<br />
as a resource for the membership.<br />
Conclusion<br />
Ultimately, it is the hope of the PAESTA Teacher Advisory Committee, that the discussion forums<br />
function as springboards, for teacher-developed units of study that include non-fiction readings,<br />
teacher-vetted classroom activities, current events, and information on careers in the earth sciences.<br />
It is imperative that teachers prepare students for the highly technical careers of the 21 st century,<br />
and the increased demand for earth science professionals to design solutions to pressing, local<br />
© 2013 National <strong>Earth</strong> Science Teachers Association. All Rights Reserved.
Volume XXIX, Issue 2<br />
Page 49<br />
and global environmental problems, such as global warming, agricultural productivity, and the<br />
appropriate development of renewable and non-renewable energy resources. As many high-stakes<br />
standardized tests focus on non-fiction literature, one goal was to highlight sample readings that<br />
can be used within science units to foster reading fluency and comprehension. It is the perception<br />
of many earth science teachers, that students need more support connecting science learning in the<br />
classroom to current events and potential careers available to them. By facilitating greater access to<br />
contextualized information on current events and careers in units of study, the PAESTA Teacher<br />
Advisory Committee hopes the online communities developing on the PAESTA website, evolve to<br />
become important resources for teachers in states across the continent.<br />
About the Authors<br />
Kelly Hunter is an <strong>Earth</strong> and Space Science Teacher and Department Chair at Snyder-Girotti Middle<br />
School, in Bristol, PA. She is also the President-Elec for, and on the Teacher Advisory Committee of<br />
PAESTA. Kelly can be reached at kelcole3@gmail.com<br />
Jennifer Hoffman is an <strong>Earth</strong> and Space Science Teacher, AP Environmental Science Teacher and<br />
Department Chair at the Agnes Irwin School, in Rosemont, PA. She is a member of the Teacher<br />
Advisory Committee for PAESTA. Jennifer can be reached at jhoffman@agnesirwin.org<br />
Welcomes K-12 Teachers with<br />
programs tailored to your needs!<br />
• Geophysical Information for Teachers<br />
Workshops<br />
• Bright Stars<br />
• AGU Speaker at National NSTA<br />
Conference<br />
• AGU Membership includes weekly<br />
EOS magazine, with science updates<br />
and opportunities<br />
www.agu.org/education<br />
© 2013 National <strong>Earth</strong> Science Teachers Association. All Rights Reserved.<br />
12-3a Fall TES.indd 32 8/16/12 5:
Page 50<br />
<strong>The</strong> <strong>Earth</strong> <strong>Scientist</strong><br />
Student Conceptions of the Cause<br />
and Locations of <strong>Earth</strong>quakes<br />
Peter Licona, Penn State University<br />
Scott McDonald, Penn State University<br />
Tanya Furman, Penn State University<br />
Laura Guertin, Penn State Brandywine<br />
Abstract<br />
While many students are familiar with the geological phenomenon of earthquakes, still<br />
other students hold alternative conceptions about the causes and/or locations of earthquakes.<br />
For this study, assessments were administered to students (n = 359) ranging in<br />
age from elementary to high school level. Student responses were categorized as correct<br />
or incorrect based on inclusion of key terminology related to plate tectonics. Our results<br />
confirm that many students across grade levels hold alternative conceptions related to the<br />
causes and locations of earthquakes. This research has pedagogical and curricular implications<br />
for improving geoscience education.<br />
Introduction<br />
Students of all levels have some knowledge of the phenomenon of earthquakes. Students are<br />
exposed to media reports of earthquakes throughout the world as well as “reports” in television<br />
shows and Hollywood films. While many students are familiar with earthquakes and the<br />
damage they cause, they often do not fully understand the causes nor locations of earthquakes.<br />
Understanding the nature of commonly-held alternative conceptions can help teachers support<br />
students as they reach a better understanding of how, where and why earthquakes occur.<br />
Alternative Conceptions<br />
Alternative conceptions (Clark, et. al., 2011), sometimes referred to as misconceptions (Francek,<br />
2013), are those student-held ideas about scientific phenomena that deviate from the normative,<br />
scientifically accepted explanations. Students’ alternative conceptions often persist even after<br />
instruction around the normative scientific concepts. <strong>The</strong> origins of alternative conceptions are as<br />
varied as the conceptions themselves. Alternative conceptions can come from formal and informal<br />
educational settings, movies and television, the news media, folk stories, legends, as well as idiosyncratic<br />
ideas students develop on their own, related to a given phenomenon (Smith & Bermea 2012).<br />
Previous Studies of Student Conceptions of <strong>Earth</strong>quakes<br />
Research into student conceptions of the causes and locations earthquake is sparse but does show<br />
that many students have difficulties expressing scientifically accurate conceptions of the causes and<br />
locations of earthquakes. Tsai (2001) researched Taiwanese student conceptions about the causes<br />
© 2013 National <strong>Earth</strong> Science Teachers Association. All Rights Reserved.
Volume XXIX, Issue 2<br />
Page 51<br />
of earthquakes shortly following a destructive earthquake in Taiwan. He found that students’<br />
personal beliefs or their worldviews, which included the supernatural, myths, and scientific misconceptions,<br />
were what actually formed their conceptions about the causes of earthquakes. In his<br />
research, student responses that could be classified as scientifically accurate comprised only 27% of<br />
all responses.<br />
Ross and Shuell (1993) interviewed American students in grades K-6 about their understanding<br />
of earthquakes. <strong>The</strong>y noted that students had difficulty explaining the causes of earthquakes and<br />
many responded to interview questions that they did not know what causes earthquakes. A small<br />
percentage of students (~8%) responded that volcanoes cause earthquakes, and some students<br />
described earthquakes as producing weather-like conditions such as high winds and tornadoes. At<br />
the college level, Libarkin et al. (2005) analyzed 235 student responses to open-ended questionnaires<br />
and interviews on various <strong>Earth</strong> science topics. On a question related to the causes of earthquakes,<br />
11% of students replied that the causes were: people/animals, temperature/heat, gravity, air pockets/<br />
gas pressure, weather/climate, and lava/volcanoes.<br />
This article presents findings from preliminary research on student conceptions of the causes and<br />
locations of earthquakes, focusing on two research questions: (1) What are student conceptions<br />
about the causes of earthquakes? (2) What are student conceptions about the locations and pattern<br />
of locations of earthquakes?<br />
Methods<br />
This research is part of <strong>The</strong> Pennsylvania State University’s Targeted Math Science Partnership<br />
(NSF-MSP) grant that is collaborating with several Pennsylvania public school districts. In order to<br />
investigate Pennsylvania middle school students’ conceptions of earthquakes, the project developed<br />
a written assessment containing various questions ranging from the break-up of Pangaea, to the<br />
interior structure of <strong>Earth</strong>.<br />
During the spring of 2011, assessments were collected from 359 students in grades 4-12, from<br />
eleven schools representing four large, urban school districts and one suburban school district.<br />
<strong>The</strong>se students were not necessarily enrolled in earth science or a science course that had an<br />
earth science focus, as the research was not attempting to link instruction and students conceptions.<br />
Within the overall assessment, students were prompted to answer two questions related to<br />
earthquakes:<br />
1. <strong>The</strong>re have been several recent earthquakes in different parts of the world. For example,<br />
there were three very big earthquakes in Chile, Haiti and Japan that each caused a lot of<br />
damage. Please explain what causes earthquakes.<br />
2. Why do earthquakes occur most often in certain parts of the world?<br />
Assessments were analyzed, based on the terminology students used to explain the causes and locations<br />
of earthquakes. Responses were classified as correct or incorrect based on the inclusion or<br />
omission of terminology related to plate tectonics, faults, or release of energy (Libarkin et al., 2005).<br />
Responses to question one were initially grouped into three main categories: answers mentioning<br />
plate tectonics, faults, or the release of energy; those that do not; and no response (which included<br />
irrelevant responses and “I don’t know”). Responses that mentioned plate tectonics, faults, or<br />
the release of energy were categorized as “correct”. Those responses not mentioning them were<br />
categorized as alternative conceptions. As the research team was not going to be able to conduct<br />
follow-up interviews, the responses to question two were used to probe for deeper understandings<br />
of earthquakes.<br />
© 2013 National <strong>Earth</strong> Science Teachers Association. All Rights Reserved.
Page 52<br />
<strong>The</strong> <strong>Earth</strong> <strong>Scientist</strong><br />
Figure 1. Percentages of student<br />
alternative conceptions for<br />
causes of earthquakes<br />
Figure 2. Percentage of student<br />
alternative conceptions for<br />
locations of earthquakes<br />
Results<br />
Of 359 student responses, 216 of the 359 student responses (60%) were coded as correct. Fifty-six<br />
students (16%) either left the answer blank, responded with “I don’t know”, or responded with an<br />
irrelevant response. <strong>The</strong> remaining 87 of the 359 student responses (24%) were coded as alternative<br />
conceptions. <strong>The</strong> largest category among alternative conceptions (see Figure 1) consisted of answers<br />
that described movements of land, earth, or dirt but without explicit mention of tectonic plates.<br />
Examples include: “land rumbled and cracked”, “crack in the ground” and “earth moves”. <strong>The</strong><br />
second largest category among the alternative conceptions consisted of responses that described<br />
the action of or presence of water. Examples included: “the land is moving because water is pushing<br />
it”, “what causes earthquakes are sea or ocean”, “the<br />
ground shaking from too much water” and simply<br />
“water”. A few students mentioned volcanoes as the<br />
cause of earthquakes, which could indicate awareness<br />
of tremors associated with ascending magma<br />
but within the context of these students’ full suite<br />
of answers they appeared to represent alternative<br />
conceptions. Other factors categorized as alternative<br />
conceptions include climate and heat.<br />
In reference to the location of earthquakes, 148 of<br />
the 359 student responses (41%) mentioned plates,<br />
plate boundaries or faults. <strong>The</strong>re were 67 of the 359<br />
students (19%) who left the answer blank or responded<br />
with “I don’t know”. <strong>The</strong> remaining 144 of the 359<br />
student responses (40%) responses were considered<br />
alternative conceptions, the most common of which<br />
are represented in Figure 2. <strong>The</strong> largest category<br />
among the alternative conceptions consisted of<br />
responses in which water or oceans were included.<br />
Examples included: “because it’s near water or ocean”,<br />
“because they have big oceans”, and “certain parts of<br />
the world live near the ocean which may get earthquakes”.<br />
<strong>The</strong> second largest category was titled land/<br />
<strong>Earth</strong> and included responses such as, “there is high<br />
and low land”, “earth moves, and “more land”. A few<br />
students mentioned volcanoes as the cause of earthquakes,<br />
which could indicate awareness of tremors associated with ascending magma but within the<br />
context of these students’ full suite of answers they appeared to represent alternative conceptions.<br />
Other factors mentioned as alternative conceptions include people and heat.<br />
Discussion<br />
<strong>The</strong> results provide insight into some common conceptions that students have regarding both the<br />
causes and locations of earthquakes. Too many students across all grade bands demonstrate alternative<br />
conceptions or are able to articulate no conception at all. This result raises some concerns<br />
regarding instruction related to the causes and locations of earthquakes.<br />
It is important to consider how these alternative conceptions may have arisen. Most of the<br />
responses categorized as land/earth described the effects of an earthquake rather than the cause. This<br />
© 2013 National <strong>Earth</strong> Science Teachers Association. All Rights Reserved.
Volume XXIX, Issue 2<br />
Page 53<br />
type of conception indicates that teachers need to support students when differentiating between<br />
the cause of a geologic phenomenon and its effects. <strong>The</strong> responses that relate to water, both in<br />
terms of causality and location, might be explained in light of the recent earthquake in Japan, which<br />
resulted in a devastating tsunami. It is important for teachers to help students understand the<br />
information presented in the media and ensure they develop scientifically-appropriate understandings<br />
of the relationships between earthquakes and water, including tsunamis which can result from,<br />
but not cause, an earthquake. For example, teachers can present data showing earthquake locations<br />
distributed across the globe, helping students see that earthquakes occur far from bodies of water,<br />
as well as near.<br />
While the explanations for these alternative frameworks need to be explored and addressed through<br />
appropriate instruction, it is important also, to shed more light on responses categorized as<br />
“correct”. Mentioning plate tectonics, faults, or release of energy does not communicate full understanding<br />
of the causes and/or locations of earthquakes. Many of the student responses could be<br />
considered “incomplete”, or offer only a partial scientific explanation. Stating “plate tectonics” as<br />
a cause of earthquakes, or “plate boundaries” as the location of earthquakes does little to demonstrate<br />
that students have a rich conceptual understanding. <strong>The</strong>se answers do indicate that a student<br />
is at least familiar with terminology and its usage. Teachers must consider both these “correct”<br />
conceptions and students’ “alternative conceptions” as building blocks in order to help students<br />
achieve a more scientific understanding of a given geologic phenomenon. For example, a student<br />
response that states that earthquakes occur at plate boundaries can be considered a building block<br />
towards a deeper and more sophisticated understanding of earthquake patterns.<br />
Implications of Study<br />
<strong>The</strong> quantity and diversity of student alternative conceptions indicate the importance of assessing<br />
students’ prior knowledge as a regular part of regular instruction. As these alternative conceptions<br />
are brought to light, teachers should plan instructional strategies that can be used effectively to<br />
target these alternative conceptions. Written assessments of prior knowledge (Hein, 1999) with<br />
classroom discussion can be an effective way of revealing student conceptions (Furtak and Ruiz-<br />
Primo, 2008). Conceptual change literature (Posner et al, 1982) can be helpful in assisting teachers<br />
conceptualize the process of changing an alternative framework to a more scientific explanation.<br />
Classroom activities should be selected to provide students with the opportunity to address their<br />
own conceptions and build on them, while moving toward more normative understandings. One<br />
example the authors recommend is the Discovering Plate Boundaries activity developed by Sawyer<br />
et al. (2005). This activity is useful because it has students use data to investigate the locations of<br />
earthquakes across the globe, thus allowing them to confront their own prior conceptions of the<br />
locations of earthquakes, and also connect earthquakes to other, key <strong>Earth</strong> science phenomenon,<br />
such as volcanoes and plate boundaries.<br />
This research indicates that many students clearly hold a suite of alternative conceptions about<br />
the causes and locations of earthquakes. <strong>The</strong> implications are directly related to curriculum and<br />
instruction of this geoscience topic. It is important that teachers are aware of students’ alternative<br />
conceptions, but more important is that teachers are able to use student conceptions in preparing<br />
appropriate earth science lessons. Even though these results were based on assessing students in a<br />
wide range of grades, it is unrealistic to assume that these findings are generalizable to the entire<br />
population of students in the nation’s schools. What the results do provide is knowledge of the<br />
range of alternative conceptions which can then be used to plan effective instruction. Further<br />
research includes the recognition of patterns of conceptions within and across grade bands as well<br />
as instruction that targets alternative conceptions.<br />
© 2013 National <strong>Earth</strong> Science Teachers Association. All Rights Reserved.
Page 54<br />
<strong>The</strong> <strong>Earth</strong> <strong>Scientist</strong><br />
References<br />
Clark, S. K., Libarkin, J. C., Kortz, K. M., & Jordan, S. C. (2011). Alternative conceptions of plate tectonics held<br />
by nonscience undergraduates. Journal of Geoscience Education, 59(4), 251. doi:10.5408/1.365169.<br />
Francek, M. (2013). A compilation and review of over 500 geoscience misconceptions. International Journal of<br />
Science Education, 35(1), 31-64. doi:10.1080/09500693.2012.73664.<br />
Furtak, E. M. & Ruiz-Primo, M. A. (2008). Making students’ thinking explicit in writing and discussion: an<br />
analysis of formative assessment prompts. Science Education, 92(5), 799-824.<br />
Hein, T. L. (1999). Using writing to confront student misconceptions in physics. European Journal of Physics, 20,<br />
137 – 141.<br />
Libarkin, J. C., Anderson, S. W., Science, J. D., Beilfuss, M., & Boone, W. (2005) Qualitative analysis of college<br />
students’ ideas about the earth: interviews and open-ended questionnaires. Journal of Geoscience Education,<br />
53(1), 17-26.<br />
Posner, G. J., Strike, K. A., Hewson, P. W., & Gertzog, W. A. (1982). Accommodation of a scientific conception:<br />
toward a theory of conceptual change. Science Education, 66(2), 211-227.<br />
Ross, K. E. K. & Shuell, T. J. (1993). Children’s beliefs about earthquakes. Science Education, 77(2), 191-205.<br />
Sawyer, D., Henning, A., Shipp, S., & Dunbar, R. (2005). A data rich exercise for discovering plate boundary<br />
processes. Journal of Geoscience Education, 53(1), 65–74.<br />
Smith, G. A., & Bermea, S. B. (2012). Using students’ sketches to recognize alternative conceptions about<br />
plate tectonics persisting from prior instruction. Journal of Geoscience Education, 60(4), 350-359.<br />
doi:10.5408/11-251.<br />
Tsai, C-C. (2001). Ideas about earthquakes after experiencing a natural disaster in Taiwan: an analysis of<br />
students’ worldviews. International Journal of Science Education, 23(10), 1007-1016.<br />
About the Authors<br />
Peter R. Licona is a doctoral candidate in Science Education at <strong>The</strong> Pennsylvania State University. In<br />
addition to his doctoral studies, he is a research and teaching assistant. He was a science teacher for<br />
15 years before returning to pursue a Ph.D. His research interests include curricular and pedagogical<br />
strategies to enhance ethnic and linguistic minority groups’ access to science. Peter can be reached at<br />
prl5046@psu.edu<br />
Dr. Scott McDonald is an Associate Professor of Science Education at <strong>The</strong> Pennsylvania State<br />
University. He was high school Physics teacher prior to earning his Ph.D. in Science Education from<br />
the University of Michigan. He is Co-PI of the National Science Foundation funded <strong>Earth</strong> and Space<br />
Science Partnership (http://www.essp.psu.edu/) with research focusing on learning progression in<br />
Plate Tectonics and Astronomy. Dr. McDonald can be reached at smcdonald@psu.edu<br />
Tanya Furman is both a Professor of Geosciences and Assistant Vice President and Associate Dean for<br />
Undergraduate Education at Penn State University in University Park, PA. Her research focuses on the<br />
geochemistry of volcanoes in extensional environments and on teaching and learning in <strong>Earth</strong> Science<br />
classrooms at the university level. Dr. Furman can be reached at furman@psu.edu<br />
Laura Guertin is an Associate Professor of <strong>Earth</strong> Science at Penn State Brandywine, Media, PA. Her<br />
research involves studying how new and emerging technologies impact teaching and student learning<br />
in introductory-level <strong>Earth</strong> science courses at the university level. Dr. Guertin can be reached at<br />
guertin@psu.edu<br />
© 2013 National <strong>Earth</strong> Science Teachers Association. All Rights Reserved.
Volume XXIX, Issue 2<br />
Page 55<br />
Student and Teacher Conceptions<br />
of the <strong>Earth</strong>’s Interior Structure<br />
Megan Pickard, Department of Geosciences, Pennsylvania State University,<br />
Laura Guertin, Division of <strong>Earth</strong> Science, Penn State Brandywine<br />
Tanya Furman, Department of Geosciences, Pennsylvania State University<br />
Abstract<br />
This investigation explores student and teacher conceptions of the interior of the <strong>Earth</strong><br />
in upper elementary through high school grades in Pennsylvania. Student and teacher<br />
responses to two questions related to the structure of <strong>Earth</strong>’s interior reveal several<br />
common themes: misuse of terminology, incomplete conceptions, naïve conceptions, and<br />
learned conceptions. Teacher responses were overall more sophisticated than those of the<br />
students but indicate incomplete conceptions and confusion of physical versus chemical<br />
layers of <strong>Earth</strong>’s interior. Understanding the implications of the <strong>Earth</strong>’s interior requires<br />
knowledge of complex <strong>Earth</strong> processes. Popular instructional methods based on memorization<br />
of the layered planetary interior do not lead to an understanding of those processes.<br />
Instead early instruction should focus on easy to understand locations and patterns of<br />
observable phenomena. <strong>The</strong>se process-rich patterns set a foundation that can later be built<br />
upon when teaching the <strong>Earth</strong>’s interior as the students progress in their knowledge of<br />
<strong>Earth</strong> processes.<br />
Introduction<br />
Most K-12 <strong>Earth</strong> science units include stand-alone sections on rocks, minerals, volcanoes and<br />
earthquakes. Rich comprehension of these topics, however, requires understanding their interrelationships<br />
in a tectonic context. One ubiquitous example is the interior of the <strong>Earth</strong>, specifically,<br />
the identification of crust, mantle and core which in turn has implications that are profound to<br />
understanding the formation of the <strong>Earth</strong>, heat flow within and out of the <strong>Earth</strong> and plate tectonic<br />
processes. Unfortunately, this content is rarely presented in a way that promotes a connection to<br />
these processes. Instead, nearly every textbook provides an illustration of a cut-away model of the<br />
<strong>Earth</strong> from which students memorize the terms: crust, mantle, and core, and hopefully apply those<br />
terms correctly to the model. <strong>The</strong> meaning and implications of the interior of the <strong>Earth</strong> are typically<br />
lost in this method of teaching.<br />
In previous studies, both students and teachers demonstrated an incorrect understanding of the<br />
concepts of the <strong>Earth</strong>’s interior, such as viewing <strong>Earth</strong>’s interior as concentric spherical layers or flat<br />
layers (not spherical), being unable to correctly identify individual layers in the <strong>Earth</strong> or draw them<br />
to scale (e.g. Lillo 1994; DeLaughter et al. 1998; King 2000; Libarkin et al. 2005; Steer et al. 2005).<br />
Steer et al. (2005) found that even undergraduate students had only a rudimentary understanding<br />
© 2013 National <strong>Earth</strong> Science Teachers Association. All Rights Reserved.
Page 56<br />
<strong>The</strong> <strong>Earth</strong> <strong>Scientist</strong><br />
Figure 1. <strong>The</strong> first question<br />
about the <strong>Earth</strong>’s interior<br />
from a survey for 4-12 grade<br />
students and teachers asked the<br />
participants to choose which of<br />
five illustrations they believed to<br />
be the most correct depiction of<br />
the interior of <strong>Earth</strong>.<br />
Figure 2. Student and teacher<br />
responses are shown as the<br />
percentage of respondents<br />
who picked individual answers.<br />
Students are grouped as<br />
elementary grades (4 th grade),<br />
middle grades (5 th -8 th grades) or<br />
upper grades (9 th -12 th grades).<br />
<strong>The</strong> number of respondents who<br />
selected an answer is given<br />
above each bar.<br />
of the interior of the <strong>Earth</strong>, and King (2000) noted that almost half the teachers studied struggled<br />
with the concept of scale in the <strong>Earth</strong>’s interior, particularly the size of the crust relative to the rest<br />
of <strong>Earth</strong>. <strong>The</strong>se findings suggest that popular methods of teaching the interior of the <strong>Earth</strong> do not<br />
yield even a basic understanding.<br />
In the summer of 2010, the <strong>Earth</strong> and Space Science Partnership of Penn State University provided<br />
teacher professional development workshops for middle and high school teachers. In order to gain<br />
insight into student and teacher levels of understanding, we asked 17 teachers and 361 of their students<br />
to answer survey questions about <strong>Earth</strong> science. <strong>The</strong> survey included a<br />
subset of questions from the Geoscience Concept Inventory (Libarkin<br />
& Anderson, 2005) to help us identify key concepts for targeted instruction<br />
in our summer workshop. Two questions were written specifically to<br />
probe student and teacher understanding of the <strong>Earth</strong>’s interior. <strong>The</strong> first<br />
question, “Which picture best represents the interior of the <strong>Earth</strong>”, asked the participants to choose<br />
which of five illustrations they believed to be the most correct depiction of the interior of <strong>Earth</strong> (see<br />
Figure 1). Multiple choice answer options were based on previous studies of the <strong>Earth</strong>’s interior,<br />
with option “a”, layers drawn to scale, as the normative choice. <strong>The</strong> second question, “Describe the<br />
interior of the <strong>Earth</strong> based on the picture you picked”, asked participants to describe the interior<br />
of the <strong>Earth</strong> based on the illustration they chose. <strong>The</strong> participants’<br />
answers to those questions indicate that the majority<br />
of students had only a rudimentary understanding of <strong>Earth</strong>’s<br />
interior and while teachers exhibited a greater understanding,<br />
they still struggled to make connections with other <strong>Earth</strong><br />
processes.<br />
Student Understanding<br />
Student multiple choice results (see Figure 2) show that while<br />
the percentage choosing the normative answer increases<br />
with grade, many wrong answers were also chosen by the<br />
older students. Interestingly, 4 th grade students who had<br />
not yet received instruction in school showed the smallest<br />
distribution of answers. Student written responses indicated<br />
widespread knowledge of some terms relating to the <strong>Earth</strong>’s<br />
interior, but very few students attempted to describe the<br />
interior using either physical or chemical characteristics. Two students wrote the following as their<br />
description of the interior of the <strong>Earth</strong>:<br />
“<strong>The</strong>re are different layers, each made of something different.” – 11/12th Grade<br />
“Different layers consist of different temperatures and materials or rock.” – 7th Grade<br />
While many students picked the correct image and/or identified crust, mantle, outer core, inner<br />
core, their answers to process-oriented survey questions indicated no conceptual link between the<br />
interior of the <strong>Earth</strong> and plate tectonics. For example when asked to explain how lava and magma<br />
form and where they come from one student wrote:<br />
“[Lava/magma] come from the core.” – 8th Grade<br />
Several students appealed to supernatural processes or actors. For example, in response to a question<br />
about the causes of earthquakes one student wrote:<br />
“Mother nature drops bombs anywhere she wants to.” – 11/12th Grade<br />
© 2013 National <strong>Earth</strong> Science Teachers Association. All Rights Reserved.
Volume XXIX, Issue 2<br />
Page 57<br />
We identified four common themes among the student written responses. First is a misuse of terminology,<br />
represented by students who list some or all of the appropriate terms as well as those who<br />
include lava or magma as layers in the <strong>Earth</strong>.<br />
“surface, mantle, inner mantle, core” – 5th Grade<br />
“crust, inter crust, magma, outer crust” – 8th Grade<br />
Second, we find students with incomplete conceptions about the interior of the <strong>Earth</strong>. Students in<br />
this category could list and label or describe the location of layers, or who gave blank statements<br />
about different, multiple, or many layers.<br />
“<strong>Earth</strong> has different layers” – 11/12th Grade<br />
<strong>The</strong> third theme is that of naïve conceptions where students attempt to describe the interior of the<br />
<strong>Earth</strong> by making non-normative connections to objects with which they are familiar. Some of the<br />
more common terms used, include: rock, dirt, water, sky, soil, ozone, and coal.<br />
<strong>The</strong> fourth theme is one of learned conceptions. Some students responded that they had seen<br />
pictures of the <strong>Earth</strong>’s interior that helped them choose an illustration.<br />
“[Saw] this picture on TV and in the movie 2012” – 6th Grade<br />
Student responses in this group also used terms that came from pictures they saw or examples used<br />
in attempt to help them visualize the interior of the <strong>Earth</strong>, such as references to jawbreakers and<br />
archery targets or describing the layers as different colors such as orange, red or “the yellow glowy<br />
thing” (5 th Grade).<br />
Teacher Understanding<br />
When compared to the students, the middle grade teachers exhibited a more sophisticated understanding<br />
of the interior of the <strong>Earth</strong>, both in choosing the most correct illustration, and in their<br />
written descriptions (see Figure 2). <strong>The</strong>y typically had knowledge of appropriate terms and most<br />
worked to describe the interior in terms of both physical and chemical characteristics.<br />
“A thin crust (thick outer line) underlain by a very thick mantle. <strong>The</strong>se two layers are rock. <strong>The</strong> two interior<br />
layers are iron/nickel, with the outer of the two liquid and the core layer being solid”<br />
A few teachers also indicated in their answers an understanding of processes connected with the<br />
interior of the <strong>Earth</strong>.<br />
“…Outer core – liquid material that rotates around the solid Fe inner core, generating <strong>Earth</strong>’s magnetic field<br />
and the heat convected out is driving force behind convection currents.”<br />
We identified only two of the four student themes in the written responses given by the teachers:<br />
misuse of terminology and incomplete conceptions.<br />
“<strong>The</strong>re is a hard core surrounded by magma that is surrounded by a mantle.”<br />
“<strong>The</strong> <strong>Earth</strong> [has] 3 major layers that can be divided into smaller layers based on their composition”<br />
In many cases, the teacher responses revealed confusion between layers distinguished by their<br />
composition (crust – mantle – core) and those distinguished by their thermal state (lithosphere<br />
– asthenosphere).<br />
“<strong>The</strong> inner earth has layers of crust, mantle, core. <strong>The</strong> lithosphere is a layer (not really positive about<br />
placement).”<br />
“Inner core, outer core, mantle, asthenosphere, lithosphere, crust”<br />
© 2013 National <strong>Earth</strong> Science Teachers Association. All Rights Reserved.
Page 58<br />
<strong>The</strong> <strong>Earth</strong> <strong>Scientist</strong><br />
None of the teachers referred to instructional images, proxies or visualizations. At the same time,<br />
the teachers did not provide evidence of deep understanding that would enable them to help their<br />
students work through their own alternative conceptions of <strong>Earth</strong>’s interior or to relate the planetary<br />
structure to the process of plate tectonics.<br />
About the<br />
Authors<br />
Megan Pickard is a<br />
doctoral candidate in<br />
Geosciences at <strong>The</strong><br />
Pennsylvania State<br />
University. In the fall of<br />
2013, she will be starting<br />
a faculty position in the<br />
Geology Department at<br />
Brigham Young University<br />
– Idaho. Currently,<br />
Megan can be reached at<br />
mup163@psu.edu<br />
Laura Guertin is an<br />
Associate Professor of<br />
<strong>Earth</strong> Science at Penn<br />
State Brandywine, Media,<br />
PA. Her research involves<br />
studying how new and<br />
emerging technologies<br />
impact teaching and<br />
student learning in<br />
introductory-level <strong>Earth</strong><br />
science courses at the<br />
university level. Dr.<br />
Guertin can be reached at<br />
guertin@psu.edu<br />
Tanya Furman is a<br />
Professor of Geosciences<br />
and Assistant Vice<br />
President and Associate<br />
Dean for Undergraduate<br />
Education at <strong>The</strong><br />
Pennsylvania State<br />
University, University Park,<br />
PA. Tanya can be reached<br />
at furman@psu.edu<br />
Implications<br />
<strong>The</strong> survey results indicate substantial overlap between student and teacher conceptions of the<br />
interior of the <strong>Earth</strong>. Most students and teachers can identify the correct picture of the interior of<br />
the <strong>Earth</strong> and provide some appropriate terms as labels. Overall, however, there is a lack of understanding<br />
that goes beyond the labels and that allows seeing contextualized implications of the<br />
interior of the <strong>Earth</strong> and its relationship to plate tectonics and <strong>Earth</strong> processes. Prior to attending<br />
the professional development workshop, teachers were asked to self-assess their knowledge of plate<br />
tectonics as well as their ability to teach plate tectonics. <strong>The</strong> majority of teachers reported their<br />
understanding of plate tectonics processes and features as moderate (2.96 on scale of 1-5) and<br />
felt moderately comfortable teaching the subject (2.92 on scale of 1-5). Reflecting on the answers<br />
provided by students and teachers about the interior of the <strong>Earth</strong> in this context indicates that the<br />
teaching of plate tectonics often employs only lower-order thinking skills such as memorization<br />
(e.g., name the layers of the <strong>Earth</strong>) which does not lead to an understanding of process knowledge.<br />
In a post-workshop survey these same teachers reported a higher level of both understanding (3.96)<br />
and comfort teaching plate tectonics (4.10). While acknowledging the potential challenge of interpreting<br />
data on small sample sizes (17 teachers), these results are heartening (Mundry et al. 2013).<br />
Facility with nomenclature need not be a barrier to new understanding and this study suggests that<br />
the inability to name layers would indeed not present a barrier to understanding <strong>Earth</strong> processes.<br />
Early instruction should omit memorization of layers in the interior of the <strong>Earth</strong> as it contributes<br />
little, if anything, to the understanding of the important and complex themes of <strong>Earth</strong> science.<br />
Instead, focus should be on concepts that connect geologic phenomena with students’ lives and<br />
experiences. <strong>The</strong>refore, early instruction should focus on the location and pattern of observable<br />
phenomena that lead towards a basic understanding of plate tectonics and other <strong>Earth</strong> processes.<br />
<strong>The</strong>se patterns are visual and ultimately process-rich. <strong>The</strong>se patterns are ones that young children<br />
can comprehend and that form a basic foundation on which to build more complex knowledge<br />
about the <strong>Earth</strong> processes, including the interior of the <strong>Earth</strong>.<br />
References<br />
DeLaughter J. E., Stein S., Stein C. A. & Bain K. R. (1998). Preconceptions abound among students in an<br />
introductory <strong>Earth</strong> science course. EOS Transactions American Geophysical Union, 79, 429-432.<br />
King C. (2000). <strong>The</strong> <strong>Earth</strong>’s mantle is solid: Teachers’ misconceptions about the <strong>Earth</strong> and plate tectonics.<br />
School Science Review, 82, 57-64.<br />
Libarkin, J.C. & Anderson, S.W. (2005). Assessment of Learning in Entry-Level Geoscience Courses:<br />
Results from the Geoscience Concept Inventory of Geoscience Education, 53, 394-401.<br />
Libarkin J. C., Anderson S. W., Science J. D., Beilfuss M. & Boone W. (2005). Qualitative analysis of college<br />
students’ ideas about the <strong>Earth</strong>: Interviews and open-ended questionnaires. Journal of Geoscience<br />
Education, 53, 17-26.<br />
Lillo J. (1994). An analysis of the annotated drawings of the internal structure of the <strong>Earth</strong> made by students<br />
aged 10-15 from primary and secondary schools in Spain. Teaching <strong>Earth</strong> Sciences: Journal of the <strong>Earth</strong><br />
Science Teachers Association, 19, 83-89.<br />
Mundry, S., Cremer, S., Hurley, N., Stiles, K., Mello, D., & MacDougall, P. (2013). External Evaluation Report<br />
for the <strong>Earth</strong> and Space Science Partnership: Annual Report to the National Science Foundation June<br />
2012-May 2013. Woburn, MA: WestEd.<br />
Steer D. N., Knight C. C., Owens K. D. & McConnell D. A. (2005). Challenging students’ ideas about <strong>Earth</strong>’s<br />
interior structure using a model-based, conceptual change approach in a large class setting. Journal of<br />
Geoscience Education, 53, 415-421<br />
© 2013 National <strong>Earth</strong> Science Teachers Association. All Rights Reserved.
Volume XXIX, Issue 2<br />
Page 59<br />
Subduction Zone Geometry in<br />
Three Dimensions:<br />
Using authentic data to explore relationships<br />
between earthquakes, volcanoes, and plates<br />
at convergent margins<br />
Eliza Richardson,<br />
Department of Geosciences,<br />
Pennsylvania State University<br />
Abstract<br />
<strong>The</strong> ability to visualize features of the <strong>Earth</strong> in three-dimensional space, and to conceptualize<br />
how these features change over long time scales, are crucial skills for geoscientists,<br />
but are skills that are arguably under-emphasized at the K-12 level (Kastens et al., 2010).<br />
<strong>The</strong> exercise presented here is specifically designed to build geometrical visualization skills<br />
while exposing students to authentic real-time data. This exercise was first developed and<br />
presented at the 2012 Plate Tectonics workshop at Penn State University as part of an<br />
NSF Targeted Math Science Partnership grant for Middle Grades <strong>Earth</strong> and Space Science<br />
Education (Award #DUE-0962792 & Award #GEO-0631377). All materials for teaching<br />
this activity including instructions and map templates are available for download at<br />
http://www.paesta.psu.edu/classroom/subduction-zone-geometry.<br />
Introduction<br />
K-12 students have little hope of internalizing big picture ideas about the <strong>Earth</strong> if they have an inadequate<br />
mental model of how those ideas are manifest in space and time. This exercise addresses this<br />
challenge by giving students the opportunity to construct their own graphs of spatial data using<br />
openly available authentic sources. <strong>The</strong> data in this exercise consist of earthquake and volcano<br />
locations at a variety of subduction zones around the world. At subduction zones, or convergent<br />
margins, two plates collide and one plate is forced under the other. Oceanic crust is recycled at<br />
subduction zones as it is forced into the mantle where it may descend as far down as the coremantle<br />
boundary. Subduction processes form many spectacular features of our planet including<br />
deep ocean trenches and the volcanoes that form the Pacific Ring of Fire. Convergent plate boundaries<br />
are also where the planet’s largest earthquakes and the great majority of tsunami-producing<br />
earthquakes occur. Visualizing the three-dimensional geometry of subduction zones is a logical step<br />
in the progression students make towards developing a conceptual mechanical understanding of<br />
the theory of plate tectonics.<br />
Learning Objectives<br />
<strong>The</strong> objectives of this exercise are to use authentic data to discover (1) how earthquake locations<br />
define the shape of the downgoing plate at a convergent margin and (2) how the distance between<br />
arc volcanoes and the trench allows scientists to infer the angle of subduction. Most students are<br />
© 2013 National <strong>Earth</strong> Science Teachers Association. All Rights Reserved.
Page 60<br />
<strong>The</strong> <strong>Earth</strong> <strong>Scientist</strong><br />
accustomed to seeing maps on which earthquake locations have been projected onto the <strong>Earth</strong>’s<br />
surface, but in this activity students will also explore the subduction process using graphs that<br />
allow the depth of earthquakes to be displayed. Because earthquakes occur within and along the top<br />
of the subducting plate, these earthquake locations tell scientists where the slab is located. Indeed,<br />
mapping of earthquake locations was a critical step in early research documenting the subduction<br />
process (e.g. Isacks et al., 1968). Once the locations of subduction zone arc volcanoes are added to<br />
the map, students can observe the spatial relationships between the trench, the over-riding plate<br />
and the subducting plate. This exercise demonstrates how scientists combine evidence from a<br />
variety of observations to develop a big idea and it can serve as an introduction to more in-depth<br />
lessons concerning descriptions of the mechanics of earthquakes and volcanoes. Although designed<br />
for upper middle grades, this activity can be used in upper elementary classrooms or for differentiated<br />
instruction by changing the amount and nature of the information given to the students.<br />
Figure 1. World map. Red boxes<br />
indicate portions of subduction<br />
zones used in this activity. For<br />
detailed instructions on how<br />
to extend this activity to other<br />
subduction zones besides the<br />
southern Andes example detailed<br />
in this article, go to http://www.<br />
paesta.psu.edu/classroom/<br />
subduction-zone-geometry.<br />
A third objective of this activity is to enhance students’ spatial thinking abilities. <strong>The</strong> inability of<br />
many students to think critically in the spatial realm has been identified by researchers in geoscience<br />
education (e.g. Kastens et al., 2009; Kastens, 2010) and is also the focus of more general<br />
endeavors to study human “sense-making” abilities (Lee and Bednarz, 2012 and references therein).<br />
Furthermore, the ability of students to develop an adequate mental model of complicated and<br />
dynamic <strong>Earth</strong> systems has been shown to depend on their prior knowledge of the system (Sell et<br />
al., 2006). This exercise is designed to build a simple foundation of accurate spatial thinking about<br />
subduction zones with the hope that students will be able to add to their model as their learning<br />
progresses in later years to include such complex topics as arc volcanism and mantle convection.<br />
This exercise also incorporates important <strong>Earth</strong>-science-related skills such as map reading,<br />
converting distance to map scale, and basic plot-making.<br />
<strong>The</strong> Activity<br />
<strong>The</strong> following is a detailed description of<br />
how this activity works for the Southern<br />
Andes subduction zone, but this activity<br />
can be extended as a jigsaw activity to<br />
include other subduction zones indicated<br />
on Figure 1 (details and maps for additional<br />
locations including the Lesser Antilles,<br />
Indonesia, Kuril Islands, Southern Alaska,<br />
Aleutian Islands and Fiji Islands are at<br />
http://www.paesta.psu.edu/classroom/<br />
subduction-zone-geometry).<br />
Prior to working on this exercise, students need to know that the scientists locate where earthquakes<br />
happen using the coordinates latitude, longitude, and depth. Students will also need to have some<br />
familiarity with plotting (x,y) pairs of points on a Cartesian grid. <strong>The</strong> grids on which the students<br />
make plots are given to them as part of the exercise materials, but they will plot points by hand.<br />
1. <strong>Earth</strong>quake location data<br />
<strong>The</strong> United States Geological Survey compiles a catalog of all earthquakes in the world of approximately<br />
magnitude > 4.2 and all United States earthquakes of approximately magnitude > 2. This<br />
catalog is openly available in a variety of searchable formats from this link: http://earthquake.usgs.<br />
gov/earthquakes/eqarchives/epic/<br />
© 2013 National <strong>Earth</strong> Science Teachers Association. All Rights Reserved.
Volume XXIX, Issue 2<br />
Page 61<br />
<strong>The</strong> first step in the activity is to create a small dataset from the USGS catalog by searching in<br />
a short time-window and small area centered around a subduction zone of interest. To take the<br />
Southern Andes subduction zone as a working example, appropriate parameters are for 6 months<br />
of data between latitudes 25° and 30° south and between longitudes 60° and 75° west. This search<br />
typically produces 25 - 30 earthquakes ranging in depth from 10 - 600 km. This time and area<br />
window is selected to maximize the probability that enough earthquakes of differing depths will be<br />
found, yet to produce a catalog that is not so large that the task of plotting earthquake locations<br />
by hand will be overly tedious for the students. For younger students or for classrooms without live<br />
internet access, an alternative approach is to compile the seismic catalog before class and hand out<br />
copies of the resulting text file to the students. Note that while individual subduction zones around<br />
the world tend to have fairly self-consistent rates of seismicity over time, seismic rates vary around<br />
the globe. For example, a 6-month catalog in the Southern Andes contains about the same number<br />
of earthquakes as a 2-month catalog from a similar window centered on the Fiji subduction zone.<br />
An extension of this activity for more advanced students asks them to consider some reasons for<br />
different seismicity rates at different subduction zones.<br />
Once a catalog has been created, all participants plot the earthquake locations from their dataset<br />
on two maps. <strong>The</strong>y first plot latitudes and longitudes on a traditional plan-view map in which the<br />
view is looking down on the surface of the <strong>Earth</strong> so that longitude is along the x axis and latitude<br />
is along the y axis. Secondly, they plot longitude vs. depth on a cross-section-view map, which is a<br />
planar slice perpendicular to the first map so that longitude is along the x axis and depth is along<br />
the y axis.<br />
Students are asked to examine their maps and discuss the observations that can be made regarding<br />
earthquake locations with respect to depth. Specifically, they are asked to make a claim about why<br />
the earthquakes are where they are. <strong>The</strong> following question prompts are designed to help students<br />
come up with the evidence needed to support or refute the claim they made.<br />
n<br />
n<br />
n<br />
n<br />
n<br />
n<br />
Look at your cross-section map. Describe the trend of earthquake locations with respect to<br />
longitude and depth. Describe the patterns you see.<br />
How can we infer the location of the plate boundary from this data?<br />
How can the earthquakes patterns be used to infer the kind of plate boundary at this site?<br />
What is going on at this plate boundary to cause these earthquakes?<br />
Use these observations, together with some scientific reasoning, to support your claim about<br />
why the earthquakes are where they are.<br />
By looking at the earthquake locations, how can we infer the directions that each plate is<br />
moving at this plate boundary?<br />
After the students have had time to reflect on their maps and work through their reasoning<br />
involving the mechanics of subduction as inferred from earthquake locations, it is time to introduce<br />
the second piece of corroborating data: locations of arc volcanoes.<br />
2. Volcano Location Data<br />
This part of this activity involves adding the locations of known volcanoes on the two student<br />
maps of earthquake locations. Information about <strong>Earth</strong>’s active volcanoes is openly available<br />
through the Smithsonian Institution’s Global Volcanism Program. To continue with the example<br />
of the Southern Andes subduction zone, the students are given the locations of the following five<br />
volcanoes. <strong>The</strong> exact link to the data used in this example is: http://www.volcano.si.edu/world/<br />
region.cfm?rnum=1505<br />
© 2013 National <strong>Earth</strong> Science Teachers Association. All Rights Reserved.
Page 62<br />
<strong>The</strong> <strong>Earth</strong> <strong>Scientist</strong><br />
Southern Andes Volcanoes<br />
Tipas: Latitude: 27.20°S Longitude: 68.55°W<br />
Peinado: Latitude: 26.62°S Longitude: 68.15°W<br />
Cerro el Condor: Latitude: 26.62°S Longitude: 68.35°W<br />
Unnamed: Latitude: 25.10°S Longitude: 68.27°W<br />
Aracar: Latitude: 24.25°S Longitude: 67.77°W<br />
Using a different symbol than the symbol used for the earthquake locations, students first plot the<br />
location of each of the 5 volcanoes on their plan-view map. Next, they plot the volcanoes on their<br />
cross-section-view map, using zero as the depth so that all the volcanoes are correctly located at the<br />
surface (see Figures 2 and 3 for examples of completed maps).<br />
Once the maps have been completed, students are asked to observe the relationship between the<br />
earthquakes and volcanoes and use those observations to make a claim about why the volcanoes are<br />
located where they are. <strong>The</strong> following questions prompt the students in collecting the observations<br />
necessary to support their claim:<br />
n<br />
n<br />
n<br />
n<br />
n<br />
n<br />
Where are the volcanoes in relation to the plate boundary?<br />
Where would you draw the plate boundary on your plan-view map? How far are the<br />
volcanoes from this boundary?<br />
Two plates meet at this plate boundary. On which plate are the volcanoes?<br />
What spatial pattern do the volcanoes have on the plan-view map?<br />
How deep are the earthquakes under the volcanoes?<br />
Use these observations, together with some scientific reasoning, to support your claim about<br />
why the volcanoes are where they are and what might cause them.<br />
This part of the activity may function as an introduction to the geometry of subduction zones as<br />
well as a discussion of the causes of arc volcanism. Students may observe that earthquakes directly<br />
underneath volcanoes occur at about 100 km depth (see Figure 3). This is approximately true at all<br />
subduction zones and can be a point of emphasis if students are broken into groups, where each<br />
group focuses on a different subduction zone. When the plate that makes up the deep seafloor<br />
Figure 2. Map view of the completed exercise for the southern Andes.<br />
Area shown is the same as in the box labeled “Andes” in Figure 1. <strong>The</strong><br />
South American continent is brown, and the Pacific Ocean is blue. Circles<br />
are the earthquake locations, and triangles are volcano locations. Students<br />
are given a map that looks exactly like this except that the earthquakes<br />
and volcanoes are not plotted. It is an exercise for the students to plot the<br />
longitudes and latitudes of each earthquake and volcano by marking them<br />
on this map.<br />
Figure 3. Cross-section view of the completed exercise. <strong>The</strong> solid <strong>Earth</strong><br />
is brown and the liquid ocean is a thin sliver of blue located at the top left<br />
of the cross-section. <strong>The</strong> earthquake locations approximately denote the<br />
boundary between the sinking plate and the overriding plate. Note that the<br />
earthquakes immediately below the volcanoes are at approximately 100<br />
km depth (see text for discussion). Students are given a map that looks<br />
exactly like this except that the earthquakes and volcanoes are not plotted.<br />
It is an exercise for the students to plot the longitudes and depths of each<br />
earthquake and volcano. Note that geophysical boundaries are purposely<br />
not drawn on this map because a learning objective of this exercise is that<br />
students will discover that earthquake locations allow scientists to infer<br />
the location of the plate boundary at depth in a subduction zone.<br />
© 2013 National <strong>Earth</strong> Science Teachers Association. All Rights Reserved.
Volume XXIX, Issue 2<br />
Page 63<br />
subducts, it takes some water along with it. This water is eventually forced out of the rock of the<br />
sinking plate. At about 100-km depth, the overlying mantle rock is hot enough that any water added<br />
will cause the rock to melt because water lowers the melting temperature of rock. <strong>The</strong> magma then<br />
percolates upward and feeds the arc volcanoes on the surface. Since arc volcanoes occur at the location<br />
on the upper plate that is directly above the point at which the lower plate equals 100km depth,<br />
students can sketch a right triangle on their cross-section map (Figure 3) that connects the trench,<br />
the volcano locations and the earthquakes at 100km depth on the lower plate. Students may then be<br />
prompted to consider some basic points about the geometry of subduction zones:<br />
n If the lower plate were diving less steeply, but the volcanoes are always above the 100-km<br />
depth mark, then would the volcanoes be closer to or farther from the trench?<br />
n If the lower plate were diving more steeply, would the volcanoes be closer or farther from the<br />
trench?<br />
n How could you guess how steeply the lower plate of a subduction zone is diving if you only<br />
had a plan-view map, but you didn’t have a cross-section map?<br />
<strong>The</strong> goal of this last part of the exercise is for students to reach the conclusion that the distance<br />
between the plate boundary (trench) and the arc volcanoes tells scientists the angle at which the<br />
lower plate dives beneath the upper plate. If this activity is used as a jigsaw activity with a variety<br />
of subduction zones, students will be able to compare their results and observe first-hand that the<br />
lower plates of different subduction zones dip at different angles. Another observation that may be<br />
made is that the ocean is an extremely shallow feature of our planet when compared to the overall<br />
size of our planet. At the scale of the cross-section map in Figure 3, the ocean was plotted as a 5<br />
km-deep layer, which is actually a slight exaggeration, and yet it is still so thin that it is hard to see<br />
at the top left of the map. Most of the cross-sections students see in textbooks have an imagined 3D<br />
perspective with much vertical exaggeration and a sharp delineation of all geophysical boundaries.<br />
<strong>The</strong> point of this exercise is for students to discover that the locations of earthquakes are the clues<br />
that allow scientists to draw the boundaries in the correct places.<br />
Discussion and Conclusions<br />
This activity stresses the skills of data manipulation, plotting, and visualizing locations on a map.<br />
In addition, students must infer <strong>Earth</strong> processes from remotely collected data using scientific<br />
reasoning, which is an important skill in any field of science, but particularly <strong>Earth</strong> and Space<br />
science. <strong>The</strong> goal is to provide students with the foundation of an accurate mental model regarding<br />
what manifestations of plate tectonics do happen at subduction zones, where they happen in<br />
relation to each other, and how that information gives scientists better understanding about the<br />
mechanics of convergent margins.<br />
References<br />
Isacks, B., Oliver, J and Sykes, L.R. 1968. Seismology and the new global tectonics, Journal of Geophysical<br />
Research, 73, 5855-5899.<br />
Kastens, K. A. 2010. Commentary: object and spatial visualization in geosciences, Journal of Geoscience<br />
Education, 58, 52-57.<br />
Kastens, K. A., Manduca, C.A., Cervato, C., Frodeman, R., Goodwin, C., Liben, L.S., Mogk, D.W., Spangler, T.C.,<br />
Stillings, N.A. and Titus, S. 2009. How geoscientists think and learn. Eos, 90, 265-266.<br />
Lee, J. and Bednarz, R. 2012. Components of spatial thinking: evidence from a spatial thinking ability test,<br />
Journal of Geography, 111, 15-16.<br />
Sell, K.S., Herbert, B.E., Stuessy, C.L. and Schielack, J. 2006. Supporting student conceptual model<br />
development of complex <strong>Earth</strong> systems through the use of multiple representations and inquiry, Journal<br />
of Geoscience Education, 54, 396-407.<br />
Acknowledgements<br />
This work was funded by an NSF Targeted Math Science Partnership Grant (Award #DUE-0962792 & Award<br />
#GEO-0631377)<br />
About the<br />
Author<br />
Eliza Richardson earned<br />
her bachelor’s degree in<br />
Geology and Geophysics<br />
from Princeton University<br />
and her PhD in Geophysics<br />
from MIT. She is currently<br />
an assistant professor<br />
in the Department of<br />
Geosciences and the<br />
director of the M.Ed. in<br />
<strong>Earth</strong> Sciences program<br />
at <strong>The</strong> Pennsylvania State<br />
University, University Park,<br />
PA. Her current research<br />
focus is on the spectrum<br />
of fault slip in subduction<br />
zones. Eliza can be<br />
reached at eliza@psu.edu<br />
© 2013 National <strong>Earth</strong> Science Teachers Association. All Rights Reserved.
NESTA<br />
P.O. Box 20854<br />
Boulder, CO 80308-3854<br />
PLEASE INFORM US IF YOU ARE MOVING<br />
NON PROFIT ORG.<br />
U.S. POSTAGE<br />
PAID<br />
PERMIT #718<br />
SYRACUSE NY<br />
CHANGE SERVICE REQUESTED<br />
On August 3, 2012, this image of a very severe and fast moving bow echo was taken as the storm moved down the highway from Redfield to Watertown South<br />
Dakota. Forward speed of the bow was around 60mph and winds of at least 80mph accompanied the bow in some areas, with many trees uprooted, poles<br />
snapped, grain bins destroyed and buildings moved off foundations. <strong>The</strong> photo was taken by Mike Hollingshed, using a Canon T2i, Canon 10-22 EF-s at 11mm<br />
1/40th F4. To see more of Mike’s work, go to http://www.extremeinstability.com/