The Earth Scientist
The earTh ScienTiST - NESTA
The earTh ScienTiST - NESTA

Create successful ePaper yourself
Turn your PDF publications into a flip-book with our unique Google optimized e-Paper software.
<strong>The</strong> <strong>Earth</strong> <strong>Scientist</strong><br />
Volume XXVII • Issue 1 • Spring 2011 SPECIAL EDITION $10.00*<br />
FREE INSIDE<br />
<strong>Earth</strong>quakes...Like Ripples<br />
on Water? full-color<br />
educational poster<br />
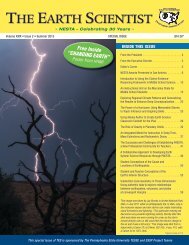
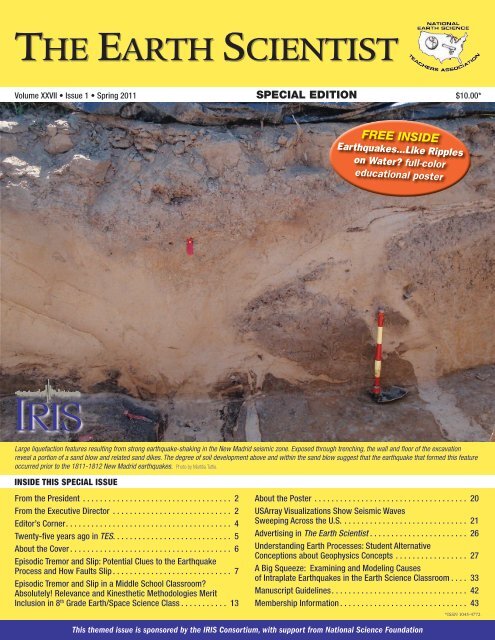
Large liquefaction features resulting from strong earthquake-shaking in the New Madrid seismic zone. Exposed through trenching, the wall and floor of the excavation<br />
reveal a portion of a sand blow and related sand dikes. <strong>The</strong> degree of soil development above and within the sand blow suggest that the earthquake that formed this feature<br />
occurred prior to the 1811-1812 New Madrid earthquakes. Photo by Martitia Tuttle.<br />
INSIDE THIS SPECIAL ISSUE<br />
From the President ................................... 2<br />
From the Executive Director ............................ 2<br />
Editor’s Corner ....................................... 4<br />
Twenty-five years ago in TES. . . . . . . . . . . . . . . . . . . . . . . . . . . . 5<br />
About the Cover ...................................... 6<br />
Episodic Tremor and Slip: Potential Clues to the <strong>Earth</strong>quake<br />
Process and How Faults Slip ............................ 7<br />
Episodic Tremor and Slip in a Middle School Classroom?<br />
Absolutely! Relevance and Kinesthetic Methodologies Merit<br />
Inclusion in 8 th Grade <strong>Earth</strong>/Space Science Class ........... 13<br />
About the Poster .................................... 20<br />
USArray Visualizations Show Seismic Waves<br />
Sweeping Across the U.S. ............................. 21<br />
Advertising in <strong>The</strong> <strong>Earth</strong> <strong>Scientist</strong> ....................... 26<br />
Understanding <strong>Earth</strong> Processes: Student Alternative<br />
Conceptions about Geophysics Concepts ................. 27<br />
A Big Squeeze: Examining and Modeling Causes<br />
of Intraplate <strong>Earth</strong>quakes in the <strong>Earth</strong> Science Classroom .... 33<br />
Manuscript Guidelines ................................ 42<br />
Membership Information .............................. 43<br />
*ISSN 1045-4772<br />
This themed issue is sponsored by the IRIS Consortium, with support from National Science Foundation
Page 2<br />
<strong>The</strong> <strong>Earth</strong> <strong>Scientist</strong><br />
NESTA’S MISSION<br />
To facilitate and advance<br />
excellence in <strong>Earth</strong> and Space<br />
Science education.<br />
NESTA Contacts<br />
EXECUTIVE BOARD<br />
President<br />
Ardis Herrold<br />
amacio@comcast.net<br />
President-Elect<br />
Missy Holzer<br />
mholzer@monmouth.com<br />
Secretary<br />
Jenelle Hopkins<br />
jhopkins@interact.ccsd.net<br />
Treasurer<br />
Howard Dimmick<br />
dimmick@esteacher.org<br />
Past-President<br />
Michael J Passow<br />
michael@earth2class.org<br />
Board of Directors<br />
Representative<br />
Parker Pennington IV<br />
parkiv@umich.edu<br />
Executive Director,<br />
Association Contact<br />
Dr. Roberta Johnson<br />
rmjohnsn@gmail.com<br />
<strong>The</strong> NESTA office is located at:<br />
4041 Hanover St., Suite 100<br />
Boulder, CO 80305<br />
PO Box 20854<br />
Boulder, CO 80308-3854<br />
Phone: 720-328-5351<br />
Fax: 720-328-5356<br />
Visit the NESTA website at<br />
http://www.nestanet.org<br />
From the President<br />
<strong>The</strong> Next Tilly<br />
by Ardis Herrold, NESTA President 2010 – 2012<br />
This issue of the <strong>Earth</strong> <strong>Scientist</strong> is being sponsored by IRIS - Incorporated Research Institutions<br />
for Seismology. We are most grateful for their excellent contributions and support. It is<br />
because of the leadership efforts and financial contributions of groups like IRIS that we are able to<br />
keep membership dues so affordable. Thank you, IRIS!<br />
As the folks at IRIS know, an earthquake gets everyone’s attention. A former student of mine had<br />
just moved to Santiago, Chile to begin a new job a few weeks before the magnitude 8.8 earthquake<br />
of February 27, 2010. Here’s an excerpt from Derek’s blog:<br />
“I woke up to a siren going off. I felt something was amiss but didn’t know what was going on.<br />
<strong>The</strong>n my bed starting shaking and I thought that was a bad sign. <strong>The</strong>n it stopped shaking and a<br />
second later the entire hotel started rumbling and shaking. It was like an airplane hitting really bad<br />
turbulence, but remove the plane and replace it with a 17 story concrete and steel building. I was<br />
so nervous that I got up and looked out the window. I wish I hadn’t… all the buildings around me<br />
(15 to 25 stories) were lit up by arcing electrical lines. In the brief flashes of light I could see all the<br />
buildings swaying like crazy, like palm trees in a hurricane. It was the craziest and scariest thing I<br />
have ever seen. I was sure they would start collapsing one by one, but they just continued to sway. I<br />
got back on the floor and rode it out there.”<br />
Natural hazard prediction and mitigation efforts are only one of the key reasons why we need to<br />
educate the public and encourage students to pursue careers in the <strong>Earth</strong> Sciences. Many of us<br />
remember the story of ten year old Tilly Smith from England, who had studied tsunamis just two<br />
weeks before visiting Phuket, Thailand on holiday in December, 2005. She recognized the signs of<br />
the approaching tsunami and because of her warning the lives of more than 100 people were spared.<br />
Just two weeks ago I had a conversation with a district administrator who expressed that <strong>Earth</strong><br />
Science can be eliminated from the high school curriculum because it is not a major content area<br />
covered on the state eleventh grade test (eventhough in reality, the test has <strong>Earth</strong> Science content<br />
parity with Biology and Physical Science). I am certain this was comment familiar to many readers<br />
of <strong>The</strong> <strong>Earth</strong> <strong>Scientist</strong>.<br />
Many of us are familiar with another quotation: “If it can’t be grown, it’s mined.” Going one step<br />
farther, it won’t grow if the soil or climate conditions are unfavorable, or if there is not enough fresh<br />
water for irrigation. Our mission as <strong>Earth</strong> science teachers is to educate our students about the<br />
entire <strong>Earth</strong> and space system, with its many intricate cycles and complex variants. Not the least of<br />
these complexities is the challenge of providing pertinent information to those in positions of policymaking.<br />
I encourage you all to persevere, if just for the sake of the next Tilly in your classroom.<br />
From the Executive Director<br />
Dear NESTA Members,<br />
NESTA has a very full schedule of events planned for the Spring NSTA National Conference in<br />
San Francisco, 9-13 March 2011. Please see our full page announcement elsewhere in the issue for<br />
details on our events at the conference. I’d like to thank the following individuals and organizations<br />
for their support for our activities at the Spring conference:<br />
© 2011 National <strong>Earth</strong> Science Teachers Association. All Rights Reserved.
Volume XXVII, Issue 1<br />
Page 3<br />
n <strong>The</strong> Incorporated Research Institutions for Seismology (IRIS), UNAVCO and SCEC for<br />
their assistance with helping to put together a wonderful set of speakers for our <strong>Earth</strong> and<br />
Space Science Resource Day Breakfast on March 12th as well as our three Advances in <strong>Earth</strong><br />
and Space Science lectures later that day.<br />
n Dr. David Schwartz of the USGS in Menlo Park for agreeing to lead our Field Trip on<br />
Wednesday, March 9, entitled “A Tour of Subsidence, Jurassic Cherts, Active Faults, and an<br />
Antiform!”<br />
n <strong>The</strong> American Geophysical Union for their continuing support of our advertisement in the<br />
NSTA program, through which we also promote the AGU Lecture, on Friday, March 11 at 2<br />
pm, by Dr. Todd Hoeksema, who will be speaking on “Our Eye on the Sun – the Latest from<br />
SDO – the Solar Dynamics Observatory”.<br />
n <strong>The</strong> American Geological Institute for their contributions in support of the Friends of <strong>Earth</strong><br />
Science Reception on Friday evening, and remind you all that the AGI Edward C. Roy, Jr.<br />
Award For Excellence in K-8 <strong>Earth</strong> Science Teaching will be awarded at this event on Friday<br />
evening – don’t miss it!<br />
n Carolina Biological, for their continuing support of NESTA for refreshments at our Rock<br />
and Mineral Raffle, as well as for consistently contributing wonderful specimens to the<br />
raffle.<br />
Without the support of these organizations and of many other volunteers, NESTA would not be<br />
able to put together such a packed program, with so many exciting events for teachers. Thanks to<br />
all of you for your efforts!<br />
Best Regards,<br />
Dr. Roberta Johnson<br />
Executive Director, NESTA<br />
Access and analyze seismic data<br />
with your students!<br />
Available<br />
Fall 2011!<br />
• Watch earthquakes as they<br />
occur through a real-time,<br />
display of seismic data!<br />
• Display your school’s seismograph<br />
if you have one!<br />
• Access/display data from<br />
seismic stations around the<br />
globe!<br />
• Analyze seismograms to<br />
calculate magnitudes, locate<br />
earthquakes, and more!<br />
• Designed for use in middle and<br />
high school classrooms!<br />
Learn more and subscribe to receive notifications when this software becomes available, and other news from IRIS’<br />
Education and Outreach by visiting http://www.iris.edu/hq/programs/education_and_outreach/software/jamaseis<br />
NESTA Contacts<br />
REGIONAL DIRECTORS<br />
Central Region - IL, IA, MN,<br />
MO, WI<br />
Yvette McCulley<br />
yvette.mcculley@iowa.gov<br />
East Central Region - IN, KY,<br />
MI, OH<br />
Jay Sinclair<br />
sinclair.jay@sbcglobal.net<br />
Eastern Region - DE, NJ, PA<br />
Michael Smith<br />
michaeljsmith99@comcast.net<br />
Far Western and Hawaii Region<br />
- CA, GU, HI, NV<br />
Wendy Van Norden<br />
wvannorden@hw.com<br />
Mid-Atlantic Region - DC, MD,<br />
VA, WV<br />
Michelle Harris<br />
michelle_harris@apsva.us<br />
New England Region - CT, ME,<br />
MA, NH, RI, VT<br />
Lisa Sarah Alter<br />
lalter@snet.net<br />
New York Region - NY<br />
Gilles Reimer<br />
greimer@hvc.rr.com<br />
North Central Region - MT, NE,<br />
ND, SD, WY<br />
Richard Jones<br />
RMJones@metnet.mt.gov<br />
Northwest Region - AK, ID, OR,<br />
WA & British Columbia<br />
Steve Carlson<br />
scarlson@pdx.edu<br />
South Central Region - AR, KS,<br />
LA, OK, TX<br />
Kurtis Koll<br />
kurtisk@cameron.edu<br />
Southeastern Region - AL, FL,<br />
GA, MS, NC, PR, SC, TN<br />
Dave Rodriguez<br />
cdrodriguez@mac.com<br />
Southwest Region - AZ, CO,<br />
NM, UT<br />
Pamela Whiffen<br />
pwpwr@aol.com<br />
Appointed Directors<br />
Tom Ervin – tomervin@mchsi.com<br />
Ron Fabich – rfabick@<br />
zoominternet.net<br />
Parker Pennington IV – parkiv@<br />
umich.edu<br />
Bruce Hall – brucehall42@gmail.<br />
com<br />
Linda Knight – lbklbk4@gmail.com<br />
Joe Monaco – monacoj@aol.com<br />
© 2011 National <strong>Earth</strong> Science Teachers Association. All Rights Reserved.
Page 4<br />
<strong>The</strong> <strong>Earth</strong> <strong>Scientist</strong><br />
NESTA<br />
Coordinators<br />
Affiliates Coordinator<br />
Ron Fabich<br />
Conference Logistics<br />
Coordinators<br />
Kim Warschaw<br />
Michelle Harris<br />
Membership Coordinator<br />
Bruce Hall<br />
Merchandise Coordinator<br />
Howard Dimmick<br />
Procedures Manual<br />
Coordinator<br />
Parker Pennington IV<br />
Rock Raffle Coordinators<br />
Parker Pennington<br />
Kimberly Warschaw<br />
Share-a-thon Coordinator<br />
Michelle Harris<br />
Volunteer Coordinator<br />
Joe Manaco<br />
E-News Editors<br />
Missy Holzer<br />
Richard Jones<br />
Editor’s Corner<br />
<strong>The</strong> Incorporated Research Institutions for Seismology (IRIS) Consortium is pleased to partner<br />
with the National <strong>Earth</strong> Science Teachers Association (NESTA) to develop this special seismology<br />
focused issue of <strong>The</strong> <strong>Earth</strong> <strong>Scientist</strong>. <strong>The</strong> theme for this issue is Modernizing Your Seismology<br />
Education. Here you will find a collection of five invited articles that showcase the complexity and<br />
wealth of new teaching opportunities that exist within seismology education.<br />
While the place of seismology education in the earth science classroom is well established as an<br />
avenue to address many Nation Science Education Standards, instruction is too frequently limited<br />
to a dated view of seismology. Common activities include a variation on the classic 1960’s-era<br />
earthquake location exercise, plotting of global seismicity on a map to define <strong>Earth</strong>’s tectonic plates,<br />
and/or the use of a nomogram to determine the Richter magnitude for a local earthquake. While<br />
these exercises are not ineffectual, they do suffer from a number of issues that makes them less<br />
than desirable. For example, seismologists have rarely used the S-P method of earthquake location<br />
since the late 1960’s, and Richter magnitudes have largely been replaced by moment magnitudes. If<br />
seismic data are included as part of these activities for student analysis, they often look hand-drawn<br />
or inauthentic, which inappropriately glosses-over the inherent complexities of the <strong>Earth</strong>’s interior.<br />
Further, these activities focus on narrow aspects of seismic data (e.g. magnitude and event location)<br />
instead of helping students conceptualize seismic phenomena within a larger plate tectonic framework<br />
or addressing some of the major misconceptions students have about <strong>Earth</strong>.<br />
To fill the gaps left by commercially available instructional resources the IRIS E&O program is<br />
committed to developing and disseminating teaching materials and teacher-ready products. Such<br />
products are designed to impact a spectrum of learners from students in grades 5 to 16, to educators<br />
and the general public. <strong>The</strong>se translate into powerful learning experiences that transpire in<br />
a variety of educational settings ranging from the excitement and awe of an interactive museum<br />
exhibit hall 1 , to a major public lecture 2 , or the dynamic classroom of a teacher that has participated<br />
in one of IRIS’s professional development workshops 3 . Several such products are featured within<br />
this Modernizing Your Seismology Education issue of <strong>The</strong> <strong>Earth</strong> <strong>Scientist</strong>. Common across all five<br />
articles and the poster insert is the connection to new research that has yet to make it into commercially<br />
available textbooks or curricula.<br />
This issue features a two article sequence that introduces the geological phenomena of Episodic<br />
Tremor and Slip, one of the greatest seismological discoveries in the past decade, and describes<br />
how this phenomenon can be conveyed to students using models and kinesthetic learning. Another<br />
article explores how the USArray, a currently deployed dense network of seismometers, and<br />
resulting data can be leveraged to generate new visualizations to enhance the conceptualization<br />
of seismic waves in the classroom. <strong>The</strong> fourth article explores the ever-growing literature base of<br />
students’ alternative conceptions of geoscience topics and suggests strategies to use this to inform<br />
your curriculum, instruction and assessment. <strong>The</strong> final article introduces both new science on<br />
intraplate seismic zones and a physical model that can be used to explore this information with<br />
students. This piece is timely as we reach the bicentennial of the 1811-1812 New Madrid earthquakes.<br />
If you are reading this you have probably already opened and examined the poster we have included<br />
for you! Like the previously mentioned article on seismic waves, this poster also uses USArray<br />
1 http://www.iris.edu/hq/programs/education_and_outreach/museum_displays<br />
2 http://www.iris.edu/hq/programs/education_and_outreach/distinguished_lectureship<br />
3 http://www.iris.edu/hq/programs/education_and_outreach/professional_development<br />
© 2011 National <strong>Earth</strong> Science Teachers Association. All Rights Reserved.
Volume XXVII, Issue 1<br />
Page 5<br />
data to create a visual analogy that is a great catalyst for student-generated questions,<br />
inquiry, and learning. Short descriptions of IRIS teacher-ready products such<br />
as Teachable Moment slide sets available the day after major earthquakes, or portals<br />
to access seismological data such as the IRIS <strong>Earth</strong>quake Browser are interspersed<br />
throughout the issue to attract your interest. We hope these, plus our collection of<br />
classroom activities, the Seismographs in Schools program, and real-time displays of<br />
global seismicity (all available via www.iris.edu) further equips you to try something<br />
new in your unit on seismology.<br />
We would love to hear from you so please don’t hesitate to contact any of the authors.<br />
Or, if you are attending the NSTA meeting, please be sure to stop to talk with us at<br />
either the IRIS booth (#607) or at one of the NESTA’s geoscience Share-A-Thons!<br />
Guest Writer of this Editor’s Corner,<br />
Michael Hubenthal<br />
IRIS Senior Education Specialist<br />
hubenth@iris.edu<br />
TES Editor, Tom Ervin<br />
Twenty-five years ago in TES<br />
Twenty-five years ago, TES was in its third year of publication. In 1986,<br />
the Volume 3, issue 1 cover featured a map of the Sudbury District on<br />
the North Shore of Lake Huron. This was followed by an article featuring<br />
the Geology of that unique district. <strong>The</strong>re was an article on Jovian and<br />
Saturnian Moons, featuring the “newest photos from Voyager 2”, and<br />
making special note of<br />
the “newly discovered<br />
volcanic plumes, spewing<br />
forth on the surface of<br />
Io”. Another article<br />
discussed Teaching<br />
<strong>Earth</strong> Science (through)<br />
Postage Stamps. First<br />
Class postage in 1986<br />
was a whopping 20 cents.<br />
Another article informed<br />
us about the current<br />
eruptions of Nevada Del<br />
Ruiz, a volcano in western Columbia. One article was devoted to a discussion<br />
of the 4,007 pieces of “space junk” in orbit around the earth. And<br />
finally, there was a review of the “Thomas Alva Edison Kits, again available<br />
for use in your <strong>Earth</strong> Science Classroom”.<br />
<strong>The</strong> <strong>Earth</strong> <strong>Scientist</strong><br />
EDITOR<br />
Tom Ervin<br />
PUBLICATIONS COMMITTEE<br />
Linda Knight, Chair<br />
Tom Ervin, TES Editor<br />
Parker Pennington IV<br />
Howard Dimmick<br />
Ardis Herrold<br />
Missy Holzer<br />
Richard Jones<br />
CONTRIBUTING AUTHORS<br />
Michael Brudzinski, Robert F. Butler,<br />
Roger Groom, Christopher D. Hedeen,<br />
Michael Hubenthal, Jenda Johnson,<br />
Julie Libarkin, Shelley Olds, Seth Stein,<br />
John Taber, Emily Geraghty Ward<br />
<strong>The</strong> <strong>Earth</strong> <strong>Scientist</strong> is the journal of the<br />
National <strong>Earth</strong> Science Teachers Association<br />
(NESTA).<br />
<strong>The</strong> <strong>Earth</strong> <strong>Scientist</strong> is published quarterly (January,<br />
March, June, September) and distributed to<br />
NESTA members. Back issues of <strong>The</strong> <strong>Earth</strong><br />
<strong>Scientist</strong> are available for sale through the NESTA<br />
Office for $10 per copy.<br />
Advertising is available in each issue of <strong>The</strong> <strong>Earth</strong><br />
<strong>Scientist</strong>. If you wish to advertise, refer to page 5 of<br />
this issue or visit http://www.nestanet.org/cms/<br />
content/publications/tes/advertising.<br />
To become a member of NESTA, turn to page 35<br />
for information or visit www.nestanet.org.<br />
To get more information about NESTA or<br />
advertising in our publications, or to get copies<br />
of back issues, contact the NESTA Office at<br />
720-328-5351 or marlene.dimarco@gmail.com<br />
Copyright © 2011 by the National <strong>Earth</strong> Science<br />
Teachers Association. All rights thereunder<br />
reserved; anything appearing in <strong>The</strong> <strong>Earth</strong> <strong>Scientist</strong><br />
may not be reprinted either wholly or in part<br />
without written permission.<br />
DISCLAIMER<br />
<strong>The</strong> information contained herein is provided as<br />
a service to our members with the understanding<br />
that National <strong>Earth</strong> Science Teachers Association<br />
(NESTA) makes no warranties, either expressed<br />
or implied, concerning the accuracy, completeness,<br />
reliability, or suitability of the information.<br />
Nor does NESTA warrant that the use of this<br />
information is free of any claims of copyright<br />
infringement. In addition, the views expressed in<br />
<strong>The</strong> <strong>Earth</strong> <strong>Scientist</strong> are those of the authors and<br />
advertisers and may not reflect NESTA policy.<br />
DESIGN/LAYOUT<br />
Patty Schuster, Page Designs<br />
Printed and bound by<br />
Scotsman Press, Syracuse, NY on<br />
recycled paper using soy ink.<br />
© 2011 National <strong>Earth</strong> Science Teachers Association. All Rights Reserved.
Page 6<br />
<strong>The</strong> <strong>Earth</strong> <strong>Scientist</strong><br />
About the Cover<br />
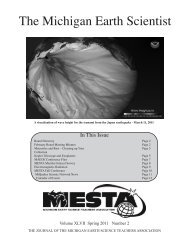
Sand blows and related sand dikes result from liquefaction of water-saturated, sandy<br />
sediment in response to ground shaking produced by earthquakes of M>5. As seismic<br />
waves pass through the sediment, pressure builds up in the water between the sand grains.<br />
If the pore-water pressure increases to the point that it equals the weight of the overlying<br />
soil, the sediment liquefies. Once liquefied, the pressurized water with entrained sand<br />
forcefully flows towards the ground surface. It intrudes pre-existing cracks or cracks and<br />
fissures that form as the overlying sediment founders into the liquefied sand or slides<br />
down slope. In cases, where the pressurized slurry of water and sand erupts to the ground<br />
surface, fountains may be observed and sand may be deposited on the surface around the<br />
vent to form a sand blow or sand volcano. Over time, soils form in the sand blows or they<br />
are buried by other deposits preserving<br />
them in the geologic record. Cultural<br />
artifacts, organic material, and sediment<br />
above and below sand blows can<br />
Sand Blow<br />
be used to estimate their ages and the<br />
earthquakes that caused them.<br />
Soil<br />
0 1 m<br />
During the 1811-1812 New Madrid<br />
earthquakes, large sand blows formed<br />
over a very large area, about 10,000<br />
Host Sediments Sand Dike (filled fissure) km 2 , and smaller sand blows formed<br />
more than 240 km from the inferred<br />
epicenters. Similar broad distributions<br />
Liquefied Sand<br />
<strong>Earth</strong>quake Waves<br />
Modified from Sims and Garvin, 1995<br />
of sand blows from other earthquakes<br />
around the world suggest that the New<br />
Madrid earthquakes were very large<br />
(M>7) in magnitude. In addition to<br />
these more recent events, hundreds of ancient sand blows, like the one shown in the cover<br />
photo, have been mapped and dated across the New Madrid region. Many formed about<br />
1450 C.E. and 900 C.E. <strong>The</strong>se are similar in size and in internal stratigraphy to sand blows<br />
that formed during the 1811-1812 New Madrid earthquakes. <strong>The</strong>ir age, size, and areal<br />
distribution suggests that the New Madrid seismic zone produced earthquakes similar<br />
to those in 1811-1812 at least twice before. <strong>The</strong> paleoearthquake record of the region is<br />
incomplete prior to 900 C.E, but there are hints of other large earthquakes about 1000 and<br />
2350 B.C.E.<br />
For more information and additional references please see: http://mptuttle.com/<br />
newmadrid1.html<br />
Sims, J.D., and Garvin, C.D., 1995, Recurrent liquefaction at Soda Lake, California, induced by the<br />
1989 Loma Prieta earthquake, and 1990 and 1991 aftershocks: Implications for paleoseismicity<br />
studies, Seismological Society of America Bulletin, v. 85, p. 51-65.<br />
Martitia Tuttle (mptuttle@earthlink.net) is a paleoseismology researcher and principle<br />
investigator of M. Tuttle and Associates, 128 Tibbetts Lane, Georgetown ME 04548.<br />
© 2011 National <strong>Earth</strong> Science Teachers Association. All Rights Reserved.
Volume XXVII, Issue 1<br />
Page 7<br />
Episodic Tremor and Slip:<br />
Potential Clues to the <strong>Earth</strong>quake<br />
Process and How Faults Slip<br />
Michael R. Brudzinski<br />
Abstract<br />
Episodic tremor and slip (ETS) represents a newly discovered mode of fault behavior<br />
occurring just below the locked zone that generates great earthquakes. Initially discovered<br />
in subduction zones, this new slip mechanism can release energy equivalent to at<br />
least a magnitude 7 earthquake! While this is a tremendous energy release, no one ever<br />
feels these events because they occur as slow slip episodes lasting weeks or months. As<br />
the plates move, high-precision Global Positioning System (GPS) monuments record the<br />
magnitude and direction of motion while seismometers record the low amplitude seismic<br />
waves released. <strong>The</strong> importance of this discovery lies in its potential relationship to the<br />
part of faults that generate destructive earthquakes. Considering that ETS occurs immediately<br />
below to the locked zone of faults, it may be possible for energy released in slow<br />
slip episodes to concentrate stresses at the deep edge of the locked zone, incrementally<br />
bringing it closer to failure. Thus ETS episodes might be a trigger for great earthquakes or<br />
aid in monitoring the stress state of faults as they lead up to the big one.<br />
Introduction<br />
<strong>The</strong> growing awareness of societal problems caused by natural hazards has piqued the interest of<br />
many students who enter our classes. As <strong>Earth</strong> science educators it should be our goal to convert<br />
that interest into problem solving skills. <strong>The</strong>re is possibly no better example than that for earthquakes,<br />
where the threat is ever present, but there are many unanswered questions about how and<br />
why earthquakes happen. All of these questions will require well-trained and creatively thinking<br />
students to help push the research to new discoveries as well as an educated citizenry to apply the<br />
science to hazard preparedness and mitigation. A recent discovery that has captured the attention<br />
of many geoscientists over the past decade is the observation of a new type of deformation<br />
occurring on the large faults between tectonic plates that is different from typical earthquakes. To<br />
© 2011 National <strong>Earth</strong> Science Teachers Association. All Rights Reserved.
Page 8<br />
<strong>The</strong> <strong>Earth</strong> <strong>Scientist</strong><br />
understand the importance of this new discovery and how it might inspire our students, we must<br />
first review the typical earthquake cycle.<br />
As oceanic plates subduct into the mantle, friction on the interface with the overriding plate causes<br />
the plates to “lock” together along the megathrust zone (Figure 1, thick solid line). Here the upper<br />
plate is pulled down by the lower plate, building up elastic strain in the rocks along the fault, until<br />
the strain is relieved when the upper plate pops back up during a potentially devastating earthquake.<br />
<strong>The</strong> rapid fault motion in great (magnitude 8+) earthquakes can result in intense ground<br />
shaking and the displacement of ocean water that generates tsunamis, with the 2004 Sumatra great<br />
earthquake and tsunami serving as a particularly harrowing example. While much of the energy<br />
stored in subduction zones is released in these great megathrust earthquakes, recent GPS observations<br />
have revealed that the built-up elastic strain in subduction zones can be released through a<br />
process that is much less dramatic than an typical earthquake.<br />
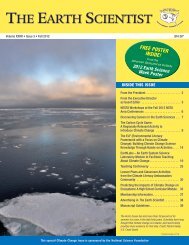
Figure 1. Cross-section slice<br />
through a subduction zone<br />
illustrating how fault behavior,<br />
along the plate interface,<br />
changes with depth. At shallow<br />
depths, the subducting (green)<br />
plate drags the upper (brown)<br />
plate down as the fault between<br />
them is locked together along<br />
the megathrust (thick solid line).<br />
<strong>The</strong> rocks on either side of the<br />
fault bend to accommodate<br />
this elastic strain until the fault<br />
unlocks catastrophically in a<br />
great earthquakes. At depths<br />
below ~30 km, we find evidence<br />
of a more gradual release of<br />
elastic strain through episodic<br />
tremor and slip (ETS, dashed<br />
line). This is a newly discover<br />
type of fault behavior which<br />
appears to be promoted by<br />
high pore fluid pressure from<br />
subducting plate dehydration<br />
(blue shading). ETS is important<br />
as it frequently releases elastic<br />
stain energy equivalent to<br />
a magnitude 7 earthquake,<br />
which is thought to concentrate<br />
stresses (red shading) at the<br />
deep edge of the locked zone. At<br />
greater depths, the increasing<br />
pressures and temperatures<br />
prevent earthquakes and ETS<br />
and result in continuous creep<br />
along the plate interface (dotted<br />
line). <strong>The</strong> crust/mantle boundary<br />
has limited impact on the fault<br />
behavior and has been omitted<br />
from this figure to focus attention<br />
on the interface between the<br />
plates. This figure is vertically<br />
exaggerated by a factor of 2.<br />
New Fault Behavior Discovered in Subduction Zones<br />
To make these observations, high-precision GPS monuments were monitored continuously for<br />
motions over time as small as a millimeter per year. Careful analysis of the relative positions of<br />
instruments near the edge of the plate relative to those in the interior found that some instruments<br />
occasionally moved back toward the trench, instead of towards North America as would be<br />
expected along the convergence boundary in the Pacific Northwest. <strong>The</strong> magnitude and direction<br />
of this motion was similar to what might be expected during the several seconds of a magnitude<br />
7 earthquake. However, this motion occurred much more gradually over the span of several weeks<br />
and in some cases over a year (e.g., Rogers & Dragert, 2003). This gradual release of the built-up<br />
elastic strain is now referred to as slow slip episodes. Curiously, the largest transient motions were<br />
not recorded at the coast above the locked zone (Figure 1, box A) but further inland (Figure 1, box<br />
B), suggesting slow slip occurs on the plate interface deeper than the region where great earthquakes<br />
are expected (Figure 1, dashed line). Discovering “hidden” slip on the fault equivalent to<br />
a magnitude 7 earthquake just below the zone of great earthquakes is cause for both excitement<br />
and concern. Further investigation revealed that the slow slip is episodic, sometimes with remarkably<br />
consistent frequency, such as the ~14 month recurrence interval seen between Seattle and<br />
Vancouver (Figure 2, box B) (e.g., Rogers & Dragert, 2003). This gives geophysicists the unprecedented<br />
luxury of being able to prepare for each event in advance and then watch closely for the<br />
start of each episode as the data streams in. This periodicity is not as consistent in other locations<br />
(Brudzinski & Allen, 2007), but most cases are more regular than typical earthquakes, suggesting<br />
that the frictional conditions on this portion of the fault cause it to be more predictable than where<br />
earthquakes occur.<br />
Depth (km)<br />
0<br />
50<br />
Trench<br />
Subducting Oceanic Plate<br />
Locked<br />
Increased<br />
Stress<br />
ETS<br />
High Fluid<br />
Pressure<br />
North American Plate<br />
Creep<br />
-200 0 200<br />
Distance from Coast (km)<br />
Mt. St. Helens<br />
© 2011 National <strong>Earth</strong> Science Teachers Association. All Rights Reserved.
Volume XXVII, Issue 1<br />
Page 9<br />
In addition to being recorded by GPS, slow slip typically corresponds to low-level seismic vibrations<br />
referred to as non-volcanic tremor (Figure 2, box B) that can be detected by seismometers. <strong>The</strong><br />
term non-volcanic tremor was applied to these weak signals as they are emergent, meaning they<br />
are not impulsive like a single large earthquake (Figure 2, box A), but gradually appear out of the<br />
background noise and often undulate with slowly varying amplitudes (e.g., Obara, 2002) (Figure<br />
1s). Volcanoes generate a similar, but larger and more obvious tremor that has been recognized for<br />
many years (Figure 2, box D). Non-volcanic tremor in subduction zones is different because it has<br />
a deep source region (Figure 1, dashed line), and it is not harmonic (cf., Figure 2, boxes B and D,<br />
bottom panel). <strong>The</strong> harmonic nature of volcanic tremor is thought to be caused by fluid moving<br />
through magma conduits, similar to the way air resonates in an organ pipe.<br />
Depth (km)<br />
0<br />
50<br />
Locked<br />
A B C D<br />
ETS<br />
North American Plate<br />
Creep<br />
-200 0 200<br />
Distance from Coast (km)<br />
GPS<br />
Displacement (cm)<br />
A Locked Megathrust B Episodic Tremor C Aseismic D<br />
<strong>Earth</strong>quake<br />
and Slip<br />
Creep<br />
500<br />
0<br />
0<br />
1600 2000<br />
Time (y)<br />
5<br />
2004 2006<br />
5<br />
0<br />
2004 2006<br />
5<br />
0<br />
Volcanic<br />
Tremor<br />
2004 2006<br />
Seismic<br />
Vibration (nm)<br />
200000<br />
0<br />
200<br />
0 3600<br />
Time (s)<br />
0<br />
100<br />
0 3600<br />
0<br />
7000<br />
0 3600<br />
0<br />
0 3600<br />
Seismic<br />
Vibration (nm)<br />
200000<br />
0<br />
0 10<br />
Time (s)<br />
200<br />
0<br />
0 10<br />
100<br />
0<br />
0 10<br />
7000<br />
0<br />
0 10<br />
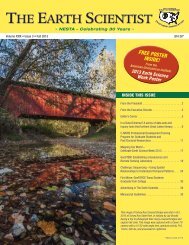
Figure 2. Example GPS data (middle panel) and seismic data (lower panels) recorded at different locations across a<br />
subduction zone. (top panel) Cross-section through a subduction zone illustrating 3 types of fault behavior: locked<br />
(solid), episodic tremor and slip (ETS, dashed), and creep (dotted). Boxes A through D show locations of seismic and<br />
GPS instruments above each of these 3 zones of the plate interface and one near a volcano (triangle) further inland.<br />
This cross-section is similar to Figure 1 but with no vertical exaggeration. [A] Instruments above the locked zone<br />
record linear trends in GPS data that indicate accumulation of elastic strain energy for hundreds of years. Eventually,<br />
a great earthquake occurs, causing several meters of displacement in just a few minutes with very strong seismic<br />
shaking. [B] Instruments above the ETS zone record episodes of slow slip with only millimeters of GPS displacement<br />
that last a few weeks to months and often recur every year or two. <strong>The</strong>se episodes are typically accompanied by nonvolcanic<br />
tremor that are small seismic vibrations that gradually emerge out of the background noise. [C] Instruments<br />
above the creep zone record very little change in GPS displacement over time with very small and constant seismic<br />
vibrations that are likely due to cultural or atmospheric noise. [D] Instruments near a volcano that are far from the<br />
plate boundary often see little change in displacement between eruptions, but they record periods of volcanic tremor.<br />
<strong>The</strong> bottom panel shows a short time scale to illustrate how volcanic tremor has repetitive, uniform pulse widths, while<br />
non-volcanic tremor has more irregular pulse widths, a key difference that led to the discovery of ETS. This harmonic<br />
nature of volcanic tremor is thought to be caused by fluid moving through conduits, similar to how air resonates an<br />
organ pipe. Non-volcanic tremor is not harmonic as it is thought to be caused by a swarm of small, low-frequency<br />
earthquakes with overlapping P and S waves.<br />
© 2011 National <strong>Earth</strong> Science Teachers Association. All Rights Reserved.
Page 10<br />
<strong>The</strong> <strong>Earth</strong> <strong>Scientist</strong><br />
Based on an analysis of non-volcanic tremor, it appears to be composed of swarms of so-called low<br />
frequency earthquakes, since typical earthquakes of similar magnitude would have more energy<br />
at higher frequencies. <strong>The</strong> swarm of seismic sources results in many overlapping signals on a seismogram<br />
(Figure 2, box B), making it difficult to discern individual P and S waves typically used<br />
to estimate key details about the earthquake source. Nevertheless, detailed processing techniques<br />
have been able to identify repeating P and S wave signals that indicate the depth and fault motion<br />
are consistent with the majority of non-volcanic tremor produced by shear faulting along the<br />
plate interface (Ide, Shelly, & Beroza, 2007). <strong>The</strong>se motions are consistent with slow slip motions<br />
that regularly relieve the built-up elastic strain along the fault and relax the deep crust. However,<br />
the summed magnitude of slip from non-volcanic tremor is still considerably less than that from<br />
geodetically recorded slow slip, such that the combination is still mostly an aseismic slip process.<br />
Part of the reason non-volcanic tremor remained undiscovered through seismic analysis until<br />
the last decade was that its signal is close to wind or cultural noise (Figure 2, box C), and when<br />
combined with its weak and undulating nature, it typically looks like slightly more than normal<br />
background noise on an individual seismogram. <strong>The</strong> key indicator that it is indeed generated by<br />
a tectonic source is that the signals correlate at several stations over distances of up to 100 km,<br />
whereas cultural noise is different at every station. <strong>The</strong> situation is analogous to other discoveries<br />
in geology, where key features in rocks remain unnoticed for a many years until someone goes<br />
looking for a specific feature. What helped draw the attention of many geophysicists is the remarkable<br />
correlation in space and time between the geodetic signatures of slow slip and the seismic<br />
signals of non-volcanic tremor (e.g., Rogers & Dragert, 2003) (Figure 2, box B).<br />
Physical Causes for Slow Slip Behavior<br />
Episodic tremor and slip (ETS) is exciting to scientists because it occurs at the deep edge of great<br />
earthquakes where rupture often begins, indicating that ETS could help explain why great earthquakes<br />
are restricted to certain parts of the plate interface. As mentioned earlier, these great<br />
earthquakes are thought to result from frictional behavior on the fault between the plates. In order<br />
to understand why slow slip occurs we need to examine the physics of faulting in detail. Under the<br />
right conditions, which are typically met at shallow depths in the <strong>Earth</strong>’s crust (Figure 1, thick solid<br />
line), the friction on the fault while stationary is larger than the friction on the fault once the fault<br />
is moving. As a result, an instability is formed once a fault begins to rupture, and the rupture is able<br />
to continue quickly causing an earthquake until something stops it, such as a bend in the fault. As<br />
pressures increase with depth in the <strong>Earth</strong>, a region is reached where there is no longer a decrease<br />
in friction after the fault starts to slip (Figure 1, dotted line). At these depths, this lack of decreased<br />
friction when the fault is in motion prevents fault slip from becoming an earthquake. As a result,<br />
the fault creeps along at a stable rate.<br />
In between the locked and creeping regions (Figure 1, dashed line), theory predicts the possibility<br />
that slow slip rupture can be initiated due to the presence of high fluid pressures that “lighten the<br />
load” of the overriding plate thereby reducing the friction (e.g., Liu & Rice, 2007). We believe this<br />
is occurring as the subducting oceanic plate loses its water on its descent into the <strong>Earth</strong>, and a seal<br />
above the plate interface could cause fluids to build up along the fault (Figure 1, blue shading).<br />
Seismic waves traveling through the source region of ETS show unusually slow speeds and elastic<br />
properties consistent with fluid overpressuring (e.g., Audet, Bostock, Christensen, & Peacock, 2009).<br />
Further evidence for this comes from another set of observations showing that ETS can be dynamically<br />
triggered by tidal forces (e.g., Rubinstein, La Rocca, Vidale, Creager, & Wech, 2008) or passing<br />
surface waves from a large earthquake (e.g., Rubinstein et al., 2007). Since normal earthquakes on<br />
strong faults are rarely triggered by tides and surface waves, such response to smaller stresses indicates<br />
the fault is weaker. Fluid overpressuring is a worthy candidate for weakening or drastically<br />
© 2011 National <strong>Earth</strong> Science Teachers Association. All Rights Reserved.
Volume XXVII, Issue 1<br />
Page 11<br />
reducing friction on the fault (e.g., Thomas,<br />
Nadeau, & Burgmann, 2009).<br />
Why is ETS an Important<br />
Discovery?<br />
<strong>The</strong> importance of ETS to the general public<br />
lies in its potential relationship to great<br />
earthquakes. Considering that ETS occurs<br />
near the deepest extent of where earthquakes<br />
rupture (Figure 1, dashed vs. solid line),<br />
one can simply use the location of ETS to<br />
estimate how far inland future great earthquake<br />
ruptures will extend (Chapman &<br />
Melbourne, 2009). In the Pacific Northwest<br />
(Figure 3), the spatial extent of the last great<br />
earthquake in 1700 is not well determined,<br />
making hazard estimates more difficult.<br />
Here, ETS occurs further inland than<br />
previous estimates of the extent of the great<br />
earthquake rupture. This suggests strong<br />
ground shaking could extend further inland<br />
towards cities like Seattle, Portland and<br />
Vancouver, and there are active discussions<br />
about how to incorporate this information<br />
into seismic hazard assessment.<br />
-128˚ -126˚ -124˚ -122˚<br />
50˚<br />
48˚<br />
46˚<br />
44˚<br />
42˚<br />
Subducting Oceanic Plate<br />
Locked<br />
North American Plate<br />
Vancouver<br />
ETS<br />
Seattle<br />
A B C D<br />
Portland<br />
Figure 3. Map of the Pacific<br />
Northwest showing regions<br />
affected by the fault interface<br />
between the subducting oceanic<br />
plate and the overriding North<br />
American plate. Since the last<br />
great earthquake occurred in<br />
1700, scientists have tried to<br />
estimates of where the fault is<br />
locked (solid curve) to predict<br />
where the next great earthquake<br />
will occur. <strong>The</strong> region of the fault<br />
producing episodic tremor and<br />
slip (ETS, dashed curve) occurs<br />
slightly inland of these estimates<br />
of where the earthquake will<br />
occur. If the locked zone actually<br />
extends all the way up to the<br />
edge of the ETS zone, the next<br />
great earthquake will bring<br />
seismic shaking further inland<br />
and closer to Seattle, Portland,<br />
and Vancouver (yellow circles).<br />
Cascades volcanoes are shown<br />
as triangles. <strong>The</strong> white line<br />
indicates the location of the<br />
cross section shown in Figures<br />
1 and 2. Boxes A-D indicate<br />
locations of seismic and GPS<br />
instruments for which data is<br />
shown in Figure 2.<br />
<strong>The</strong> proximity of ETS to the zone of great<br />
earthquakes indicates that stress release in<br />
slow slip episodes could concentrate stresses<br />
40˚<br />
at the deep edge of the locked zone (Figure 1,<br />
red ellipse), incrementally bringing it closer<br />
to failure (Dragert, Wang, & Rogers, 2004).<br />
If true, ETS could be thought of as “tickling the dragon’s belly” such that great earthquakes would<br />
be more likely during or just after an ETS event. Regardless of whether ETS has a causative relationship<br />
with great earthquakes, ETS may still be useful in monitoring the stress state of faults as<br />
they lead up to the big one. Changes in the location, recurrence, or migration of ETS phenomena<br />
could all serve as indicators of the increasing likelihood of earthquake rupture. Unfortunately, the<br />
closely spaced instrumentation necessary to fully test hypotheses regarding ETS and the earthquake<br />
cycle has not yet existed in areas where the handful of great earthquakes have occurred over the past<br />
decade. While no one hopes for a great earthquake, scientists continue to prepare to catch the next<br />
big one with a better distribution of higher quality instrumentation.<br />
ETS on Other Fault Types<br />
Although the majority of this article has focused on ETS behavior in subduction zones (e.g.,<br />
Cascadia, Japan, Mexico, Alaska, Costa Rica), there are indications that ETS, or aspects of it, occur<br />
on other faults as well. A series of slow slip episodes have been recorded on the south flank of<br />
Kilauea (e.g., Montgomery-Brown, Segall, & Miklius, 2009), where the weight of erupted rock is<br />
causing it to slough away along nearly horizontal faults. In this case, slow slip episodes are not<br />
accompanied by non-volcanic tremor but they are accompanied by a swarm of regular earthquakes.<br />
© 2011 National <strong>Earth</strong> Science Teachers Association. All Rights Reserved.
Page 12<br />
<strong>The</strong> <strong>Earth</strong> <strong>Scientist</strong><br />
About the<br />
Author<br />
Michael Brudzinski<br />
(brudzimr@<br />
muohio.edu) is an<br />
Associate Professor<br />
of Geophysics in<br />
the Department of<br />
Geology at Miami<br />
University, Oxford, OH<br />
45056.<br />
<strong>The</strong> San Andreas Fault has also shown evidence for slow slip (Linde, Gladwin, Johnston, Gwyther,<br />
& Bilham, 1996) and non-volcanic tremor (Nadeau & Dolenc, 2005), but they have not yet been<br />
recorded in the same part of the fault. <strong>The</strong> tremor observations, though, are particularly intriguing<br />
since a magnitude 6 earthquake occurred in the region where tremor was discovered, and there have<br />
been clear indications of changes in tremor patterns leading up to and following the earthquake<br />
(e.g., Nadeau & Guilhem, 2009).<br />
Episodic slow slip and non-volcanic tremor appear to occur in a range of environments and understanding<br />
this newly discovered phenomena is helping us decipher the physics of earthquakes.<br />
While we are in no position to use ETS to predict earthquakes, such observations give hope to the<br />
prospects of using ETS to better understand when and where earthquakes will occur. And considering<br />
the sobering history of failed prospects in earthquake prediction (e.g., Hough, 2009), any hope<br />
is good news.<br />
References<br />
Audet, P., Bostock, M. G., Christensen, N. I., & Peacock, S. M. (2009). Seismic evidence for overpressured<br />
subducted oceanic crust and megathrust fault sealing. Nature, 457(7225), 76-78.<br />
Brudzinski, M. R., & Allen, R. M. (2007). Segmentation in episodic tremor and slip all along cascadia. Geology,<br />
35(10), 907-910.<br />
Chapman, J. S., & Melbourne, T. I. (2009). Future cascadia megathrust rupture delineated by episodic tremor<br />
and slip. Geophysical Research Letters, 36 doi:10.1029/2009GL040465 ER<br />
Dragert, H., Wang, K., & Rogers, G. (2004). Geodetic and seismic signatures of episodic tremor and slip in the<br />
northern cascadia subduction zone. <strong>Earth</strong> Planets and Space, 56(12), 1143-1150.<br />
Hough, S. E. (2009). Predicting the unpredictable: <strong>The</strong> tumultuous science of earthquake prediction Princeton University<br />
Press.<br />
Ide, S., Shelly, D. R., & Beroza, G. C. (2007). Mechanism of deep low frequency earthquakes: Further evidence<br />
that deep non-volcanic tremor is generated by shear slip on the plate interface. Geophysical Research Letters,<br />
34(3), 5. doi:L03308 10.1029/2006gl028890<br />
Linde, A. T., Gladwin, M. T., Johnston, M. J. S., Gwyther, R. L., & Bilham, R. G. (1996). A slow earthquake<br />
sequence on the san andreas fault. Nature, 383, 65-68.<br />
Liu, Y. J., & Rice, J. R. (2007). Spontaneous and triggered aseismic deformation transients in a subduction fault<br />
model. Journal of Geophysical Research-Solid <strong>Earth</strong>, 112(B9), 23. doi:B09404 10.1029/2007jb004930<br />
Montgomery-Brown, E. K., Segall, P., & Miklius, A. (2009). Kilauea slow slip events: Identification,<br />
source inversions, and relation to seismicity. Journal of Geophysical Research-Solid <strong>Earth</strong>, 114<br />
doi:10.1029/2008JB006074 ER<br />
Nadeau, R. M., & Dolenc, D. (2005). Nonvolcanic tremors deep beneath the san andreas fault. Science, 307, 389.<br />
Nadeau, R. M., & Guilhem, A. (2009). Nonvolcanic tremor evolution and the san simeon and parkfield,<br />
california, earthquakes. Science, 325(5937), 191-193. doi:10.1126/science.1174155<br />
Obara, K. (2002). Nonvolcanic deep tremor associated with subduction in southwest japan. Science, 296(5573),<br />
1679-1681.<br />
Rogers, G., & Dragert, H. (2003). Episodic tremor and slip on the cascadia subduction zone: <strong>The</strong> chatter of<br />
silent slip. Science, 300(5627), 1942-1943.<br />
Rubinstein, J. L., La Rocca, M., Vidale, J. E., Creager, K. C., & Wech, A. G. (2008). Tidal modulation of<br />
nonvolcanic tremor. Science, 319(5860), 186-189.<br />
Rubinstein, J. L., Vidale, J. E., Gomberg, J., Bodin, P., Creager, K. C., & Malone, S. D. (2007). Non-volcanic<br />
tremor driven by large transient shear stresses. Nature, 448(7153), 579-582. doi:10.1038/nature06017<br />
Thomas, A. M., Nadeau, R. M., & Burgmann, R. (2009). Tremor-tide correlations and near-lithostatic pore<br />
pressure on the deep san andreas fault. Nature, 462(7276), 1048-U105. doi:10.1038/nature08654 ER<br />
© 2011 National <strong>Earth</strong> Science Teachers Association. All Rights Reserved.
Volume XXVII, Issue 1<br />
Page 13<br />
Episodic Tremor and Slip<br />
in a Middle School Classroom?<br />
Absolutely!<br />
Relevance and Kinesthetic Methodologies Merit<br />
Inclusion in 8 th Grade <strong>Earth</strong>/Space Science Class<br />
Roger Groom, Shelley Olds, Robert F. Butler and Jenda Johnson<br />
Photo by Steve Smith<br />
Abstract<br />
Episodic Tremor and Slip is a valuable tool in <strong>Earth</strong> Science classrooms to teach about new<br />
understandings of subduction zones. <strong>The</strong> relation of these boundary systems to natural<br />
hazards is real and relevant as witnessed in Sumatra and Chile. Through a suite of three<br />
lessons students learn about high-precision Global Positioning System (GPS) technology,<br />
how to interpret GPS data time series plots, and determine the general motion trend of a<br />
tectonic plate. Building on their understanding of GPS, students are prepared to discover<br />
the evidence of episodic tremor and slip events and appreciate the significance of these<br />
phenomena in forecasting megathrust earthquakes and tsunamis.<br />
Relevance of Episodic Tremor and Slip<br />
<strong>The</strong> relatively recent discovery of Episodic Tremor and Slip (ETS) in the Cascadia Subduction<br />
Zone (CSZ), which has a geologic configuration similar to Sumatra and Chile, has highlighted<br />
the potentially devastating earthquake potential in the Pacific Northwest. Until recently, motion<br />
on subduction zone faults was assumed to be constant in direction and speed between major<br />
earthquakes. However, in the Pacific Northwest the local ground motions measured by Global Positioning<br />
System (GPS) technology, revealed a current trend of motion to the northeast, indicating<br />
that the North America plate and the subducting Juan de Fuca plate are locked along their plate<br />
margins. Furthermore, an unexpected finding over the past decade revealed periods of slow ground<br />
motion back to the southwest. Since then, these slow slip events, known as ETS, have been correlated<br />
with seismic tremors lasting over a one or two week period. ETS events occur so slowly that<br />
only sensitive instruments can detect their occurrence. ETS events are of great interest because over<br />
time they may add potential energy to the locked section of the subduction zone, incrementally<br />
bringing it closer to failure. Eventually, this energy will be released as a tremendous megathrust<br />
earthquake affecting the Pacific Northwest region, including Portland and Seattle, and creating<br />
tsunamis that will inundate the Pacific Northwest coastline. For a more in-depth description of ETS<br />
behavior and causes, see pages 7-12 in this issue.<br />
© 2011 National <strong>Earth</strong> Science Teachers Association. All Rights Reserved.
Page 14<br />
<strong>The</strong> <strong>Earth</strong> <strong>Scientist</strong><br />
This recent discovery of a new fault behavior, and its relationship<br />
to potentially devastating megathrust earthquakes,<br />
provides a powerful teaching opportunity for middle school<br />
<strong>Earth</strong> Science students, especially those who live in the Pacific<br />
Northwest. Through the study of the intriguing mechanism<br />
of ETS, students gain a deeper understanding of convergent<br />
boundaries and are exposed to new technologies that are<br />
extending our knowledge of these boundary systems. Such<br />
instruction also increases the awareness of potential hazards<br />
associated with subduction zone earthquakes and tsunamis,<br />
thereby helping to raise public awareness of these hazards<br />
within the United States. As evidenced by Hurricane Katrina<br />
in 2005, the impact of natural disasters is not limited to the<br />
region directly affected by the event. <strong>The</strong> lessons and built-in<br />
kinesthetic modeling activities described in this article provide<br />
students with the tools to comprehend the processes involved,<br />
especially because they may be happening right under their feet.<br />
Figure 1. Regional map of the<br />
Pacific Northwest showing<br />
the relative positions of the<br />
subducting Juan De Fuca<br />
plate and the overriding North<br />
American plate.<br />
Teaching Sequence<br />
Originally developed in 2006 during a UNAVCO Master Teacher in Residence program, the<br />
Cascadia and Episodic Tremor and Slip learning activities have been collaboratively refined, field<br />
tested with students, and presented to <strong>Earth</strong> Science teachers during multiple workshops, including<br />
the Teachers on the Leading Edge program (2008-2010). Students learn about Episodic Tremor and<br />
Slip by analyzing authentic high-precision GPS data. <strong>The</strong>re are many benefits of using GPS data to<br />
teach Episodic Tremor and Slip:<br />
l<br />
l<br />
l<br />
l<br />
l<br />
GPS is cutting-edge technology that is familiar to students and has broad applicability in<br />
the geosiences.<br />
Using real-time, freely accessible, GPS data builds interest and awareness,<br />
Analyzing GPS data supports math (particularly graphing skills), technology, geography,<br />
earth science, and process of science standards.<br />
GPS data can be presented as a class demonstration or via interactive whiteboards, printed<br />
for student classroom use, or accessed in a computer lab.<br />
Can be differentiated to address a diversity of learners.<br />
To provide students with the tools to understand GPS data and comprehend the big picture of ETS<br />
and its importance, we present the following three activities:<br />
1) Gumdrop Introduction to GPS;<br />
2) “Locked and Loading” to explore regional deformation and to practice the process of potential<br />
and kinetic energy; and<br />
3) Episodic Tremor and Slip – the Case of the Mystery <strong>Earth</strong>quakes.<br />
As presented, the sequence takes 8-10, 50-minute periods. However, the sequence can also be shortened<br />
or lengthened to fit your own teaching situation. Prior to the teaching sequence, students<br />
should know the basics of plate tectonics. A complete description of the suite of three activities<br />
including modifications and extensions is available online through ETS in the Pacific Northwest<br />
(Groom, 2011).<br />
© 2011 National <strong>Earth</strong> Science Teachers Association. All Rights Reserved.
Volume XXVII, Issue 1<br />
Page 15<br />
Gumdrop Introduction to GPS<br />
Time<br />
2 – 3, 50-minute periods depending on student comfort level with interpreting graphs.<br />
<strong>The</strong> teaching sequence begins with an explanation of how GPS works and how the motion of GPS<br />
stations, permanently attached to the ground, can be measured on the scale of millimeters per years.<br />
Students interpret GPS data time series plots to determine the motion of different GPS stations.<br />
Lesson Objectives<br />
n Build and use a model of a GPS monument<br />
n<br />
n<br />
n<br />
n<br />
Understand the power of high-precision GPS to monitor movement of <strong>Earth</strong>’s surface<br />
Learn to read and interpret GPS time series plots<br />
Graph the direction and speed of a GPS station’s motion<br />
Visualize deformation of the North American continental margin due to subduction of the<br />
Juan de Fuca plate<br />
Students first build ‘gumdrop’ GPS<br />
receivers (Figure 2) to use in a hands-on,<br />
follow-along exercise to learn to pinpoint<br />
a location on the <strong>Earth</strong>’s surface using<br />
multiple satellites. Students are then<br />
introduced to GPS time series graphs and<br />
use these graphs to interpret the data<br />
from three GPS stations along a west to<br />
east transect across Washington. Two<br />
short video tutorials illustrating this<br />
are available online at the Incorporated<br />
Research Institutions for Seismology<br />
(IRIS) website (IRIS, n.d.). Students move<br />
their gumdrop models along the mapped data to simulate the motion of the GPS station and the<br />
earth beneath it over time; a process that helps kinesthetic learners translate graphed data to movement.<br />
Finally, by looking at the transect stations, students graph and model the deformation of the<br />
western margin of the North American plate. Along this single transect, movement is largely to the<br />
northeast due to the subducting Juan de Fuca plate. Students notice that the far western edge of<br />
the North American plate has greater northeast movement compared to the urban corridor, while<br />
further inland (central WA and OR) isn’t moving northeast. <strong>The</strong> next question to address is whether<br />
the entire Pacific Northwest margin is behaving similarly.<br />
Figure 2. Classroom set of<br />
student-made gumdrop GPS<br />
monuments<br />
Locked and Loading<br />
Time<br />
1 ½ - 2 periods<br />
In this activity, students analyze multiple west-to-east transects of GPS data through Washington<br />
and Oregon to attain a regional view of how the North America plate is “locked and loading” along<br />
its western margin in the Pacific Northwest.<br />
© 2011 National <strong>Earth</strong> Science Teachers Association. All Rights Reserved.
Page 16<br />
<strong>The</strong> <strong>Earth</strong> <strong>Scientist</strong><br />
Lesson Objectives<br />
n Interpret multiple GPS data time series plots<br />
n<br />
n<br />
n<br />
n<br />
Compare and contrast motions of different GPS stations across the geographic area<br />
Propose an explanation for patterns in GPS motion<br />
Visualize deformation of the North American continental margin due to subduction of the<br />
Juan de Fuca plate<br />
Recognize long-term effects of the locked and loading margin and societal ramifications for<br />
Pacific Northwest<br />
Through illustrations and discussion students learn that the North American and Juan de Fuca<br />
plates are locked together along the western margin of the North American plate. As the Juan<br />
de Fuca Plate pushes the North American Plate margin toward the northeast, potential energy<br />
continues to build in this zone, loading the Pacific Northwestern margin with potential energy. <strong>The</strong><br />
phrase “Locked and Loading” is used to describe this process along the margin. Groups of students<br />
are provided with data from different sets of GPS stations in west-to-east transects and plot the<br />
velocities of the GPS motion on a map grid. Class data is compiled onto a single map to show<br />
the entire regional perspective (Figure 2) allowing students to visualize the motions at each GPS<br />
station. Students discuss the implications of the changes in velocities, are lead to the realization<br />
that the continental margin is being compressed (loading with potential energy), and that given<br />
enough time, the sudden release of this potential energy in a megathrust earthquake and the resultant<br />
tsunami is a significant hazard for regions bordering subduction zones.<br />
Episodic Tremor and Slip:<br />
the Case of the Mystery <strong>Earth</strong>quakes<br />
Time:<br />
4 – 5 periods<br />
Students examine GPS time series plots to analyze Episodic, Tremor, and<br />
Slip (ETS) events, use kinesthetic activities to model processes occurring on<br />
the subducting plate, and forecast the potential slip between the Juan de<br />
Fuca and North American tectonic plates.<br />
Lesson Objectives<br />
n Realize that science is a constant accumulation of data that builds<br />
upon itself<br />
n<br />
n<br />
n<br />
n<br />
Understand the role of technology in the advancement of science<br />
Interpret patterns in data to recognize cause and effect of ETS<br />
Describe important natural hazards in the Pacific Northwest<br />
Model <strong>Earth</strong> processes through the use of hands-on manipulatives<br />
Figure 3. Plotted GPS vectors in<br />
Pacific Northwest. Red arrows<br />
show direction and magnitude of<br />
motion. <strong>The</strong> deformation along<br />
continental margin compared to<br />
inland areas illustrates how the<br />
plate is locked and loading.<br />
Instruction begins with a review of the Cascadia region and the general northeast motion of the<br />
continental margin. <strong>The</strong>n, the story of the mysterious silent seismic tremors begins to engage<br />
students in the instruction. Students learn about the process of science and scientific collaboration<br />
through story-discovery: how scientists collecting tremor data originally thought that the<br />
tremors resulted from instrument error or noise from wind; once the GPS ‘slip’ data and the<br />
tremor data were plotted on the same timeline, scientists realized the tremors truly were seismic<br />
in origin and that these events were in fact real and correlated! Students discover ETS by looking<br />
© 2011 National <strong>Earth</strong> Science Teachers Association. All Rights Reserved.
Volume XXVII, Issue 1<br />
Page 17<br />
at the evidence of seismic tremor and slip data. Once the<br />
correlation between the two is realized, students view animations<br />
that mimic ground motion during ETS events. <strong>The</strong>y<br />
discover that ETS is a highly episodic <strong>Earth</strong> phenomenon<br />
with a frequency of approximately every 14 months. This<br />
allows scientists to anticipate when slow slip will occur and<br />
to monitor it. Based on the GPS time series plots, students<br />
forecast which areas will have an ETS event and predict what<br />
the GPS data time series plots would look like.<br />
Along the far western edge of the North American plate,<br />
the plate is continuously deforming to the northeast. A<br />
few hundred kilometers inland, GPS data reveals very little<br />
motion at all. So why is there this difference in motion?<br />
To explore this discrepant data, students observe warmed<br />
lasagna noodles (Figure 4) as a model of the effect of temperature<br />
on a subducting pasta ‘slab’. <strong>The</strong> warmer noodle is more ductile and bends far easier than the<br />
cold, brittle section. Students relate the noodle to the subducting Juan de Fuca plate. <strong>The</strong> cooler,<br />
shallower regions (closer to the coast) are more brittle, ‘stick’ to the North American plate above<br />
and are more likely to rupture with a sudden release of energy. Meanwhile, the plate further inland<br />
is deeper in the crust, warmer, and ‘slips’<br />
quietly beneath the North American plate.<br />
To help map the pasta noodle model to<br />
<strong>Earth</strong> processes, students study a 3-grid<br />
animation that summarizes the movement<br />
of the entire region (Figure 5).<br />
Figure 4. Students use<br />
lasagna noodles to model how<br />
differences in depth of the<br />
subducting oceanic slab affect its<br />
elasticity.<br />
Figure 5. Screen shot of ETS<br />
animation showing different GPS<br />
data sets correlated to the locked<br />
section, slip section, and interior<br />
of the subduction zone.<br />
After discussing the pasta-model results, a<br />
‘two-block’ kinesthetic activity, an adapted<br />
version of the <strong>Earth</strong>quake Machine<br />
(Hubenthal, 2008), allows students to<br />
model the build-up of stored energy<br />
and its effect on the locked zone. Two<br />
Figure 6. Student using a ‘twoblock’<br />
earthquake machine. Left<br />
photo: Potential energy is stored<br />
elastically as the student gently<br />
pulls on block(B). Right photo:<br />
Block (A), representing the locked<br />
section of the subduction zone,<br />
suddenly lurches forward as the<br />
stored energy is released in an<br />
“earthquake”.<br />
© 2011 National <strong>Earth</strong> Science Teachers Association. All Rights Reserved.
Page 18<br />
<strong>The</strong> <strong>Earth</strong> <strong>Scientist</strong><br />
Figure 7. Screenshot of<br />
animation illustrates the build-up<br />
of strain in trailing block system<br />
with each small-scale release of<br />
strain in the leading block.<br />
wooden blocks, each with sand paper glued or stapled to their lower sides, are connected together<br />
with a few thin, rubber bands and sit on a long strip of sandpaper which is taped to a desk (or<br />
mounted on strips of wood for easy portability). <strong>The</strong> leading block (representing the region inland<br />
exhibiting ETS) has fine-grit sandpaper on the bottom while the trailing block (representing the<br />
locked-zone along the continental margin) has rough-grit sandpaper on the bottom. As students<br />
steadily pull on a rubber band connected to the leading block, the leading ‘ETS slip-zone’ block<br />
will nudge forward every so often, simulating an ETS event. <strong>The</strong> rubber band connecting the two<br />
blocks stretches, loading (storing) potential energy. When enough potential energy is stored in the<br />
trailing ‘locked zone’ the trailing block lunges forward in less frequent but dramatic energy releases<br />
(megathrust earthquakes) (Figure 6). Animations of this movement graph the strain and distance<br />
moved for each block, helping to solidify<br />
the concepts learned in the kinesthetic<br />
activity and provide an opportunity to<br />
discuss concepts learned and/or needing<br />
clarification. (Figure 7). <strong>The</strong>se animations<br />
are also useful for teachers that are<br />
unable to do the hands-on activity.<br />
Students relate the two-block model to a<br />
megathrust earthquake and the tsunami<br />
hazard of a massive shift of the ocean<br />
floor, in the final “Why You Need to<br />
Know This!” portion of the ETS lesson.<br />
Based on the ‘slip deficit’ building in<br />
the locked zone over 500 years (the average time between the megathrust earthquake events in the<br />
Cascadia region) students calculate the potential slip distance that could occur from a future megathrust<br />
earthquake and discuss how ETS can be used to forecast times of higher likelihood of these<br />
dangerous quakes. This discussion can lead naturally into a deeper discussion of societal impacts<br />
and steps students can take to mitigate the risks of living in an earthquake hazard zone.<br />
Conclusion<br />
Depending on the teaching approach, implementing this suite of lessons may require a time investment<br />
of up to two weeks. While this may seem like a lot of time, the breadth of math, technology,<br />
geography, earth science, and physics standards supported make it a worthwhile investment. <strong>The</strong><br />
process of learning about GPS and ETS is vital to students that live, or at some point in their future,<br />
may live in the Pacific Northwest or near another subduction zone. As we have learned through<br />
other large natural disasters, such as Katrina, the impact of natural disasters is not limited to the<br />
region directly affected by the event and can have long term effects throughout society. Geological<br />
hazards are real, and with the methodologies described, the animations, the kinesthetic modeling,<br />
and the build-up of content knowledge in science and math, students are able to learn deeply about<br />
these hazards while practicing sound science process skills. <strong>The</strong> Pacific Northwest Seismic Network<br />
has a deep tremor blog (Blog for ETS of Summer, 2010, n.d.) that students can access to learn when<br />
the next event is forecast to occur. In the end, students understand ETS and its relation to natural<br />
hazards, are intrigued by the story of its discovery, and are eager to share their new found knowledge,<br />
which may be vital to their family’s safety.<br />
So, should Episodic Tremor and Slip be taught in a middle school classroom? Absolutely!<br />
© 2011 National <strong>Earth</strong> Science Teachers Association. All Rights Reserved.
Volume XXVII, Issue 1<br />
Page 19<br />
References<br />
Blog for ETS of Summer, 2010 Deep Tremor News: Mar, 2010 - … (until it is over). (n.d.). Retrieved from http://www.<br />
pnsn.org/WEBICORDER/DEEPTREM/summer2010.html<br />
Groom, Roger; Olds, Shelley. (January, 2011) ETS in the Pacific Northwest. Retrieved from http://www.unavco.<br />
org/cws/modules/cws/modules/ETS_pacificnorthwest/<br />
Hubenthal, M., Braile, L., & Taber, J. (2008). Redefining earthquakes & the earthquake machine. <strong>The</strong> Science<br />
Teacher, 75(1), 32-36.<br />
IRIS. (n.d.). GPS- Measuring Plate Motion [Animation]. Retrieved from<br />
http://www.iris.edu/hq/programs/education_and_outreach/animations/14<br />
Teachers On <strong>The</strong> Leading Edge (TOTLE). (n.d.). Retrieved from http://orgs.up.edu/totle/<br />
About the Authors<br />
Roger Groom (rgroom@pps.k12.or.us) is a science teacher at Mt. Tabor Middle School, 5800 SE Ash St.,<br />
Portland, OR 97215.<br />
Shelley Olds (olds@unavco.org) is the Science Education Specialist at UNAVCO, 6350 Nautilus Dr., Boulder,<br />
CO 80301<br />
Robert F. Butler (butler @up.edu) is a professor of geophysics in the Dept. Environmental Science, at the<br />
University of Portland, 5000 N. Willamette Blvd., Portland, OR 97203-5798<br />
Jenda Johnson (jendaj@comcast.net) is an animator at Volcano Video & Graphics, 1924 NE 47th St.,<br />
Portland, OR 97215.<br />
Windows to the Universe Schedule of Workshops<br />
NSTA National Conference, March 9 – 12, 2011<br />
San Francisco<br />
Thursday, March 10<br />
• Activities from Across the <strong>Earth</strong> System 8:00-9:00am Moscone Center, 220 & 222<br />
• Tackling the Global Warming Challenge 9:30-10:30am Marriott San Francisco Marquis, Yerba<br />
Buena Salon 11<br />
• Playing with Ecosystem Science: Informal Modeling Games 12:30-1:30pm Marriott San Francisco<br />
Marquis, Yerba Buena Salon 11<br />
Friday, March 11<br />
• Point, Game,Set, Match 12:30-1:30pm Hilton San Fran Union Square, Continental 3<br />
• Beyond Mere Attraction: Measuring Magnetism 2:00-3:00pm Moscone Center, 220 & 222<br />
Saturday, March 12<br />
• Virtual Labs in the <strong>Earth</strong> Sciences: Melting Ice, Warming Climate, and Ballooning Through the<br />
Stratosphere 9:30-10:30am Moscone Center, 232 & 234<br />
Windows to the Universe is a project of the National <strong>Earth</strong> Science Teachers Association<br />
© 2011 National <strong>Earth</strong> Science Teachers Association. All Rights Reserved.
Page 20<br />
<strong>The</strong> <strong>Earth</strong> <strong>Scientist</strong><br />
About the poster<br />
<strong>The</strong> poster featured in this issue combines a visualization of ground motion<br />
resulting from the February 21, 2008 M 6.0 earthquake that occurred near<br />
Wells, NV, with the image of a faucet to illustrate a classic <strong>Earth</strong> science functional<br />
analogy: “Seismic waves radiate outward from an earthquake’s epicenter like ripples<br />
on water”. For students this discrepant image attracts attention and links the unfamiliar<br />
concept of the spreading out of seismic waves (the target) to a similar but<br />
more familiar scenario of ripples on water radiating outwards in all directions after<br />
a droplet or pebble falls onto it (the analog). Additionally the material is made<br />
approachable by using a clean artistic design, ideas students are likely to have experienced,<br />
and a prominent URL where students to learn more. When presented at the<br />
beginning of seismic waves instruction, this poster and it’s question (<strong>Earth</strong>quakes…<br />
like ripples on water?) becomes the catalyst for student-generated questions,<br />
inquiry, and learning.<br />
n<br />
To learn more about the poster or to request a copy visit http://www.iris.<br />
edu/hq/explore<br />
P A CIFIC OCEA N<br />
seconds 150 seconds<br />
Time after earthquake<br />
C A N A D A<br />
U N I T ED ST A T E S<br />
February 21, 2008 — Wells, Nevada, M=6.0<br />
+.001 mm<br />
Normal<br />
ground<br />
surface<br />
- .001 mm<br />
An earthquake can be compared to a water drop that is suspended from a<br />
faucet and fa ls into a pool creating ripples. Like the drop that fa ls, earthquakes<br />
result from the sudden conversion of potential energy, stored elastica ly in<br />
rocks, to kinetic energy. <strong>The</strong>n, like the ripples on water, the released energy<br />
travels outward through <strong>Earth</strong> in a l directions a seismic waves. Seismic waves<br />
propagate by temporarily deforming the ground. Sensitive instruments ca led<br />
seismometers detect and record these ground changes. Ground deformations<br />
fo lowing the We ls, NV earthquake were recorded at nearly 400 seismometers<br />
and combined to create the visualization in this poster.<br />
www.iris.edu/explore<br />
Visit us for further exploration and to access instructional resources related to this imagery<br />
n<br />
n<br />
To learn more about the ground motion visualizations used in the poster see http://www.iris.edu/hq/waves_about<br />
For ideas on using ground motion visualizations in classroom instruction see USArray Visualizations Show Seismic<br />
Waves Sweeping Across the U.S in this issue.<br />
Wish you had super-vision?<br />
eismologists do have powers...using<br />
seismic energy from earthquakes scientists<br />
can “see” deep inside the <strong>Earth</strong>. Now you and your<br />
students can too!<br />
DR. GEOPHYSICS<br />
IRIS Animations offer an accessible view of seismological<br />
concepts such as:<br />
• How do we capture the motion of an earthquake?<br />
• Where do travel-time graphs come from?<br />
• How do earthquakes reveal secrets of <strong>Earth</strong>’s interior?<br />
• Why do seismic waves travel a curving path through the <strong>Earth</strong>?<br />
• How do P & S waves give evidence for a liquid outer core?<br />
• Can an earthquake be compared to a drop of water on a pond?<br />
Simple-concept Animations & Video Lectures are available from IRIS: www.iris.edu/hq/programs/education_and_outreach<br />
© 2011 National <strong>Earth</strong> Science Teachers Association. All Rights Reserved.
Volume XXVII, Issue 1<br />
Page 21<br />
USArray Visualizations Show<br />
Seismic Waves Sweeping Across<br />
the U.S.<br />
Robert F. Butler, Christopher D. Hedeen and Roger Groom<br />
Abstract<br />
USArray is a collection of high-precision seismometers that record seismic waves from<br />
worldwide earthquakes with unprecedented spatial resolution. Visualizations of seismic<br />
waves sweeping across USArray provide visual reinforcement of seismic wave properties<br />
including the relative speeds of P (pressure), S (shear), and surface waves.<br />
Introduction<br />
Helping students understand properties of seismic waves is fundamental to teaching about earthquakes,<br />
seismology, and the internal structure of the <strong>Earth</strong>. <strong>The</strong>re are many ways to introduce<br />
students to types of seismic waves and their properties. Each pedagogical approach emphasizes the<br />
two families of seismic body waves, P (= compressional) and S (= shear) waves, that travel through<br />
the interior of the <strong>Earth</strong> and the surface waves that travel around <strong>Earth</strong>’s perimeter as they oscillate<br />
the crust and uppermost part of the mantle. Braile (2010a) provides background on seismic waves<br />
and computer animations of the different types of waves. Braile (2005, 2010b) explains how a single<br />
Slinky ® can be used to demonstrate P and S motions along one ray path while multiple Sinkys ® can<br />
be used to demonstrate wave fronts radiating away from a concentrated source like an earthquake.<br />
<strong>The</strong> freeware PC computer program Seismic Waves illustrates the propagation of P, S, and surface<br />
waves from an earthquake around and through the <strong>Earth</strong> (Jones, 2010). This computer program is<br />
an effective way for students to get the “big picture” of seismic waves travelling from an earthquake<br />
to distant locations as they refract and reflect (bend and bounce) at boundaries between internal<br />
zones of our planet. Taking students through this progression of seismic waves from a single ray<br />
path, to wave fronts of multiple rays, then to the global view of P, S, and surface waves travelling<br />
through and around <strong>Earth</strong> allows students to build their understanding of seismic waves in a<br />
logical fashion. <strong>The</strong> dense array of transportable seismometers known as USArray offers teachers<br />
and students an additional step in this progression through the ability to visualize seismic waves<br />
sweeping across North America.<br />
<strong>Earth</strong>Scope is a ten-year series of geophysical experiments to explore the structure of the North<br />
American continent and the underlying mantle (<strong>Earth</strong>Scope, 2010). One component of <strong>Earth</strong>Scope<br />
is USArray, a transportable network of 400 high-precision seismometers spaced about 70 kilome-<br />
© 2011 National <strong>Earth</strong> Science Teachers Association. All Rights Reserved.
Page 22<br />
<strong>The</strong> <strong>Earth</strong> <strong>Scientist</strong><br />
Figure 1. USArray seismometer<br />
deployment map. Starting in<br />
2004, the array collected data<br />
over the western U.S. and has<br />
stepped progressively across the<br />
U.S. to its present location in the<br />
central portion of the contiguous<br />
48 states.<br />
ters apart (Figure 1). During the course<br />
of the <strong>Earth</strong>Scope Project, seismometers<br />
will have occupied almost 2000 sites as<br />
the array steps across the contiguous 48<br />
states and Alaska. <strong>The</strong>se seismometers<br />
remain in one location for about 24<br />
months before being moved to their next<br />
station. In this fashion, USArray is stepping<br />
across the U.S. recording minute<br />
vibrations of <strong>Earth</strong>’s surface caused by<br />
thousands of worldwide earthquakes each<br />
year. Research seismologists are analyzing<br />
these data to produce detailed three-dimensional images of the crust and upper mantle much like<br />
a radiologist uses thousands of X-rays shot through the human body in many directions to “see”<br />
details of internal organs. In this article, we describe how visualizations of seismic waves, recorded<br />
by USArray, allow visualization of seismic wave propagation as never before and how these visualizations<br />
can be used in middle school and high school <strong>Earth</strong> Science teaching.<br />
USArray Visualizations<br />
USArray visualizations provide a unique and powerful view of seismic wave propagation. <strong>The</strong> most<br />
time-efficient and effective way to learn to interpret USArray visualizations is to work through<br />
the tutorial provided by the Incorporated Research Institutes for Seismology (IRIS, 2010). Before<br />
beginning instruction, is important to spend time studying each tutorial section to become familiar<br />
with the methods used to display the ground motions detected by USArray. In fact, the tutorial can<br />
also be shown as part of whole class instruction in a middle school or explored individually by high<br />
school students as an introduction to the USArray visualizations. Before you leave this tutorial, you<br />
should download the high-resolution visualization QuickTime file by clicking on the label “Hi-Res<br />
36MB” beneath the second visualization window in Tutorial #5 (IRIS, 2007a). <strong>The</strong> downloaded file<br />
should have a QuickTime icon with name “mariana_globe”. You will use this visualization in the<br />
classroom demonstration described below.<br />
Contrasting Velocities of Different Seismic Waves<br />
<strong>The</strong> second visualization of Tutorial #5 shows seismic waves from a magnitude 7.4 earthquake<br />
in the Mariana Islands sweeping across the USArray seismometers. This earthquake occurred on<br />
September 28, 2007 when the array was located across the western U.S. <strong>The</strong> visualization starts<br />
with a global view of the wave fronts of P, S, and surface waves radiating away from the epicenter<br />
in the Mariana Islands of the western Pacific Ocean. On the visualization, P waves are color coded<br />
green while S waves are colored red and surface waves are shown in yellow. We offer two tips to<br />
help you and your students get the most out of the global view in this visualization while avoiding<br />
potential misconceptions: (1) It can be helpful to compliment the “flat screen” global view on the<br />
visualization by holding a globe and pointing out the locations of the epicenter and USArray to<br />
reinforce the actual three-dimensional spherical geometry. (2) On the visualization, the wave fronts<br />
of the P and S waves (body waves) appear as expanding circles with the epicenter at the center of<br />
those circles. To avoid the potential misconception that P and S waves travel only along the surface<br />
but faster than the seismic surface waves, these USArray visualizations can be supplemented with<br />
a program that illustrates how body waves propagate through <strong>Earth</strong>’s interior. <strong>The</strong> Seismic Waves<br />
program is particularly effective for this purpose (Jones, 2005).<br />
© 2011 National <strong>Earth</strong> Science Teachers Association. All Rights Reserved.
Volume XXVII, Issue 1<br />
Page 23<br />
Following the global view, the visualization zooms in<br />
on USArray in the western U.S. as P, S, and surface wave<br />
fronts sweep across the collection of seismometers<br />
(Figure 2). On this view, the speeds of travel of different<br />
waves are visibly distinguishable with P waves travelling<br />
faster than S waves that in turn travel faster than surface<br />
waves. Students in our middle-school, high-school,<br />
and undergraduate <strong>Earth</strong> Science classes indicate that<br />
such visualizations are a very effective as a visual reinforcement<br />
of the contrasting velocities of seismic waves<br />
discussed in class. Our students often comment that<br />
the USArray visualization is the most effective item they<br />
have seen, heard, or read that helps them understand the<br />
relative speeds of seismic waves.<br />
Measuring Seismic Wave<br />
Travel Times<br />
To get more out of this visualization, examine the travel times for P, S, and surface waves from<br />
the earthquake to USArray and determine the times required for these waves to cross the array.<br />
Time is shown on the bottom left corner of the lower inset of the visualization. <strong>The</strong> format for<br />
the time stamp is YYYY DDD HH MM SS with time in Greenwich Mean Time. For example, the<br />
origin time for the Mariana Islands earthquake at 13:38:58 on September 28, 2007 translates to<br />
2007 271 13 38 58, the time stamp on the first frame of the visualization. Carefully examine details<br />
of timing of the seismic waves. For example, use the fast-forward, rewind and pause buttons of<br />
your media player to control the visualization to determine exactly when the first S wave arrive<br />
in the northwest corner of USArray? In this way, the times of arrival of P, S, and surface waves at<br />
the USArray station nearest the earthquake in northwest Washington (Forks, WA station about<br />
Figure 2. Shear (S) waves from<br />
September 28, 2007 Mariana<br />
Islands earthquake crossing<br />
USArray. Each seismometer<br />
recording an upwards motion<br />
of <strong>Earth</strong>’s surface is shown<br />
by a blue circle while each<br />
seismometer recording a<br />
downwards motion is shown by<br />
a red circle. <strong>The</strong> pattern of red<br />
and blue dots indicates that two<br />
full S waves fit within the long<br />
dimension of the seismometer<br />
array. <strong>The</strong> red line on the map<br />
indicates the front of the series<br />
of S waves. Top inset illustrates<br />
an edge-on view of seismic<br />
waves travelling perpendicular<br />
to the wave fronts. Bottom inset<br />
illustrates the seismogram<br />
recorded by the station circled<br />
with red line in southern Oregon.<br />
<strong>The</strong> red line on the seismogram<br />
is the time mark.<br />
Observation<br />
units<br />
Time<br />
(GMT)<br />
Travel Time<br />
(HH MM SS)<br />
<strong>Earth</strong>quake occurs in Mariana Islands 13 38 58 00 00 00<br />
Table 1. Travel times for P, S, and<br />
surface waves from earthquake<br />
in Mariana Islands to USArray<br />
seismic stations.<br />
1st P wave arrives in northwest WA 13 50 13 00 11 15<br />
1st P wave leaves southeast AZ 13 51 43 00 12 45<br />
Time for P wave to cross USArray 00 01 30<br />
1st S wave arrives in northwest WA 13 59 33 00 20 35<br />
1st S wave leaves southeast AZ 14 02 23 00 23 25<br />
Time for S wave to cross USArray 00 02 50<br />
1st surface wave arrives in northwest WA 14 16 33 00 37 35<br />
1st surface wave leaves southeast AZ 14 25 18 00 46 20<br />
Time for surface wave to cross USArray 00 08 45<br />
Surface wave arrives in southeast AZ after travelling the long way<br />
around <strong>Earth</strong> from Mariana Islands to USArray!<br />
15 51 38 02 12 40<br />
© 2011 National <strong>Earth</strong> Science Teachers Association. All Rights Reserved.
Page 24<br />
<strong>The</strong> <strong>Earth</strong> <strong>Scientist</strong><br />
8400 km [~76° epicentral distance] from the earthquake) and farthest from the earthquake in<br />
southeast Arizona (Douglas, AZ station about 10,300 km [~93° epicentral distance] from the earthquake)<br />
have been determined and are listed in Table 1. <strong>The</strong>se arrival times and the time required for<br />
P, S, and surface waves to cross USArray, nicely demonstrate the relative speeds of different types of<br />
seismic waves. While textbooks describe how P waves are faster than S waves that in turn are faster<br />
than surface waves, this visualization of seismic waves quantitatively reinforces these important<br />
concepts. You can turn this segment of the classroom demonstration into an inquiry lesson by<br />
giving students the “mariana_globe” visualization and having them determine the arrival times.<br />
Even after the P, S, and surface waves from the Mariana Islands earthquake have swept across<br />
USArray, there is still more information to be gathered from careful analysis of this visualization.<br />
After the surface waves leave USArray, there are other waves that continue to be detected by the<br />
seismometers. <strong>The</strong>se include P and S waves that have reflected and refracted at <strong>Earth</strong>’s internal<br />
boundaries such as the boundary between the mantle and outer core and between the inner and<br />
outer core. At about 70 minutes (4200 seconds) after the earthquake, some well-defined waves<br />
traverse from southeast to<br />
R 1 R 2<br />
R 3<br />
R 4<br />
Seismic Station<br />
Epicenter<br />
Figure 3. Paths of travel of<br />
surface waves from the great<br />
Sumatra – Andaman Islands<br />
earthquake of December 26,<br />
2004 observed from a seismic<br />
station in east Africa. R1 is<br />
the first arriving surface wave<br />
that travelled directly from the<br />
earthquake westward to the<br />
station while R2 is the second<br />
arriving surface wave that<br />
travelled eastward the long<br />
way from the earthquake to the<br />
station. R3 and R4 are surface<br />
waves that travelled more<br />
than once around the planet to<br />
the station in a westward and<br />
eastward direction, respectively.<br />
Time Since <strong>Earth</strong>quake (minutes)<br />
Paths of earthquake surface waves as they travel multiple times around the <strong>Earth</strong>.<br />
northwest across USArray.<br />
<strong>The</strong>se are P waves then S<br />
waves that have travelled the<br />
long way around the <strong>Earth</strong><br />
from the Mariana Islands to<br />
USArray. At about 2 hours<br />
and 13 minutes after the<br />
earthquake, a yellow line<br />
travelling from southeast<br />
to northwest arrives in southeast Arizona. This is the surface wave that travelled the long way<br />
(29,600 km!) around the <strong>Earth</strong> from the Mariana Islands to USArray. Figure 3 shows the paths of<br />
surface waves that can travel multiple times around the <strong>Earth</strong>. It is astonishing that seismic waves<br />
that have travelled all the way around planet <strong>Earth</strong> can still be detected by sensitive seismometers!<br />
Great earthquakes, like the December 26, 2004 magnitude 9.2 Sumatra earthquake, generate<br />
seismic waves that are detectable after several passages around the globe. In fact, great earthquakes<br />
cause the <strong>Earth</strong> to vibrate like a bell in “free oscillations” that can last for several days after the<br />
earthquake.<br />
Accessing and Using USArray Visualizations from<br />
Other <strong>Earth</strong>quakes<br />
<strong>The</strong> generation of visualizations of the data from the USArray has become an automated process at<br />
the IRIS Data Management Center. As a result, hundreds of visualizations are available for download<br />
from this archive (IRIS, 2007b). <strong>The</strong> most effective way to search for a visualization is to know<br />
the date of the earthquake. For example, the visualization for the magnitude 7.9 Sichuan earthquake<br />
that took more than 85,000 lives on May 12, 2008 can be located by searching on the date<br />
using the format 2008/05/12. Once you have located the desired earthquake in the archive, you can<br />
view the visualization by simply clicking on the link to the visualization in the right hand column.<br />
To find visualizations for earthquakes recorded when USArray was located in your region, you can<br />
use figure 1 to determine when the array was in your area then search the archive for notable events<br />
during that interval. <strong>The</strong>re are many possibilities for computer lab activities in which students<br />
can search the archive for visualizations. For example, the visualization for the Wells, Nevada<br />
earthquake of February 21, 2008 (IRIS, 2008) is a favorite because the earthquake occurred within<br />
USArray and the radiation of seismic waves away from the epicenter is quite dramatic. A classroom<br />
© 2011 National <strong>Earth</strong> Science Teachers Association. All Rights Reserved.
Volume XXVII, Issue 1<br />
Page 25<br />
poster titled “<strong>Earth</strong>quakes ….. like ripples on water?” and an activity featuring seismic waves radiating<br />
from this earthquake are available from IRIS (2010). Indeed the poster featuring the Wells,<br />
Nevada earthquake is included in this issue of <strong>The</strong> <strong>Earth</strong> <strong>Scientist</strong> to serve as an invitation to students<br />
as they begin studies of earthquakes and seismology.<br />
Acknowledgments: This material is based upon work supported by the National Science Foundation<br />
under Grant No. EAR-0745692. Tammy Bravo and Jenda Johnson provided very helpful<br />
comments on the classroom demonstration lesson plan and on this manuscript. We thank Michael<br />
Hubenthal for comments and suggestions that improved the manuscript.<br />
References<br />
Note: A PDF with “live” links to the Internet resources below can be retrieved from http://orgs.up.edu/totle/<br />
index.php?q=node/413<br />
Ammon, C.J., & Lay, T. (2007, October 15). Animating the Seismic Wavefield with USArray. Retrieved from<br />
http://eqseis.geosc.psu.edu/~cammon/QA/Ammon-Lay-GSAToday.pdf<br />
Bahavar, M. & Trabant, C. (2009). USArray Ground Motion Visualization. DMS Newsletter, 11(4). Retrieved from<br />
http://www.iris.edu/news/newsletter/vol11no4/usarray_visualizations.htm<br />
Braile, L.W. (2005). Seismic Wave Demonstrations Using the Slinky. <strong>The</strong> <strong>Earth</strong> <strong>Scientist</strong>, 21(2), 15-19.<br />
Braile, L.W. (2010a). Seismic Wave Demonstrations and Animations. Retrieved from http://web.ics.purdue.<br />
edu/~braile/edumod/waves/WaveDemo.htm<br />
Braile, L.W. (2010b). Seismic Waves and the Slinky: A Guide for Teachers. Retrieved from http://web.ics.purdue.<br />
edu/~braile/edumod/slinky/slinky.htm<br />
<strong>Earth</strong>Scope. (2010). Retrieved from http://www.earthscope.org/<br />
Incorporated Research Institutes for Seismology. (2010). Tutorial Data Visualizations. Retrieved from http://www.<br />
iris.edu/hq/programs/education_and_outreach/visualizations/tutorial<br />
IRIS. (2007a). [Visualization of seismic waves from September 28, 2007 Mariana Islands earthquake]. Retrieved<br />
from http://www.iris.edu/hq/files/programs/education_and_outreach/visualizations/videos/mariana_<br />
globe.mov<br />
IRIS. (2008). [Visualization of seismic waves from February 21, 2008 Wells, Nevada earthquake]. Retrieved from<br />
http://www.iris.edu/dms/products/usarraygmv/movies/GMV_2008_02_21_141605.mp4<br />
IRIS. (2007b). [USArray Ground Motion Visualizations archive]. Retrieved from http://www.iris.edu/dms/<br />
products/usarraygmv/<br />
IRIS. (2010). [Poster] <strong>Earth</strong>quakes ….. like ripples on water? Retrieved from http://www.iris.edu/hq/resource/<br />
waves_teacher<br />
Jones, A. (2005). Using the Seismic Waves Program in Schools. <strong>The</strong> <strong>Earth</strong> <strong>Scientist</strong>, 21(2), 26-27.<br />
Jones, A.L. (2010). Seismic Waves (Version 2.1) [Software]. Available from http://bingweb.binghamton.<br />
edu/%7Eajones/#Seismic%20Waves<br />
About the Authors<br />
Robert F. Butler (butler @up.edu) is a professor of geophysics in the Dept. Environmental Science, at<br />
the University of Portland, 5000 N. Willamette Blvd., Portland, OR 97203-5798<br />
Christopher D. Hedeen (Chris.Hedeen@orecity.k12.or.us) is a science teacher at Oregon City High<br />
School, 19761 S Beavercreek Rd, Oregon City, OR 97045.<br />
Roger Groom (rgroom@pps.k12.or.us) is a science teacher at Mt. Tabor Middle School, 5800 SE Ash<br />
St., Portland, OR 97215.<br />
© 2011 National <strong>Earth</strong> Science Teachers Association. All Rights Reserved.
Page 26<br />
<strong>The</strong> <strong>Earth</strong> <strong>Scientist</strong><br />
Advertising in the NESTA Quarterly Journal, <strong>The</strong> <strong>Earth</strong> <strong>Scientist</strong><br />
NESTA will accept advertisements that are relevant to <strong>Earth</strong> and space science education. A limited number of<br />
spaces for advertisements are available in each issue.<br />
Artwork<br />
We accept CD or electronic ad files in the following formats: high-res PDF, TIFF or high-res JPEG. Files must<br />
have a minimum resolution of 300 dpi. Ads can be in color.<br />
Advertising Rates<br />
Full-page 7.5” w × 10” h $500 Quarter-page 3.625”w × 4.75”h $125<br />
Half-page 7.25” w × 4.75” h $250 Eighth-page 3.625”w × 2.375”h $75<br />
Submission Deadlines for Advertisements<br />
Submission dates given below are the latest possible dates by which ads can be accepted for a given issue.<br />
Advertisers are advised to submit their ads well in advance of these dates, to ensure any problems with the<br />
ads can be addressed prior to issue preparation. <strong>The</strong> TES Editor is responsible for decisions regarding the<br />
appropriateness of advertisements in TES.<br />
Issue Submission Deadline Mailing Date<br />
Spring January 15 March 1<br />
Summer April 15 June 1<br />
Fall July 15 September 1<br />
Winter October 31 January 1<br />
For further information<br />
contact Howard Dimmick,<br />
Treasurer, dimmick@<br />
esteacher.org<br />
Access Seismic Event Data<br />
<strong>The</strong> IRIS <strong>Earth</strong>quake Browser is an interactive interface for retrieving and viewing earthquake epicenter data<br />
superimposed on a map of the world.<br />
■ Web-based – nothing<br />
to download or install!<br />
■ Easy and intuitive to<br />
use!<br />
■ World-view or zoom to<br />
regional or even local<br />
views of seismicity!<br />
■ Filter events by date,<br />
magnitude or depth!<br />
■ Export events to a table<br />
for offline student use!<br />
■ Event catalog extends<br />
to the 1960s!<br />
■ 3-D event display<br />
coming soon!<br />
http://www.iris.edu/ieb<br />
© 2011 National <strong>Earth</strong> Science Teachers Association. All Rights Reserved.
Volume XXVII, Issue 1<br />
Page 27<br />
Understanding <strong>Earth</strong> Processes:<br />
Student Alternative Conceptions<br />
about Geophysics Concepts<br />
Julie Libarkin and Emily Geraghty Ward<br />
Abstract<br />
Understanding student ideas about science is an important part of instruction, and<br />
can provide the insight needed to help students build deep conceptual understanding.<br />
Geophysical phenomena, particularly gravity and geomagnetism, play an important role<br />
in our understanding of the <strong>Earth</strong>. <strong>The</strong> mechanisms by which mountains are built, the<br />
nature of plate tectonic movement over time, and even the structure of the planet are all<br />
explored through the use of geophysical data. Students hold a wide array of alternative<br />
conceptions about geophysics, and some of these ideas persist despite instruction and<br />
expertise. We present a brief review of the literature on students’ conceptions of geophysical<br />
topics and make suggestions for use of research-based alternative conceptions in the<br />
classroom.<br />
Introduction<br />
<strong>The</strong> interdisciplinary field of geophysics plays an important role in classroom instruction about<br />
many geoscience topics. For example, concepts like gravity are necessary to understand phenomena<br />
such as the ocean tides while a conceptual understanding of magnetism is needed to explain the<br />
origin of the Northern Lights. Likewise, physics is both inherent to the forces responsible for<br />
plate tectonic processes and the backdrop for the geophysical techniques that were central to the<br />
development of plate tectonic theory. With the push toward involving real-world scenarios and<br />
problem-based learning in today’s science classrooms, designing classroom activities requires<br />
attention to the latest findings in science. Hence, instructors may incorporate data gathered from<br />
modern techniques such as gravity anomalies, LiDAR, and magnetic imaging, for example, to build<br />
an understanding of geoscience phenomena in subfields as diverse as glaciology, paleontology, and<br />
petroleum geology.<br />
Student conceptions about geoscience topics have gained significant attention in recent years,<br />
spurred by similar work in other fields as well as from recognition of the importance of student<br />
ideas in designing effective instruction. This research spans the K-college continuum, and has<br />
occurred in the U.S. and abroad. Comprehensive reviews covering a wide range of studies and<br />
suggestions for instruction are available in Dove (1998), King (2008) and Cheek (2010). For this<br />
© 2011 National <strong>Earth</strong> Science Teachers Association. All Rights Reserved.
Page 28<br />
<strong>The</strong> <strong>Earth</strong> <strong>Scientist</strong><br />
paper, we focus on those conceptions pertaining to geophysics and offer recommendations on how<br />
to use these conceptions to inform instruction and facilitate student learning. You will notice that<br />
we use the term “alternative conception” rather than “misconception” throughout this paper. While<br />
scientists favor “misconception”, science educators have pointed out that students’ alternative ideas<br />
can be based on deep reasoning and can contain elements of correct models, rather than simply<br />
being incorrect. For this reason, we favor “alternative conception” when discussing students’ nonscientific<br />
ideas.<br />
Student Ideas about Geophysics<br />
We broadly interpret “geophysics” to mean those concepts typically classified within the domain<br />
of geophysics, such as seismology, as well as geoscience phenomena that are explained through<br />
inherently physical principles. Research on student conceptions about geomagnetism and <strong>Earth</strong>’s<br />
gravitational field is well developed, with some work evident in other geophysical areas, such as seismology.<br />
<strong>The</strong> first author has participated in research on conceptual understanding with children<br />
as young as 6, with middle school, high school and college students, and with graduate students<br />
and expert geoscientists. Data collected over the past decade has revealed a startling persistence<br />
in alternative conceptions across all ages and groups. Although our research was not designed to<br />
collect ideas about geophysics, per se, the totality of the peer-reviewed literature and our own data<br />
provide insight into those ideas that are most common and may persist despite instruction. We<br />
have summarized some of the most prevalent ideas below.<br />
Geomagnetism and <strong>Earth</strong>’s Gravitational Field<br />
<strong>The</strong> origins of the <strong>Earth</strong>’s magnetic and gravitational fields, as well as their effects, are a mystery<br />
to many students. Very often, the cause and effect of each of these fields are confused with the<br />
other, resulting in reasoning that is far afield from scientific models. For example, students often<br />
reason about what would happen on <strong>Earth</strong> as the result of simple changes to <strong>Earth</strong>’s magnetism or<br />
gravity. In an interview, one college student reasoned about the result of the <strong>Earth</strong>’s magnetic field<br />
vanishing:<br />
Question: “So if we didn’t have a magnetic field, like let’s say you and I were walking hand in hand<br />
down the street and the magnetic field just disappeared, what would happen?”<br />
Response: “If it disappeared, in theory it seems like everything would just fly off into space.”<br />
<strong>The</strong> expressed idea that the magnetic field keeps objects at <strong>Earth</strong>’s surface is quite prevalent in<br />
our research. Students similarly believe that magnetism plays a role in keeping satellites in orbit.<br />
Common ideas about the origin of gravity include gravity being produced by: <strong>Earth</strong>’s rotation, the<br />
geomagnetic field, material beneath <strong>Earth</strong>’s surface, <strong>Earth</strong>’s planetary position, and the Moon (e.g.,<br />
Asghar & Libarkin, 2010). <strong>The</strong> <strong>Earth</strong>’s magnetic field, in addition to being confounded with the<br />
gravitational field, is believed by many students to originate from magnets or magnetic rocks at the<br />
<strong>Earth</strong>’s poles (Marques & Thompson, 1997), stripes on the sea floor, or a magnet in <strong>Earth</strong>’s core.<br />
Other Ideas<br />
Student ideas about the forces responsible for the movement of material on <strong>Earth</strong>, both at the<br />
surface and within the planet, are influenced by common alternative conceptions about physics and<br />
geophysics. Regardless of whether or not students are considering movement of ice, tectonic plates,<br />
or mountains, student ideas about pressure, gravity, magnetism and geophysical processes influence<br />
ideas about movement. For example, students may believe that magnetic polar wander (Marques<br />
&Thompson, 1997), magnetic stripes on the ocean floor, ocean currents, or earthquakes cause<br />
tectonic plate motion. Similarly, many students believe that rocks subside to form ocean basins<br />
© 2011 National <strong>Earth</strong> Science Teachers Association. All Rights Reserved.
Volume XXVII, Issue 1<br />
Page 29<br />
(Marques &Thompson, 1997), and that a release of internal pressure causes rocks to move, forming<br />
mountains. Similar alternative conceptions about movement of other material, such as glaciers or<br />
sediment, are quite common and well documented in the literature (e.g., Cheek, 2010).<br />
Research into student ideas about other geophysical concepts is growing, although much research<br />
remains to be done. Study of student conceptions about earthquakes is increasing in young children,<br />
in college students, and in countries where earthquakes are an active hazard (e.g., Rakkapao,<br />
Arayathanitkul, & Pananont, 2009). <strong>The</strong>se emerging data indicate that students have a weak grasp<br />
of the meaning of “earthquake”, literally equating earthquakes to shaking rather than energy<br />
release, and find many of the fundamentals of seismology, such as wave types, confusing. By extension,<br />
students’ ability to reason about the evidence underlying models of <strong>Earth</strong>’s interior is shaky<br />
(e.g., King, 2002). Analysis of student conceptions about other domains of geophysics, such as<br />
seismic refraction, warrants significant further research.<br />
Persistence of Ideas<br />
Research indicates that alternative conceptions about geophysics may persist well beyond secondary<br />
school, even among experts. This persistence may result from the fact that most undergraduate<br />
and graduate faculty, and perhaps even teachers, assume that students hold a basic scientific understanding<br />
of gravity, magnetism, force, and other physical concepts. For example, published work<br />
(Asghar & Libarkin, 2010) indicates that students’ conceptual understanding in entry-level geoscience<br />
courses looks much like that of young children when it comes to ideas about the cause of<br />
<strong>Earth</strong>’s gravity. In fact, we have found that advanced undergraduate majors, graduate students and<br />
even college faculty teaching in related <strong>Earth</strong> sciences hold alternative conceptions about geophysics<br />
and the role of physical principles in explaining <strong>Earth</strong> processes. In interviews with college students,<br />
graduate students and expert geoscience faculty, Clark (2009) documented persistence of the<br />
idea that subducting plates melt to produce surface volcanism. This alternative conception may<br />
result from, or be reinforced by, a misunderstanding of the scientific model for subduction-related<br />
melting as well as observations. Dewatering of minerals in subducting plates produces melts in<br />
overlying asthenosphere, which then rise towards <strong>Earth</strong>’s surface. <strong>The</strong> concept of dewatering is not<br />
clearly explained in entry-level texts or online resources; melting and dewatering can easily become<br />
confused within the complex model that is plate tectonics. In addition, the idea of a melting plate<br />
does not contradict observations; the melts produced by a subducting plate and the melts produced<br />
by asthenosphere will be compositionally similar to anyone but a trained petrologist. Being able to<br />
reason that the asthenosphere melts, rather than the subducting plate, requires an understanding<br />
that a subducting plate is too cold to melt at the depths (and pressures) at which magmas are being<br />
produced. (<strong>The</strong> fact that even expert geologists do not independently utilize this reasoning suggests<br />
that many people will still hold alternative conceptions related to fundamental aspects of the plate<br />
tectonic model even after instruction (Clark, 2009). Once we recognize that alternative conceptions<br />
are both common and to be expected, we can use them as a starting point for engaging students in<br />
deep thinking about geophysics.<br />
Implications for Instruction<br />
We argue that geoscience is particularly hard-pressed for opportunities that encourage students to<br />
challenge their models about phenomena because many geologic processes have occurred in the<br />
past, and hence are un-testable, or occur at physical or temporal scales that inhibit direct observation.<br />
Below, we suggest ways in which student conceptions about geophysics can be used to alter<br />
instruction and engage students in deeper thinking (e.g., Libarkin & Stokes, in press).<br />
© 2011 National <strong>Earth</strong> Science Teachers Association. All Rights Reserved.
Page 30<br />
<strong>The</strong> <strong>Earth</strong> <strong>Scientist</strong><br />
Using student alternative conceptions in instruction<br />
Using knowledge about student alternative conceptions to help students uncover their own ideas<br />
may be the most powerful, and simple, use of conceptions research (Strike and Posner, 1992;<br />
diSessa, 2006; Aikenhead & Jegede, 1999). We suggest that encouraging students to draw, write, and<br />
talk about ideas is vital for encouraging students to evaluate and rethink their alternative conceptions.<br />
Teachers can utilize these techniques at the beginning of a school year, or during instruction<br />
as a way to introduce a new subject. By determining what students think prior to instruction,<br />
teachers will gain an understanding of their students’ strengths, as well as those areas that need to<br />
be addressed in order for students to grasp geophysics concepts. With this knowledge, teachers can<br />
tailor their instruction to build upon student strengths and address areas of difficulty.<br />
Figure 1. An example student<br />
drawing related to the structure<br />
of <strong>Earth</strong>’s interior. <strong>The</strong> student<br />
was prompted to draw a model<br />
of the <strong>Earth</strong>’s interior, including<br />
the source of lava. Drawings<br />
such as this can be used to<br />
scaffold to other ideas about<br />
geophysics. For example,<br />
placement of earthquake wave<br />
ray paths within the context<br />
of this model would either<br />
challenge the student’s model<br />
or provide additional insight into<br />
alternative conceptions about<br />
earthquakes.<br />
<strong>The</strong> approach used to encourage students to think deeply about their<br />
own ideas depends on student age, as many approaches that might be<br />
used for older students are inappropriate for students that are much<br />
younger. However, we have found that methods used with younger<br />
students are actually quite effective for use with older students, even<br />
those in advanced secondary or college courses. Ideas held by younger<br />
students, particularly those who are just beginning to write and read,<br />
can be illuminated through drawings (Fig. 1) and classroom discussion.<br />
In the geosciences, for example, drawings have been used across<br />
many age groups to investigate plate tectonic and related conceptions<br />
(e.g., Gobert, 2000; Sibley, 2005). We note that understanding how a<br />
scientist illustrates a concept is an important step to using student<br />
drawings to identify concepts that might need additional discussion<br />
in the classroom. Student drawings can be compared to scientific<br />
models, such as those available through the U.S. Geological Survey<br />
(e.g.., http://pubs.usgs.gov/gip/dynamic/dynamic.html). We also<br />
recommend asking a scientist to make a drawing for you. Overall, we<br />
have found that geologists are more than willing to assist us in classroom instruction or research by<br />
providing their own responses to the types of questions we generally ask students.<br />
Although drawings provide excellent opportunities for students to express their conceptual understanding,<br />
subsequent classroom discussion, one-on-one conversation, in-class questions (Fig. 2),<br />
or other opportunities for students to verbally explore their ideas gives both students and teachers<br />
insight into concepts that are difficult to understand. Verbal expression of ideas gives students the<br />
opportunity to learn from one another, and become more confident in their own knowledge as<br />
they use it to help a classmate. By posing questions to students in class, having them make predictions<br />
about geophysical processes, and allowing them to manipulate and/or collect geophysical<br />
data, students have the opportunity to challenge their own ideas and gather evidence that supports<br />
scientific thinking. A good example of an activity that provides students with the opportunity<br />
to construct their own knowledge is Sawyer’s “Discovering Plate Boundaries” activity (http://<br />
plateboundary.rice.edu/intro.html). This exercise provides students with opportunities to make<br />
predictions about where tectonic plate boundaries should occur, and to use geophysical and other<br />
evidence to reason to the plate tectonic model. In our own instruction with undergraduate nonmajors,<br />
we use this activity after first prompting students to draw pictures of tectonic plates and<br />
provide written explanations for plate tectonic phenomena. We follow the activity with additional<br />
probing about student ideas, giving us insight into concepts that might need additional attention.<br />
© 2011 National <strong>Earth</strong> Science Teachers Association. All Rights Reserved.
Volume XXVII, Issue 1<br />
Page 31<br />
Alignment with National Standards<br />
Although states maintain their own standards for K-12<br />
science education, national standards provide a relevant<br />
foundation for placing alternative conceptions in an instructional<br />
context. In Table 1, exemplar national standards have<br />
been aligned with alternative conceptions that have been<br />
identified in students through conceptions research, as<br />
described above. Bringing an awareness of these conceptions<br />
into the classroom can provide a bridge between scientific<br />
and students’ ideas, particularly when designing and delivering<br />
instruction.<br />
Conclusions<br />
Educators have the ability to design and implement effective<br />
instruction that accounts for the importance of students’<br />
prior knowledge in learning science. With an awareness of<br />
students’ alternative conceptions of gravity and magnetism,<br />
educators can guide students in thinking deeply about<br />
geophysical conceptions and work with students’ conceptual<br />
frameworks to facilitate student learning. Whether through<br />
use of challenging multiple-choice questions grounded in<br />
student conceptions, through student drawings and classroom<br />
discussion, or through other techniques, educators<br />
can use student ideas to improve their instructional practice.<br />
<strong>The</strong>se same methods can be used to assess student learning following instructional interventions<br />
that target specific concepts in geophysics.<br />
Table 1. Alignment between <strong>Earth</strong>-related national standards and research-based<br />
alternative conceptions in geophysics.<br />
Grade Level National Standard (AAAS, 2003) Example Alternative Conceptions<br />
K-2 Chunks of rocks come in many sizes and shapes,<br />
from boulders to grains of sand and even smaller.<br />
4C/P1<br />
3-5 Things on or near the earth are pulled toward it by<br />
the earth’s gravity. 4B/E1<br />
Rocks are heavy or dense; lighter materials<br />
cannot be rocks. Rocks form at <strong>Earth</strong>’s<br />
surface due to heating or air pressure.<br />
Alternative conceptions for cause of gravity<br />
include <strong>Earth</strong>’s rotation, magnetism, and<br />
planetary position.<br />
Figure 2. An example of a<br />
question that could be asked to<br />
generate class discussion with<br />
regard to gravity and magnetism.<br />
This particular question is part<br />
of the Geoscience Concept<br />
Inventory (GCI), which contains<br />
questions designed from<br />
common alternative conceptions<br />
held by freshman-level college<br />
students in non-science courses.<br />
Although the GCI was designed<br />
for this student population, the<br />
questions can be modified to<br />
align with student ideas common<br />
to middle and high school <strong>Earth</strong><br />
Science courses.<br />
6-8 Everything on or near the earth is pulled toward the<br />
earth’s center by gravitational force. 4B/M3<br />
6-8 …Mountains form as two continental plates, or an<br />
ocean plate and a continental plate, press together.<br />
4C/M12<br />
9-12 Scientific evidence indicates that some rock layers<br />
are several billion years old. 4C/H6<br />
<strong>The</strong> <strong>Earth</strong>’s magnetic core causes gravity.<br />
Mountains form from a build-up of pressure<br />
in <strong>Earth</strong>’s core.<br />
<strong>Earth</strong> formed exactly as it appears today.<br />
Radioactivity is something created by<br />
people.<br />
© 2011 National <strong>Earth</strong> Science Teachers Association. All Rights Reserved.
Page 32<br />
<strong>The</strong> <strong>Earth</strong> <strong>Scientist</strong><br />
References<br />
Aikenhead, G.S. & Jegede, O.J. (1999). Cross-cultural science education: a cognitive explanation of a cultural<br />
phenomenon. Journal of Research in Science Teaching, 36, 269-287.<br />
American Association for the Advancement of Science (AAAS). (1993). Benchmarks for Science Literacy. New<br />
York: Oxford University Press. http://www.project2061.org/publications/bsl/online/bolintro.htm<br />
Asghar, A.A., & Libarkin, J.C. (2010). Gravity, magnetism, and “down”: Non-physics college students’<br />
conceptions of gravity. <strong>The</strong> Science Educator, 19, 42-55.<br />
Blake, A. (2004). Helping young children to see what is relevant and why: supporting cognitive change in <strong>Earth</strong><br />
science using analogy. International Journal of Science Education, 26, 1855-1873.<br />
Dove, J.E. (1998). Students’ alternative conceptions in <strong>Earth</strong> science: a review of research and implications for<br />
teaching and learning. Research Papers in Education, 13, 183-202.<br />
Cheek, K.A. (2010). Commentary: A Summary and Analysis of Twenty-Seven Years of Geoscience Conceptions<br />
Research. Journal of Geoscience Education, 58, 122-134.<br />
diSessa, A. A. (2006). A history of conceptual change research: Threads and fault lines. In K. Sawyer (Ed.),<br />
Cambridge handbook of the learning sciences (pp. 265 – 282). Cambridge, England: Cambridge University<br />
Press.<br />
Gobert, J. (2000). A typology of causal models for plate tectonics: inferential power and barriers to<br />
understanding. International Journal of Science Education, 22, 937-977.<br />
Kavanagh, C., Agan, L., & Sneider, C. (2005). Learning about phases of the Moon and eclipses: A guide for<br />
teachers and curriculum developers. Astronomy Education Review, 4, 19-52.<br />
King, C. (2008). Geoscience Education: an overview. Studies in Science Education, 44, 187 – 222.<br />
King, C. (1992). <strong>The</strong> secrets of Plasticine balls and the structure of the <strong>Earth</strong>: Investigation through discussion.<br />
Physics Education, 37, 485-491.<br />
Libarkin, J.C., & Stokes, A., in press, <strong>The</strong> Moon Has No Gravity: Examples of Idea Mixing in Explanations of<br />
Physical Processes, Planet.<br />
Marques, L., & Thompson, D. (1997). Portuguese students’<br />
understanding at ages 10-11 and 14-15 of the origin and nature<br />
of the <strong>Earth</strong> and the development of life. Research in Science &<br />
Technological Education, 15, 2-22.<br />
Rakkapao, S., Arayathanitkul, K., & Pananont, P. (2009). Thai<br />
university student’s prior knowledge about P-wave generated<br />
particle motion. Journal of Geoscience Education, 57, 213-226.<br />
Sibley, D. (2005). Visual abilities and misconceptions about plate<br />
tectonics. Journal of Geoscience Education, 53, 471-477.<br />
Strike, K. A., & Posner, G. J. (1992). A revisionist theory of<br />
conceptual change. In R. Duschl & R. Hamilton (Eds.),<br />
Philosophy of Science, Cognitive Psychology, and Educational<br />
<strong>The</strong>ory and Practice (pp. 147-176). Albany, NY: SUNY.<br />
Your one-stop shop for marine<br />
science curriculum supplies.<br />
www.LeaveOnlyBubbles.com<br />
715-659-5427<br />
support@leaveonlybubbles.com<br />
Leave Only Bubbles is a subsidiary of “What If…?” Scientific, a teacherowned<br />
and operated earth science supply company founded in 1997.<br />
About the Authors<br />
Julie Libarkin (libarkin@msu.edu) is an Associate Professor<br />
of Geological Sciences and Science and Mathematics<br />
Education at Michigan State University, Department of<br />
Geological Sciences, 206 Natural Science, East Lansing,<br />
MI 48824.<br />
Emily Geraghty Ward (wardem@msu.edu) is a Research<br />
Associate in Geological Sciences and <strong>The</strong> Center for<br />
Research on College Science Teaching and Learning<br />
at Michigan State University, Department of Geological<br />
Sciences, 206 Natural Science, East Lansing, MI 48824 USA.<br />
© 2011 National <strong>Earth</strong> Science Teachers Association. All Rights Reserved.
Volume XXVII, Issue 1<br />
Page 33<br />
A Big Squeeze:<br />
Examining and Modeling Causes<br />
of Intraplate <strong>Earth</strong>quakes in the<br />
km <strong>Earth</strong> Science Classroom<br />
0 500<br />
Michael Hubenthal, Seth Stein and John Taber<br />
Abstract<br />
Recent research suggests that the mechanics of earthquakes that occur within plate<br />
boundaries, regions called intraplate seismic zones, require a significantly more complex<br />
model than at plate boundaries. <strong>The</strong> implications of this research are fueling both scientific<br />
and societal debates because scientific understanding of intraplate earthquakes has<br />
significant implications on hazard assessments for such regions. To help students develop<br />
a conceptual model of the underpinning phenomena of intraplate earthquakes, this article<br />
links our current understanding of intraplate seismicity to a physical model useful for<br />
classroom instruction.<br />
Introduction<br />
<strong>Earth</strong>quakes that occur within plate boundaries, called intraplate earthquakes, have long intrigued<br />
both students and educators. Classroom exploration of U.S. seismicity and hazards maps inevitably<br />
generates numerous questions from the learners regarding the New Madrid Seismic Zone (NMSZ).<br />
Unfortunately, many earth science teachers are not prepared to exploit this interest by discussing<br />
the ongoing debate regarding the seismic hazard in the region. Instead, they are likely to respond to<br />
such questions by stating only that these issues are not well understood. Such a response is likely<br />
the result of two factors; 1) many teachers lack adequate knowledge of the current understanding<br />
of intraplate seismic zones and 2) teachers lack adequate instructional tools to convey such content<br />
to students. To empower teachers, this article summarizes ideas about the mechanisms of intraplate<br />
seismic zones and links these to a physical model useful for exploring this phenomena and the<br />
debate surrounding it.<br />
Intraplate Seismic Zones: NMSZ as a Laboratory<br />
Harry Reid, following his investigation of the 1906 San Francisco earthquake, proposed what has<br />
become the commonly accepted explanation for earthquakes. His elastic rebound theory states that<br />
earthquakes occur when elastic strain builds up over time due to motion between the two sides<br />
of an active fault. This energy is stored elastically in rocks until eventually the stress on the fault<br />
exceeds its frictional strength. When this critical value is reached, accumulated elastic strain is<br />
released as the fault slips in an earthquake. This cycle then repeats to produce another earthquake<br />
on the fault. This idea is well established in plate boundary regions, where motion across faults<br />
© 2011 National <strong>Earth</strong> Science Teachers Association. All Rights Reserved.
Page 34<br />
<strong>The</strong> <strong>Earth</strong> <strong>Scientist</strong><br />
Figure 1. Left – GPS data across<br />
the San Andreas fault. This<br />
data shows the accumulation<br />
of elastic strain (Z.-K. Shen).<br />
Right – <strong>The</strong> <strong>Earth</strong>quake<br />
Machine Lite. By pulling the<br />
rubber band connected to the<br />
block with the paper building,<br />
this simple stick-slip model<br />
illustrates the accumulation and<br />
sudden release of elastic strain<br />
(Hubenthal et al, 2008).<br />
results from the constant motion of <strong>Earth</strong>’s tectonic plates. In the classroom the process can be<br />
beautifully shown by GPS data that record the accumulating strain, is relatively intuitive and<br />
comprehendible to students, and can be modeled with students (Figure 1).<br />
Figure 2. <strong>The</strong> New Madrid<br />
Seismic Zone (NMSZ). Locations<br />
of earthquakes between 1975<br />
and 2008 in and around the<br />
NMSZ.<br />
Figure 3. GPS data across the<br />
NMSZ. Successive GPS studies<br />
in the New Madrid area show<br />
that motion across the entire<br />
region is at best, very small. At<br />
this rate, 10,000 years would<br />
be required to accumulate<br />
enough slip for a magnitude 7<br />
earthquake, and a magnitude<br />
8 would require 100,000 years<br />
(Calais, 2010).<br />
However, when this notion is applied to intraplate<br />
earthquakes, the simplicity of the theory<br />
fails to adequately explain our observations.<br />
<strong>The</strong> NMSZ is an example of this incongruity<br />
(Figure 2). Here, large (magnitude 7+) earthquakes<br />
felt across the Midwest occurred in 1811<br />
and 1812, small earthquakes occur today, and<br />
the deformation of landforms and sediments (see<br />
About the Cover, page 6 of this issue) provide<br />
evidence of large earthquakes (magnitude 7 to<br />
8) over the past 4500 years (Tuttle et al., 2005;<br />
Stein, 2011). Viewed through the lens of the<br />
elastic rebound theory, one would expect to see<br />
strain building up for another large earthquake.<br />
However, a GPS study across the NMSZ in 1996<br />
failed to find such an accumulation (Newman<br />
et al., 1999). Successive studies since then have<br />
confirmed this surprising result with progressively higher precision (Figure 3). A recent analysis<br />
shows that present-day motions within 200 km of the NMSZ are indistinguishable from zero and<br />
less than 0.2 mm/yr or roughly the thickness of a piece of fishing line (Calais & Stein, 2009). Thus,<br />
the NMSZ appears, from the surface,<br />
to be deforming far more slowly than<br />
expected if large earthquakes are to<br />
continue to occur as they have in<br />
the past.<br />
<strong>The</strong> challenge is how to reconcile the<br />
discrepancy between this GPS data with<br />
the history of seismic activity in this<br />
region that continues on today. In one<br />
view, the ongoing seismicity is evidence<br />
that the processes that produced large<br />
© 2011 National <strong>Earth</strong> Science Teachers Association. All Rights Reserved.
Volume XXVII, Issue 1<br />
Page 35<br />
events in the past are still at work today. In this view, seemingly contradictory GPS observations<br />
are attributed to models that suggest that unlike in plate boundary settings, little deformation will<br />
occur across intraplate seismic zones. <strong>The</strong>se models propose that large events are either triggered<br />
by local driving forces such as sudden weakening of the crust or reflect continuing release of stress<br />
accumulated over times much longer than the past few thousand years (Smalley et al, 2005). If these<br />
models are correct, earthquakes similar to the 1811-1812 events can be expected with an average<br />
recurrence time of 500 years (Tuttle et al., 2002).<br />
An alternative explanation for the discrepancy suggests that the development of strain in intraplate<br />
seismic zones results from interactions among all the faults in the region. Although each fault<br />
behaves according to the elastic rebound theory, the faults together form a complex system that<br />
cannot be understood by merely considering behaviors of any individual fault. For example, a large<br />
earthquake on one fault might not only release stress on that fault, but would also change the stress<br />
on other segments of that fault or nearby faults. Furthermore, long periods of mechanical locking<br />
or clusters of repeated earthquakes on one fault could affect the loading rate on neighboring faults.<br />
<strong>The</strong> rate of strain accumulation on any given fault varies depending on the forces acting within<br />
the plate, the geometry of the fault system, and the response of both the faults and the material<br />
between them to stress. As a result, the locations of large earthquakes within intraplate systems<br />
might be expected to vary in space and time. In this view, the small earthquakes that occur today<br />
are more likely to be aftershocks of past large earthquakes than indicators of where future ones<br />
will occur.<br />
This hypothesis is illustrated by data from another intraplate seismic zone, the North China<br />
Seismic Zone. Here earthquakes have been recorded both historically by humans and in the<br />
deformation of landforms and sediments, with the historic record extending back to 1300A.D. In<br />
Figure 4 we see that the seismicity clusters on one region of faults, and then migrates both spatially<br />
and temporally in an unpredictable pattern to another region. Ultimately, no large (M>7) events<br />
ruptured the same fault segment twice during this time period.<br />
Figure 4. Seismicity in North<br />
China (1303 –2009). Note<br />
how the seismicity and<br />
large earthquakes cluster<br />
and migrate across the<br />
intraplate seismic zone as<br />
time progresses. Ultimately,<br />
no large (M>7) events<br />
ruptured the same fault<br />
segment twice during this<br />
time period. (adapted from<br />
Liu et al., 2011)<br />
© 2011 National <strong>Earth</strong> Science Teachers Association. All Rights Reserved.
Page 36<br />
<strong>The</strong> <strong>Earth</strong> <strong>Scientist</strong><br />
Representing Intraplate Seismic Systems in the Classroom<br />
As introduced previously, the scale of the mechanics of intraplate earthquakes, both spatially and<br />
temporally, is quite large. As a result such concepts are abstract for students. One strategy to aid in<br />
concept development is to connect learning concepts, the target, with familiar concepts, an analog<br />
that shares attributes with the target (Cawelti, 2004). This connection of target to analog occurs<br />
through a process of mapping, or identifying relevant attributes of both the target and the analog<br />
and defining a correspondence between the two. Ultimately, mapping enables learners to develop a<br />
mental model, or way of understanding the process under investigation, based on their own experience.<br />
Well-selected analogies also have an added benefit of having the power to interest and excite<br />
student learning (Harrison, 2002).<br />
R. Smalley of the University of Memphis has pointed out that the classic<br />
game Booby Trap TM functions in a way that is useful when conceptualizing<br />
intraplate systems. <strong>The</strong> game (Figure 5) consists of a spring loaded<br />
game board and small round playing pieces. <strong>The</strong> object of Booby Trap TM<br />
is to remove the most pieces from the board while causing the slider bar<br />
to move the least. To do this, players attempt to visually identify pieces<br />
that have the least stress on them. <strong>The</strong> challenge of the game stems from<br />
the complexity and geometry of stress transfer within the system and the<br />
inherent limitations of using visual resources to gauge “loading”. <strong>The</strong>se<br />
challenging elements make Booby Trap TM a model for thinking and<br />
learning about intraplate seismicity.<br />
Figure 5. Booby Trap TM . A<br />
1960’s era board game that can<br />
model the complex distribution<br />
of stress, both pre and post<br />
earthquake, across intraplate<br />
seismic zones.<br />
Learners are unlikely to have the background experiences and knowledge upon which to view the<br />
model from the same perspective as the instructor (Greca & Moreira, 2000). <strong>The</strong>refore, care and<br />
time must be taken to make the mapping explicit. In this case, we can think of the game board as an<br />
intraplate seismic zone spanning several thousand square kilometers. <strong>The</strong> borders between playing<br />
pieces represent the complex fault systems between crustal blocks. <strong>The</strong> game board’s spring loaded<br />
“tension bar” presses on the pieces, distributing stress across the playing pieces. This distribution<br />
of stress from a distant force is similar, albeit simpler, to <strong>Earth</strong>’s tectonic processes that slowly and<br />
steadily stress intraplate systems.<br />
Because <strong>Earth</strong> materials are elastic, rates of loading on the various fault segments within the intraplate<br />
seismic zone are variable. Over time, the accumulation of elastic strain on a fault segment<br />
within the region will exceed the frictional strength of the fault. Once this threshold is reached, the<br />
elastic strain in that area is released as an earthquake. We model this process by removing “loaded”<br />
pieces from the playing area. After a playing piece is removed the sudden forward movement of the<br />
tension bar represents the occurrence of an earthquake. As in <strong>Earth</strong>, stress is redistributed across<br />
the system following an “earthquake”. Frequently, the pattern of loading is difficult to predict; the<br />
loading of some pieces increases while other pieces remain the same or are left with little stress<br />
on them.<br />
Although Booby Trap TM functions in a way that maps nicely to <strong>Earth</strong> processes, it is a simplification<br />
of a complex <strong>Earth</strong> system. To fully interpret the model, the differences between the model<br />
and reality should also be emphasized. This is particularly important for high school students, who<br />
often think of physical models as copies of reality rather than representations (Grosslight et al.<br />
1991). For example, the model has a number of obvious shortcomings such as its scale and composition,<br />
and that the applied stress is unidirectional and essentially constant. In contrast, tectonic<br />
plates are extremely large, heterogeneous, and are loaded in complex ways that result in variations<br />
to the stress applied to any intraplate seismic zone.<br />
© 2011 National <strong>Earth</strong> Science Teachers Association. All Rights Reserved.
Volume XXVII, Issue 1<br />
Page 37<br />
Using the Model for Student Instruction<br />
<strong>The</strong> goal of this instruction is to encourage students’ development of a mental model for intraplate<br />
seismic zones that include the following elements:<br />
l<br />
l<br />
l<br />
Elastic rebound theory describes individual faults’ behavior and appears to adequately<br />
describe temporal and spatial patterns of seismicity across plate boundary regions.<br />
Intraplate seismic zones<br />
are more complex than plate boundaries and the elastic rebound theory applied to any individual<br />
fault appears inadequate to explain temporal and spatial patterns of seismicity,<br />
l<br />
l<br />
l<br />
may distribute stress and thus earthquakes across all the faults within the zone in a complex<br />
pattern that varies temporally.<br />
transfer stress within the system, following an earthquake, in a way that is difficult to predict<br />
It is unclear whether past locations of earthquakes are predictors of future events in intraplate<br />
seismic zones.<br />
To convey this content we propose an instructional sequence (Table 1) that begins with a game<br />
of Booby Trap TM . While seemly off topic, this step is important as it ensures that all students are<br />
familiar with the functioning of the analog. Next, we introduce the NMSZ and gauge student’s<br />
Table 1. Positioning Booby<br />
TrapTM instructionally. Use of<br />
the model is positioned within<br />
a learning cycle to maximize<br />
classroom impact.<br />
An online version of this<br />
table, with clickable links<br />
for resources, is available<br />
at http://www.iris.edu/hq/<br />
resource/booby_trap<br />
Learning Cycle Description Resources<br />
Prerequisite<br />
Instruction<br />
Introduce and explore elastic rebound theory as a mechanism<br />
for earthquakes<br />
• <strong>Earth</strong>quake Machine model<br />
• Elastic rebound animations<br />
• GPS data: both across the San Andreas boundary, and a<br />
more regional view of plate motions.<br />
Open<br />
Prior Knowledge<br />
Explore/Explain<br />
Have students play Booby TrapTM as class under flexcam or in<br />
small groups<br />
Introduce intraplate seismic zones by exploring and describing<br />
the following with your students<br />
• US Hazard Map<br />
• Description of 1811-1812 events<br />
• Paleoseismic record of historical earthquakes in NMSZ<br />
• Current seismicity in NMSZ<br />
Ask students to predict a mechanism for large earthquakes in<br />
this region and what they thing the current pattern of seismicity<br />
suggests for the future?<br />
• Introduce GPS data across the NMSZ and compare to student<br />
predictions.<br />
• Explore study of the North China Seismic Zone<br />
• Reintroduce the Booby TrapTM as a model with explicit<br />
mapping between target and analogy.<br />
• Lead guided discovery of Booby TrapTM<br />
Booby TrapTM is available online for ~ $15<br />
• U.S. Hazard Map<br />
• Map of NMSZ<br />
• Description of 1811-1812 events (including photos, eye<br />
witness accounts, earthquake summary, etc.)<br />
• Description of paleoseismic evidence<br />
• Current seismicity of the NMSZ<br />
• GPS data across the NMSZ<br />
• Example from North China Seismic Zone<br />
• Mapping of intraplate seismic zones to Booby TrapTM from<br />
this article<br />
Reflect<br />
Journal-write on their conception of the relationship between elastic rebound theory and intraplate earthquakes.<br />
Apply<br />
Assign Is the Midwest’s NMSZ a Serious Threat for student<br />
reading. Discuss in small groups.<br />
Page 17 of <strong>Earth</strong>quake Threat: Is the U.S. Ready for a Seismic<br />
Catastrophe? See additional readings below.<br />
Additional readings for teachers or students<br />
USGS Fact Sheet - <strong>Earth</strong>quake Hazard in the New Madrid Seismic Zone Remains a Concern<br />
USGS Fact Sheet - Hazard in the Heart Land<br />
Stein, S., Disaster Deferred: How New Science is Changing our View of <strong>Earth</strong>quake Hazards in the Midwest, Columbia University Press, 2010<br />
Billitteri, T. (2010). <strong>Earth</strong>quake Threat: Is the U.S. Ready for a Seismic Catastrophe? CQ Researcher, 20(14), 313-336.<br />
Nova Science Now - <strong>Earth</strong>quakes in the Midwest<br />
© 2011 National <strong>Earth</strong> Science Teachers Association. All Rights Reserved.
Page 38<br />
<strong>The</strong> <strong>Earth</strong> <strong>Scientist</strong><br />
prior knowledge by asking them to make predictions about the mechanics of the NMSZ and future<br />
seismicity. Based on a growing body of literature suggesting that guided discovery is more effective<br />
than pure discovery (e.g. Mayer, 2008) we elaborate on a series of prompts useful to encourage<br />
students’ exploration of the physical model. To further refine student’s mental models, students<br />
reflect on their understanding through journaling, with feedback from the instructor. <strong>The</strong> instruction<br />
concludes by encouraging students to read a one-page article on the scientific debate and<br />
applying their new knowledge through peer discussions. For brevity, the discussion below only<br />
expands on the guided inquiry with the model.<br />
Begin by randomly seating the colored pieces into the playing area. Gently release the slider so it<br />
applies stress to the pieces. Place the game under a flexcam or a webcam, projected onto a screen,<br />
so students can see the model. Next, based on the discussion in the previous section, identify the<br />
germane elements of Booby Trap TM and define how these elements correspond to intraplate seismic<br />
zones for the students.<br />
Ask students to think about stress distribution across the playing area. Will this be even or will<br />
some pieces be under more stress than others? To visualize the stress distribution in the system,<br />
ask volunteers to come up, examine the board (feeling pieces is allowable) and remove a piece that<br />
is unlikely to cause an earthquake. Repeat this until no “free” pieces remain. Now the complex web<br />
of stress is revealed across the playing area. Ask students to compare the web with their predictions<br />
prior to removing the pieces.<br />
Next, reset the board. This time, ask students to identify a piece they perceive as being most likely to<br />
cause the slider to move. Again ask for student volunteers to come up and pull out that piece while<br />
all students make the following observations:<br />
l<br />
l<br />
l<br />
l<br />
l<br />
l<br />
What happened when the piece was removed?<br />
Did it move a little or a lot? Was this motion more or less than you anticipated?<br />
How was the stress transferred to other nearby pieces?<br />
After the piece has been removed encourage the volunteer to examine or “feel” the stress in<br />
the pieces in the area where the block was removed.<br />
Has the stress been released from that area or is it still there? If there, has it increased or<br />
decreased?<br />
Are there other ways we could better measure stress than our eyes?<br />
Repeat this procedure until students have an adequate opportunity to see how the system behaves.<br />
Ask students if they could predict whether or not there will be stress on any particular piece in the<br />
area after another piece has been removed.<br />
This final question is analogous to the one currently facing scientists that study the NMSZ. We<br />
know there have been earthquakes in NMSZ in the past. We also have other examples that suggest<br />
that the stress doesn’t rebuild quickly on the same fault within intraplate seismic zones. Thus,<br />
the science community is currently debating the details of strain accumulation in NMSZ and the<br />
implication of this accumulation for how communities should balance resources spent preparing<br />
for earthquakes with other community needs. Using the resources identified in Table 1, readers are<br />
encouraged to explore the details of this ongoing debate for themselves and, depending on the level<br />
of your students, encourage them to learn more as well.<br />
© 2011 National <strong>Earth</strong> Science Teachers Association. All Rights Reserved.
Volume XXVII, Issue 1<br />
Page 39<br />
References<br />
Calais, E., & S. Stein (2009). Time-variable deformation in the New Madrid Seismic 217 Zone, Science,<br />
323(5920), 1442.<br />
Calais, E. (2010). New Madrid and surroundings - GPS Results. Retrieved from http://web.ics.purdue.<br />
edu/~ecalais/projects/noam/nmsz/ts/<br />
Cawelti, G., editor. (2004). Handbook of Research on Improving Student Achievement. Arlington, VA: Educational<br />
Research Service.<br />
Greca, I. M. & Moreira, M. A. (2000). Mental models, conceptual models, and modeling. International Journal of<br />
Science Education, 22(1), 1-11.<br />
Grosslight, L., Unger, C., Jay, E., & Smith, C.L. (1991). Understanding models and their use in science: Conceptions<br />
of middle and high school students and experts. Journal of Research in Science Teaching, 28, 799-822.<br />
Harrison a. (2002) Analogical Transfer - Interest is Just as Important as Conceptual Potential. Proceedings<br />
from the Australian Association for Research in Education. Brisbane, AU.<br />
Hubenthal, M., Braile, L., & Taber, J. (2008) Redefining earthquakes & the earthquake machine. <strong>The</strong> Science<br />
Teacher, 75(1), 32-36.<br />
Liu, M., S. Stein, & H. Wang (2011) 2000 years of migrating earthquakes in North China: How earthquakes in<br />
mid-continents differ from those at plate boundaries, Lithosphere, in press,<br />
Mayer, R. E. (2008). Learning and Instruction (2nd ed). Upper Saddle River, NJ: Pearson Merrill Prentice Hall.<br />
Newman, A., Stein, S., Weber, J., Engeln, J., Mao, A., & Dixon, T. (1999) Slow deformation and lower seismic<br />
hazard at the New Madrid Seismic Zone. Science, 284, 619–-621.<br />
Nussbaum, J., & Novick, N. (1982). Alternative frameworks, conceptual conflict,and accommodation: Toward<br />
a principled teaching strategy. Instructional Science, 11, 183-200.<br />
Smalley, R., Ellis, A., Paul, J., & Van Arsdale, R. (2005) Space geodetic evidence for rapid strain rates in the New<br />
Madrid seismic zone of central USA. Nature 435, 1088–1090.<br />
Stein, S.,(2010). Disaster Deferred: How New Science is Changing our View of <strong>Earth</strong>quake Hazards in the<br />
Midwest, Columbia University Press.<br />
Tuttle, M. P., Schweig, E., III, Campbell, J., Thomas, P. M., Sims, J. D., and Lafferty, R H., III, (2005). Evidence<br />
for New Madrid earthquakes in A.D. 300 and 2350 B.C., Seismological Research Letters, 76(4), 489-501.<br />
Tuttle, M. P., Schweig, E. S., Sims, J. D., Lafferty, R. H., Wolf, L. W., Haynes, M. L. (2002). <strong>The</strong> earthquake<br />
potential of the New Madrid seismic zone, Bulletin of the Seismological Society of America, 92(6), 2080-2089.<br />
About the<br />
Authors<br />
Michael Hubenthal<br />
(hubenth@iris.edu) is<br />
the Senior Education<br />
Specialist at the IRIS<br />
Consortium, 1200 New<br />
York Ave NW, Suite 800,<br />
Washington, DC 20005.<br />
Seth Stein (seth@earth.<br />
northwestern.edu) is the<br />
William Deering Professor<br />
in the Department of <strong>Earth</strong><br />
and Planetary Sciences at<br />
Northwestern University,<br />
1850 Campus Drive,<br />
Evanston, IL 60208.<br />
John Taber (taber@iris.<br />
edu) is the Education<br />
and Outreach Program<br />
Manager at the IRIS<br />
Consortium, 1200 New<br />
York Ave NW, Suite 800,<br />
Washington, DC 20005.<br />
Capture the Teachable Moment following an earthquake!<br />
IRIS Teachable Moments presentations capture that<br />
unplanned opportunity to bring knowledge, insight,<br />
and critical thinking to the classroom following a<br />
newsworthy earthquake. Each IRIS Teachable Moment:<br />
• Contains interpreted USGS regional tectonic<br />
maps and summaries, computer animations,<br />
seismograms, AP photos, and other event-specific<br />
information<br />
• Generated within hours of the event!<br />
• Prepared by seismologists and educators!<br />
• A classroom-ready product that can be customized!<br />
• Is pushed to you through notifications when new<br />
products are ready!<br />
To see the IRIS Teachable Moments for past events or to subscribe to receive notices for future events visit the Teachable Moments page:<br />
http://www.iris.edu/hq/retm<br />
© 2011 National <strong>Earth</strong> Science Teachers Association. All Rights Reserved.
Page 40<br />
<strong>The</strong> <strong>Earth</strong> <strong>Scientist</strong><br />
Thursday, March 10 8:00–9:00 AM<br />
Teaching <strong>Earth</strong> Science Content with iPods, Laptops & Portable Accelerometers<br />
Marriott San Francisco Marquis, Willow<br />
Explore a variety of strategies for using accelerometers in modern “gizmos” as a hook to teach<br />
students about seismic waves and earthquakes.<br />
Thursday, March 10 2:00–3:00 PM<br />
CONSORTIUM E&O PROGRAM<br />
Sessions at the 2011 NSTA National Conference<br />
Help Your Students Discover <strong>Earth</strong>’s Layered Interior with Seismic Data<br />
Marriott San Francisco Marquis, Willow<br />
Explore new discoveries about <strong>Earth</strong>’s dynamic interior. This activity allows students to<br />
discover or dispel the presence of <strong>Earth</strong>’s layers using seismic data.<br />
Friday, March 11 9:30–10:30 AM<br />
National <strong>Earth</strong> Science Teachers Association Geology Share-a-thon<br />
Moscone Center, Meeting Room 134<br />
Friday, March 11 9:30–10:30 AM<br />
Visualizing the Unviewable: Simple Models to Activate Your <strong>Earth</strong>quake<br />
Instruction<br />
Moscone Center, Meeting Room 220 & 222<br />
Explore a collection of simple physica models designed to aid in develping students’<br />
understanding of abstract earthquake related concepts<br />
Saturday, March 12 9:30–10:30 AM<br />
National <strong>Earth</strong> Science Teachers Association <strong>Earth</strong>quakes and<br />
Seismology Share-a-thon<br />
Moscone Center, Meeting Room 134<br />
Be sure to stop and see us at Booth #607<br />
Free posters, slinkys and other educational materials!<br />
© 2011 National <strong>Earth</strong> Science Teachers Association. All Rights Reserved.
Volume XXVII, Issue 1<br />
Page 41<br />
© 2011 National <strong>Earth</strong> Science Teachers Association. All Rights Reserved.
Page 42<br />
<strong>The</strong> <strong>Earth</strong> <strong>Scientist</strong><br />
<strong>The</strong> <strong>Earth</strong> <strong>Scientist</strong> (TES)<br />
MANUSCRIPT GUIDELINES<br />
NESTA encourages articles that provide exemplary state-of-the-art tested classroom activities and background science content<br />
relevant to K-12 classroom <strong>Earth</strong> and Space Science teachers.<br />
• Original material only; references must be properly cited according to APA style manual<br />
• Clean and concise writing style, spell checked and grammar checked<br />
• Demonstrates clear classroom relevance<br />
Format Specifications<br />
• Manuscripts should be submitted electronically – Microsoft Word (PC or Mac)<br />
• Length of manuscript should not exceed 2000 words.<br />
• All submissions must include a summary/abstract.<br />
• Photos and graphs: should be submitted as separate files, of excellent quality and in PDF, EPS, TIFF or JPEG format.<br />
300 dpi minimum resolution. Color or black and white are both accepted.<br />
– Photos/charts should not be embedded in the Word file. References to photo/chart placement may be made in the<br />
body of the article identified with some marker: or [Figure 1 in this area].<br />
• Figures should be numbered and include captions (Figure 1. XYZ.).<br />
– Captions may be included with photo/chart reference or at the end of the article.<br />
• If using pictures with people, a signed model release will be required for EACH individual whose face is recognizable.<br />
• Each article must include: author(s) names, the school/organizations, mailing address, home and work phone numbers<br />
(which will not be published), and e-mail addresses.<br />
Review<br />
Manuscripts are reviewed by the Editor for content and language. <strong>The</strong> Editor is responsible for final decisions on the publication<br />
of each manuscript. Manuscripts may be accepted as is, returned for minor or major revisions, or declined, based on the decision of<br />
the Editor. <strong>The</strong> Editor reserves the right to edit the manuscript for typographical or language usage errors.<br />
Page Charges<br />
A fee of $100 per page is charged to authors who have institutional, industrial, or grant funds available to pay publication costs.<br />
Authors without access to such funds are strongly urged to assist in defraying costs of publication to the extent their resources<br />
permit, but payment of page charges is not required from such authors. Payment of page charges has no bearing on the decision to<br />
accept or reject a manuscript.<br />
Copyright Transfer Waiver<br />
<strong>The</strong> lead author of the article shall submit a signed NESTA Copyright Transfer Waiver.<br />
<strong>The</strong> waiver form may be obtained from the NESTA web page. When completed AND signed it should be sent to the Editor. It may<br />
be sent as a printed original by US mail (address below), or as a pdf attachment via e-mail.<br />
We cannot begin the production process until this signed waiver has been received. Please help us to expedite the publication of<br />
your paper with your immediate compliance. If you have any questions, please e-mail the NESTA Editor or Executive Director as<br />
listed below.<br />
Submission Deadlines<br />
Issue Submission Mailing<br />
Deadline<br />
Date<br />
Spring January 15 March 1<br />
Summer April 15 June 1<br />
Fall July 15 September 1<br />
Winter October 31 January 1<br />
For further information contact:<br />
Tom Ervin, Editor<br />
tomervin@mchsi.com<br />
21799 282nd Avenue<br />
LeClaire, IA 52753<br />
Roberta M. Johnson, Executive Director<br />
rmjohnsn@gmail.com<br />
© 2011 National <strong>Earth</strong> Science Teachers Association. All Rights Reserved.
Volume XXVII, Issue 1<br />
Page 43<br />
Membership Information<br />
by Bruce Hall, Membership Coordinator<br />
RENEW OR UPDATE YOUR MEMBERSHIP INFORMATION<br />
Electronic renewal notices are now automatically e-mailed<br />
to each member. <strong>The</strong>y will be sent at 4, 2, and 1-week<br />
intervals before your membership expires. If you have not<br />
received a renewal notice please contact me.<br />
NESTA members can renew their membership and edit<br />
their Personal Information by going online.<br />
• Go to NESTA Home Page<br />
• Click on Member Login<br />
• Welcome to your User Account<br />
Complete Username and Password. If you do not<br />
know your password, click on the “Request new<br />
password” tab<br />
• MY NESTA – Here you will find your: Account<br />
settings and personal information (under Edit you<br />
can change your password)<br />
• Membeship Expiration Date<br />
• Renew Now<br />
If you do not wish to use a credit card, you<br />
can renew by check or money order. Click on<br />
Download Renew Membership application. Mail<br />
the completed form to the address indicated.<br />
Your expiration date is listed on the address label<br />
of <strong>The</strong> <strong>Earth</strong> <strong>Scientist</strong>.<br />
• If you wish further information regarding<br />
membership, please contact NESTA Membership<br />
Coordinator<br />
ADDRESS OR EMAIL CHANGES<br />
It is very important that we have your current address and<br />
email. To update your membership information<br />
1. Go to www.nestanet.org<br />
2. Click on LOG IN<br />
3. Welcome to NESTA Member Menu<br />
Edit your profile – please use this to update your<br />
information. It is very important that this information<br />
be current.<br />
MEMBERSHIP EXPIRATION<br />
You will be notified via email regarding your membership<br />
renewal.<br />
If you wish further information regarding membership,<br />
please contact Bruce Hall at brucehall42@gmail.com<br />
NESTA Dues Structure and<br />
Benefits<br />
Check or money order only please<br />
Domestic Full Membership – includes printed<br />
and online versions of <strong>The</strong> <strong>Earth</strong> <strong>Scientist</strong>,<br />
E-News, special e-mailings, access to memberonly<br />
sections of the website, and full voting<br />
privileges<br />
• One year - $20 • Three years - $55<br />
• Two years - $38<br />
E-Membership – includes all of the above<br />
except the printed version of <strong>The</strong> <strong>Earth</strong> <strong>Scientist</strong>.<br />
AVAILABLE ONLY THROUGH OUR WEB SITE<br />
WWW.NESTANET.ORG<br />
• One year - $10<br />
International Full Membership (available for<br />
Mexico and Canada only) – same benefits as<br />
Full Domestic Individual Membership<br />
• One year - $30 • Three years - $65<br />
• Two years - $48<br />
Individuals from countries other than Mexico<br />
and Canada may join as E-Members only<br />
Domestic Library Rate – includes print copies<br />
of <strong>The</strong> <strong>Earth</strong> <strong>Scientist</strong>, only, and does not include<br />
NESTA membership<br />
• One year - $40<br />
Join NESTA Today!<br />
www.nestanet.org<br />
Membership is for one, two, or three years. An expiration date will appear on your<br />
mailing label affixed to any NESTA mailings.<br />
Date_________________________________<br />
Name____________________________________________________________<br />
Address 1_________________________________________________________<br />
Address 2_________________________________________________________<br />
City__________________________________State__________ Zip_____________<br />
Home # (_____)____________________Work # (_____)______________________<br />
Email_____________________________________________________________<br />
(required; home email preferred)<br />
Please be aware that NESTA does not distribute your email address to any outside agency.<br />
Position___________________________________________________________<br />
Grade level(s)_______________________________________________________<br />
Subject area(s)______________________________________________________<br />
Academic major_____________________________________________________<br />
Mail to:<br />
NESTA MEMBERSHIP, PO BOX 2194, LIVERPOOL NY 13089-2194<br />
NESTA also offers online membership at www.nestanet.org/cms/content/JOIN<br />
© 2011 National <strong>Earth</strong> Science Teachers Association. All Rights Reserved.
NESTA Membership<br />
P.O. Box 2194<br />
Liverpool NY 13089-2194<br />
NON PROFIT ORG.<br />
U.S. POSTAGE<br />
PAID<br />
PERMIT #718<br />
SYRACUSE NY<br />
PLEASE INFORM US IF YOU ARE MOVING • CHANGE SERVICE REQUESTED<br />
Below: An IRIS field technician does a final check of a<br />
seismograph installed in a rural area of China, about<br />
100 km from Beijing, while a local village resident<br />
observes. This instrument is part of a cooperative<br />
project comparing intermediate period surface waves<br />
generated by long-source-duration mining explosions<br />
in China and Wyoming. You can find more on the project<br />
athttp://www.iris.edu/hq/gallery/photo/4157<br />
Photo by Chis Hayward.<br />
Founded in 1984 with support from the National Science Foundation,<br />
IRIS is a consortium of over 100 US universities. In partnership with its<br />
Member Institutions and the scientific community, IRIS manages and<br />
operates comprehensive, high-quality geophysical facilities that enable<br />
exciting discoveries in seismology and the <strong>Earth</strong> sciences. IRIS programs<br />
contribute to scholarly research, education, earthquake hazard mitigation,<br />
and the verification of a Comprehensive Test Ban Treaty.<br />
www.IRIS.edu<br />
Facilitate, Collaborate, Educate.