HYDRAGEL HEMOGLOBIN(E) K20
HYDRAGEL HEMOGLOBIN(E) K20 - Sebia Electrophoresis
HYDRAGEL HEMOGLOBIN(E) K20 - Sebia Electrophoresis
- No tags were found...

Create successful ePaper yourself
Turn your PDF publications into a flip-book with our unique Google optimized e-Paper software.
<strong>HYDRAGEL</strong> <strong>HEMOGLOBIN</strong>(E) <strong>K20</strong> - 2005/03<br />
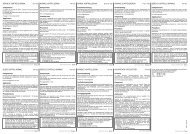
COMPONENTE MEDIA DS CV (%) MEDIA CV (%) Hb A 18.0 – 97.8 0.1 – 1.0 0.1 – 4.0 0.8 Hb F 13.3 – 76.3 0.5 – 0.6 0.7 – 3.4 1.8 Hb C 21.5 – 43.5 0.2 – 0.3 0.6 – 1.1 0.8 Hb S/D 9.7 – 84.1 0.1 – 0.6 0.4 – 2.6 1.1<br />
| Hb A 2<br />
| 2.2 – 5.7 | 0.1 – 0.2 | 2.3 – 7.6 | 4.0 |<br />
Accuratezza - Rilevamento delle Anomalie Emoglobiniche<br />
Utilizzando la metodica <strong>HYDRAGEL</strong> <strong>HEMOGLOBIN</strong>(E) <strong>K20</strong> ed un diverso sistema su gel di agarosio reperibile in commercio, sono stati analizzati<br />
63 campioni di sangue. I campioni di sangue e le loro valutazioni diagnostiche, sono stati forniti da un ospedale. Le diagnosi erano basate sui dati<br />
ottenuti da elettroforesi eseguite su gels acidi ed alcalini e/o da HPLC. Tutte le emoglobine anomale o i livelli alterati di emoglobine normali rilevate<br />
con <strong>HYDRAGEL</strong> <strong>HEMOGLOBIN</strong>(E) <strong>K20</strong>, sono risultati concordanti con il sistema su gel di comparazione, con i risultati e le diagnosi cliniche<br />
dell’ospedale. Non sono stati osservati casi di falsa positività, per esempio, il rilevamento di una frazione anomala o di un livello alterato di una frazione<br />
normale, dove non esistevano anormalità.<br />
Accuratezza - Determinazione Quantitativa della Hb A 2<br />
Utilizzando sia le letture densitometriche di elettroforesi ottenute con <strong>HYDRAGEL</strong> <strong>HEMOGLOBIN</strong>(E) <strong>K20</strong>, sia le letture con HPLC, sono stati misurati<br />
i livelli di Hb A 2<br />
in 51 campioni di sangue con valori normali ed elevati di Hb A 2<br />
. I valori misurati con le due tecniche sono stati analizzati con un test<br />
statistico di regressione lineare. I risultati della regressione lineare sono riportati in tabella (y = <strong>HYDRAGEL</strong>).<br />
| Coefficiente di correlazione | y- Intercetta | Pendenza | Variazione dei valori % |<br />
| | | | (sistema SEBIA) |<br />
| 0.973 | -0.344 | 0.963 | 1.5 – 5.7 |<br />
BIBLIOGRAFIA<br />
1. Fairbanks V.F., ed. (1980) Hemoglobinopathies and thalassemia: Laboratory methods and case studies. Brian C. Decker, New York.<br />
2. Galacteros F. (1986) Thalassémie, drépanocytose et autres hémoglobinopathies. Techniques et Biologie, 3, 174-178.<br />
3. Huisman T.H.J. and. Jonxis J.H.P (1977) The hemoglobinopathies: techniques of identification. Marcel Dekker, New York.<br />
4. Krauss J.S., Drew P.A., Jonah M.H., Trinh M., Shell S., Black L. and Baisden C.R. (1986) Densitometry and microchromatography compared for<br />
determination of the hemoglobin C and A 2<br />
proportions in hemoglobin C and hemoglobin SC disease and in hemoglobin C trait. Clin. Chem. 32, 5,<br />
860-863.<br />
5. Livingstone C. (1986) The hemoglobinopathies. Edit. London.<br />
6. Maier-Redelsberger M., Girot R. (1989) Diagnostic biologique des maladies de l’hémoglobine. Feuillets de biologie, 170.<br />
7. Schneider R.G. (1978) Methods for detection of hemoglobin variants and hemoglobinopathies in the routine clinical laboratory. CRC Crit. Rev. Clin.<br />
Lab. Sci. 9, 243-271.<br />
8. Vovan L., Lara-Russo D., Orsini A. (1985) Diagnostic biologique des hémoglobinoses. Ann. Pédiat. 32, 9, 780-789.<br />
- 35 -