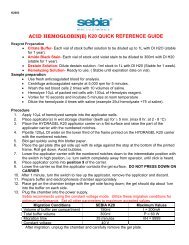
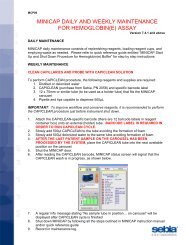
HYDRAGEL HEMOGLOBIN(E) K20
HYDRAGEL HEMOGLOBIN(E) K20 - Sebia Electrophoresis
HYDRAGEL HEMOGLOBIN(E) K20 - Sebia Electrophoresis
- No tags were found...

You also want an ePaper? Increase the reach of your titles
YUMPU automatically turns print PDFs into web optimized ePapers that Google loves.
<strong>HYDRAGEL</strong> <strong>HEMOGLOBIN</strong>(E) <strong>K20</strong> - 2005/03<br />
Interference and Limitations<br />
• Do not use hemolyzed blood samples.<br />
• When an abnormal hemoglobin is detected, which behaves differently than the major hemoglobin variants S, C, D and E, use other means of<br />
identification (e.g., isoelectric focusing, globin chain electrophoresis), or consult or send sample to a specialized laboratory.<br />
• The densitometric assay of Hb F (or of any other minor hemoglobin that migrates in the proximity of major fractions) is semi-quantitative as the<br />
values become inaccurate at below 2 % - 3 % of the total hemoglobin.<br />
• Some homozygous "S" subjects receive a "Hydrea"® (hydroxyurea) treatment that can induce synthesis of foetal hemoglobin. The mobility of the<br />
induced hemoglobin F on <strong>HYDRAGEL</strong> 7 <strong>HEMOGLOBIN</strong>(E) has been observed in some cases slightly different from the physiological hemoglobin F.<br />
• On samples stored more than 7 days, the smear located behind the Hb A fraction may become a concentrated fraction, do not interpret this fraction<br />
as an hemoglobin variant, e.g., H or Bart hemoglobins.<br />
Troubleshooting<br />
Call Technical Service of the supplier when the test fails to perform while the instruction for the preparation and storage of materials, and for the<br />
procedure were carefully followed.<br />
Kit reagent Safety Data Sheets and informations on waste products elimination are available from the Technical Service of the supplier.<br />
PERFORMANCE DATA<br />
All performance data are based on a study that included SEBIA <strong>HYDRAGEL</strong> materials and instruments compared to a commercially available agarose<br />
gel system. In addition, concordance studies were performed where the identity of hemoglobins and their values were established by other recognized<br />
methodologies. The results of representative examples of the performance studies are presented here.<br />
All electrophoregrams were interpreted visually. SEBIA’s HYRYS densitometer was used for all densitometric evaluations to complement the visual<br />
data as appropriate.<br />
Reproducibility Within Run<br />
Three blood samples were electrophoresed using <strong>HYDRAGEL</strong> <strong>HEMOGLOBIN</strong>(E) <strong>K20</strong> procedure on gels from the same lot. Each sample was run in<br />
all the tracks of a single gel. The following table shows the means, SD and CV for each individual hemoglobin component in the three samples<br />
calculated from the densitometric per cent values for each track. In addition, none of the repeats showed false positive or false negative values.<br />
| COMPONENT | MEAN | SD | CV (%) |<br />
Normal blood Hb A 97.4 0.1 0.1 Hb A 2<br />
| 2.6 | 0.1 | 5.3 |<br />
Elevated Hb A 2 Hb A 95.2 0.2 0.2 Hb A 2<br />
| 4.8 | 0.2 | 4.4 |<br />
Elevated Hb C Hb A 56.7 0.4 0.8 | Hb C | 43.3 | 0.4 | 1.0 |<br />
Reproducibility In Between Runs<br />
Blood samples were electrophoresed using <strong>HYDRAGEL</strong> <strong>HEMOGLOBIN</strong>(E) <strong>K20</strong> procedure on gels from a single lot. The samples analyzed included<br />
seven samples with an abnormal hemoglobin (Hb S, Hb F or Hb C), two samples with elevated Hb A 2<br />
and the rest were normal blood samples. The<br />
means, SD and CV were calculated from the data obtained for each component in each sample. Ranges of the means, SD and CV, and the mean CV<br />
representing the pool of individual components are tabulated below. In addition, none of the repeats showed false positive or false negative values.<br />
COMPONENT MEAN SD CV (%) MEAN CV (%) Hb A 18.0 – 97.8 0.1 – 1.0 0.1 – 4.0 0.8 Hb F 13.3 – 76.3 0.5 – 0.6 0.7 – 3.4 1.8 Hb C 21.5 – 43.5 0.2 – 0.3 0.6 – 1.1 0.8 Hb S/D 9.7 – 84.1 0.1 – 0.6 0.4 – 2.6 1.1<br />
| Hb A 2<br />
| 2.2 – 5.7 | 0.1 – 0.2 | 2.3 – 7.6 | 4.0 |<br />
Accuracy - Detection of Hemoglobin Abnormalities<br />
Sixty three different blood samples were analyzed using <strong>HYDRAGEL</strong> <strong>HEMOGLOBIN</strong>(E) <strong>K20</strong> procedure and another commercially available agarose<br />
gel system. The blood samples and their diagnostic assessment were provided by a hospital. The diagnosis was based on a routine alkaline gel and<br />
acid gel electrophoresis and/or HPLC. All abnormal hemoglobins or abnormal levels of normal hemoglobins detected with <strong>HYDRAGEL</strong><br />
<strong>HEMOGLOBIN</strong>(E) <strong>K20</strong> procedure were in agreement with the comparative gel system, hospital results and clinical diagnosis. There were no case<br />
observed of false positive, i.e., detection of an abnormal band or abnormal level of a normal band where no such abnormality existed.<br />
Accuracy - Quantitative Determination of Hb A 2<br />
The levels of Hb A 2<br />
were measured in 51 blood samples with normal and elevated levels of Hb A 2<br />
both by densitometry of the electrophoretic<br />
separations obtained using <strong>HYDRAGEL</strong> <strong>HEMOGLOBIN</strong>(E) <strong>K20</strong> procedure. The measured values from both procedures were analyzed by a linear<br />
regression statistical procedure. The results of linear regression analysis are tabulated below (y = <strong>HYDRAGEL</strong>).<br />
| Correlation Coefficient | y-Intercept | Slope | Range of % Values |<br />
| | | | (SEBIA’s system) |<br />
| 0.973 | -0.344 | 0.963 | 1.5 – 5.7 |<br />
- 13 -