

DEVELOPMENT
The pdf-version - Eesti Koostöö Kogu
The pdf-version - Eesti Koostöö Kogu

You also want an ePaper? Increase the reach of your titles
YUMPU automatically turns print PDFs into web optimized ePapers that Google loves.
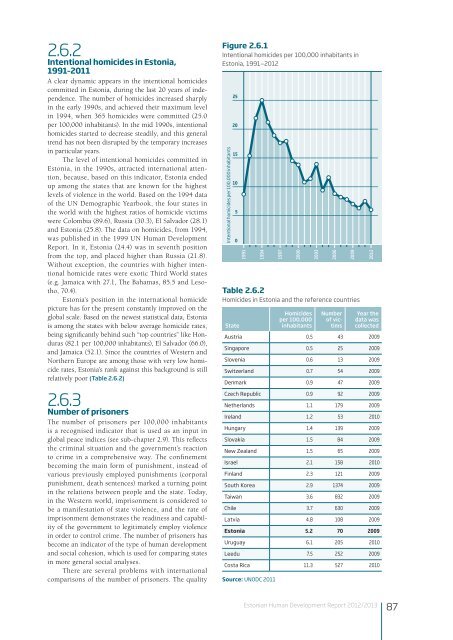
2.6.2<br />
Intentional homicides in Estonia,<br />
1991–2011<br />
A clear dynamic appears in the intentional homicides<br />
committed in Estonia, during the last 20 years of independence.<br />
The number of homicides increased sharply<br />
in the early 1990s, and achieved their maximum level<br />
in 1994, when 365 homicides were committed (25.0<br />
per 100,000 inhabitants). In the mid 1990s, intentional<br />
homicides started to decrease steadily, and this general<br />
trend has not been disrupted by the temporary increases<br />
in particular years.<br />
The level of intentional homicides committed in<br />
Estonia, in the 1990s, attracted international attention,<br />
because, based on this indicator, Estonia ended<br />
up among the states that are known for the highest<br />
levels of violence in the world. Based on the 1994 data<br />
of the UN Demographic Yearbook, the four states in<br />
the world with the highest ratios of homicide victims<br />
were Colombia (89.6), Russia (30.3), El Salvador (28.1)<br />
and Estonia (25.8). The data on homicides, from 1994,<br />
was published in the 1999 UN Human Development<br />
Report. In it, Estonia (24.4) was in seventh position<br />
from the top, and placed higher than Russia (21.8).<br />
Without exception, the countries with higher intentional<br />
homicide rates were exotic Third World states<br />
(e.g. Jamaica with 27.1, The Bahamas, 85.5 and Lesotho,<br />
70.4).<br />
Estonia’s position in the international homicide<br />
picture has for the present constantly improved on the<br />
global scale. Based on the newest statistical data, Estonia<br />
is among the states with below average homicide rates,<br />
being significantly behind such “top countries” like Honduras<br />
(82.1 per 100,000 inhabitants), El Salvador (66.0),<br />
and Jamaica (52.1). Since the countries of Western and<br />
Northern Europe are among those with very low homicide<br />
rates, Estonia’s rank against this background is still<br />
relatively poor (Table 2.6.2)<br />
2.6.3<br />
Number of prisoners<br />
The number of prisoners per 100,000 inhabitants<br />
is a recognised indicator that is used as an input in<br />
global peace indices (see sub-chapter 2.9). This reflects<br />
the criminal situation and the government’s reaction<br />
to crime in a comprehensive way. The confinement<br />
becoming the main form of punishment, instead of<br />
various previously employed punishments (corporal<br />
punishment, death sentences) marked a turning point<br />
in the relations between people and the state. Today,<br />
in the Western world, imprisonment is considered to<br />
be a manifestation of state violence, and the rate of<br />
imprisonment demonstrates the readiness and capability<br />
of the government to legitimately employ violence<br />
in order to control crime. The number of prisoners has<br />
become an indicator of the type of human development<br />
and social cohesion, which is used for comparing states<br />
in more general social analyses.<br />
There are several problems with international<br />
comparisons of the number of prisoners. The quality Source: UNODC 2011<br />
Figure 2.6.1<br />
Intentional homicides per 100,000 inhabitants in<br />
Estonia, 1991–2012<br />
Intentional homicides per 100,000 inhabitants<br />
25<br />
20<br />
15<br />
10<br />
5<br />
0<br />
Table 2.6.2<br />
Homicides in Estonia and the reference countries<br />
State<br />
1991<br />
1994<br />
1997<br />
2000<br />
Homicides<br />
per 100,000<br />
inhabitants<br />
2003<br />
2006<br />
Number<br />
of victims<br />
2009<br />
2012<br />
Year the<br />
data was<br />
collected<br />
Austria 0.5 43 2009<br />
Singapore 0.5 25 2009<br />
Slovenia 0.6 13 2009<br />
Switzerland 0.7 54 2009<br />
Denmark 0.9 47 2009<br />
Czech Republic 0.9 92 2009<br />
Netherlands 1.1 179 2009<br />
Ireland 1.2 53 2010<br />
Hungary 1.4 139 2009<br />
Slovakia 1.5 84 2009<br />
New Zealand 1.5 65 2009<br />
Israel 2.1 158 2010<br />
Finland 2.3 121 2009<br />
South Korea 2.9 1374 2009<br />
Taiwan 3.6 832 2009<br />
Chile 3.7 630 2009<br />
Latvia 4.8 108 2009<br />
Estonia 5.2 70 2009<br />
Uruguay 6.1 205 2010<br />
Leedu 7.5 252 2009<br />
Costa Rica 11.3 527 2010<br />
Estonian Human Development Report 2012/2013<br />
87


