

DEVELOPMENT
The pdf-version - Eesti Koostöö Kogu
The pdf-version - Eesti Koostöö Kogu

You also want an ePaper? Increase the reach of your titles
YUMPU automatically turns print PDFs into web optimized ePapers that Google loves.
are weakest include Estonia’s manufacturing industry,<br />
professional, scientific and technical activities (research<br />
and development, engineering activities, legal activities,<br />
etc.) and activities related to real estate, where our labour<br />
productivity level is only one third of the levels of most<br />
of the reference states. At the same time, manufacturing<br />
industry is considered to be the core of an economy that<br />
also creates demand in other fields of activity. And the<br />
experience of states with high income levels shows that<br />
states cannot reach very high income levels without passing<br />
through a stage in which manufacturing is a sector<br />
with very high productivity.<br />
4.4.4<br />
Level and dynamics of Estonia’s manufacturing<br />
industry<br />
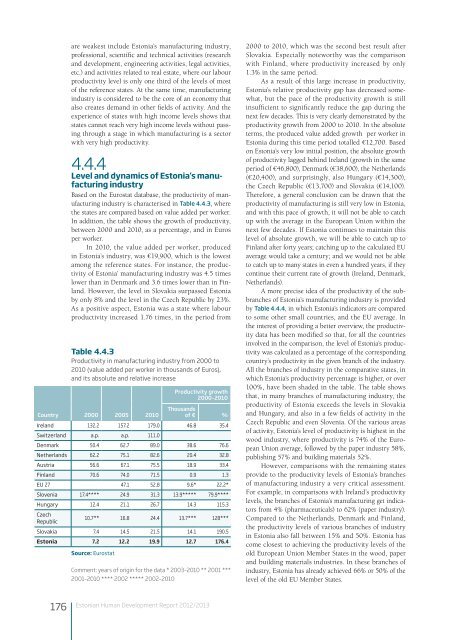
Based on the Eurostat database, the productivity of manufacturing<br />
industry is characterised in Table 4.4.3, where<br />
the states are compared based on value added per worker.<br />
In addition, the table shows the growth of productivity,<br />
between 2000 and 2010, as a percentage, and in Euros<br />
per worker.<br />
In 2010, the value added per worker, produced<br />
in Estonia’s industry, was €19,900, which is the lowest<br />
among the reference states. For instance, the productivity<br />
of Estonia’ manufacturing industry was 4.5 times<br />
lower than in Denmark and 3.6 times lower than in Finland.<br />
However, the level in Slovakia surpassed Estonia<br />
by only 8% and the level in the Czech Republic by 23%.<br />
As a positive aspect, Estonia was a state where labour<br />
productivity increased 1.76 times, in the period from<br />
Country 2000 2005 2010<br />
Productivity growth<br />
2000–2010<br />
Thousands<br />
of € %<br />
Ireland 132.2 157.2 179.0 46.8 35.4<br />
Switzerland a.p. a.p. 111.0<br />
Denmark 50.4 62.7 89.0 38.6 76.6<br />
Netherlands 62.2 75.1 82.6 20.4 32.8<br />
Austria 56.6 67.1 75.5 18.9 33.4<br />
Finland 70.6 74.0 71.5 0.9 1.3<br />
EU 27 47.1 52.8 9.6* 22.2*<br />
Slovenia 17.4**** 24.9 31.3 13.9***** 79.9****<br />
Hungary 12.4 21.1 26.7 14.3 115.3<br />
Czech<br />
Republic<br />
Table 4.4.3<br />
Productivity in manufacturing industry from 2000 to<br />
2010 (value added per worker in thousands of Euros),<br />
and its absolute and relative increase<br />
10.7** 16.8 24.4 13.7*** 128***<br />
Slovakia 7.4 14.5 21.5 14.1 190.5<br />
Estonia 7.2 12.2 19.9 12.7 176.4<br />
Source: Eurostat<br />
Comment: years of origin for the data * 2003–2010 ** 2001 ***<br />
2001–2010 **** 2002 ***** 2002–2010<br />
2000 to 2010, which was the second best result after<br />
Slovakia. Especially noteworthy was the comparison<br />
with Finland, where productivity increased by only<br />
1.3% in the same period.<br />
As a result of this large increase in productivity,<br />
Estonia’s relative productivity gap has decreased somewhat,<br />
but the pace of the productivity growth is still<br />
insufficient to significantly reduce the gap during the<br />
next few decades. This is very clearly demonstrated by the<br />
productivity growth from 2000 to 2010. In the absolute<br />
terms, the produced value added growth per worker in<br />
Estonia during this time period totalled €12,700. Based<br />
on Estonia’s very low initial position, the absolute growth<br />
of productivity lagged behind Ireland (growth in the same<br />
period of €46,800), Denmark (€38,600), the Netherlands<br />
(€20,400), and surprisingly, also Hungary (€14,300),<br />
the Czech Republic (€13,700) and Slovakia (€14,100).<br />
Therefore, a general conclusion can be drawn that the<br />
productivity of manufacturing is still very low in Estonia,<br />
and with this pace of growth, it will not be able to catch<br />
up with the average in the European Union within the<br />
next few decades. If Estonia continues to maintain this<br />
level of absolute growth, we will be able to catch up to<br />
Finland after forty years; catching up to the calculated EU<br />
average would take a century; and we would not be able<br />
to catch up to many states in even a hundred years, if they<br />
continue their current rate of growth (Ireland, Denmark,<br />
Netherlands).<br />
A more precise idea of the productivity of the subbranches<br />
of Estonia’s manufacturing industry is provided<br />
by Table 4.4.4, in which Estonia’s indicators are compared<br />
to some other small countries, and the EU average. In<br />
the interest of providing a better overview, the productivity<br />
data has been modified so that, for all the countries<br />
involved in the comparison, the level of Estonia’s productivity<br />
was calculated as a percentage of the corresponding<br />
country’s productivity in the given branch of the industry.<br />
All the branches of industry in the comparative states, in<br />
which Estonia’s productivity percentage is higher, or over<br />
100%, have been shaded in the table. The table shows<br />
that, in many branches of manufacturing industry, the<br />
productivity of Estonia exceeds the levels in Slovakia<br />
and Hungary, and also in a few fields of activity in the<br />
Czech Republic and even Slovenia. Of the various areas<br />
of activity, Estonia’s level of productivity is highest in the<br />
wood industry, where productivity is 74% of the European<br />
Union average, followed by the paper industry 58%,<br />
publishing 57% and building materials 52%.<br />
However, comparisons with the remaining states<br />
provide to the productivity levels of Estonia’s branches<br />
of manufacturing industry a very critical assessment.<br />
For example, in comparisons with Ireland’s productivity<br />
levels, the branches of Estonia’s manufacturing get indicators<br />
from 4% (pharmaceuticals) to 62% (paper industry).<br />
Compared to the Netherlands, Denmark and Finland,<br />
the productivity levels of various branches of industry<br />
in Estonia also fall between 15% and 50%. Estonia has<br />
come closest to achieving the productivity levels of the<br />
old European Union Member States in the wood, paper<br />
and building materials industries. In these branches of<br />
industry, Estonia has already achieved 66% or 50% of the<br />
level of the old EU Member States.<br />
176<br />
Estonian Human Development Report 2012/2013


