

DEVELOPMENT
The pdf-version - Eesti Koostöö Kogu
The pdf-version - Eesti Koostöö Kogu

Create successful ePaper yourself
Turn your PDF publications into a flip-book with our unique Google optimized e-Paper software.
and pasture land, and this was capitalised over a 25-year<br />
period at an adjusted rate of 4%.<br />
The value of the intangible capital is derived as the<br />
residual of the total value of wealth, which is calculated<br />
using the net present value (NPV) method. This is based<br />
on a principle that comes from the financial theory that<br />
the value of capital is equal to the income flow it creates<br />
in the future. If certain preconditions exist regarding<br />
the future income flow and discount rate, (which in the<br />
World Bank Report is used as the social rate of return<br />
on social investments) it is possible to evaluate the total<br />
value of wealth that its income flow will create. 8 Since,<br />
based on direct calculations, assessments of the value<br />
of tangible capital exist, which are derived from the difference<br />
between the total wealth and tangible capital, it<br />
is possible to obtain an assessment related to the value<br />
of the intangible capital. In principle, an assumption is<br />
made that the existence of various types of assets makes<br />
it possible to produce gross national income of a certain<br />
value, and from this gross value, the value of the assets<br />
is derived, which enables this national income to be<br />
produced. 9 On the other hand, relatively direct figures,<br />
which are based on market evaluations, exist for tangible<br />
assets. Since national income varies more than tangible<br />
capital (the value of produced and natural capital, incl.<br />
per capita) from state to state, it is easy to conclude that,<br />
generally, it is intangible capital that is important in the<br />
determination of a state’s standard of living. Based on<br />
the World Bank’s summary data, in the case of the lowincome<br />
states, 15% of wealth was related to produced<br />
capital and urban land, 30% to natural capital, and 55%<br />
to intangible capital, whereas the average wealth per<br />
capita, in 2005, was $6,523 per capita. In middle-income<br />
states, the corresponding proportions were 20%, 20% and<br />
60%, while the average wealth per capita was $30,662.<br />
In the high-income states, the corresponding proportions<br />
were 15%, 4% and 81%, while the average wealth per<br />
capita was $561,129 per capita (The Changing Wealth of<br />
Nations, 2011, 182-183).<br />
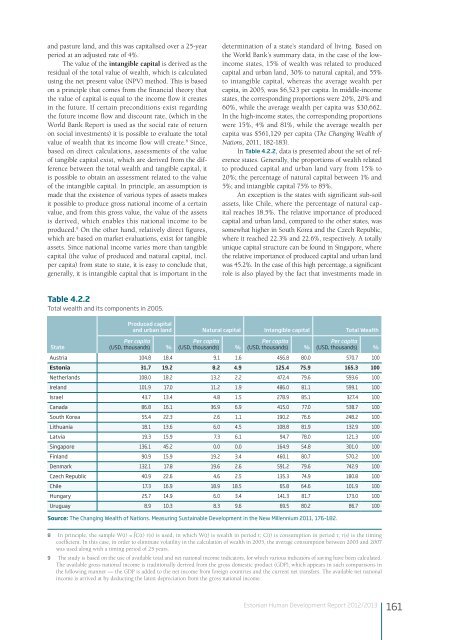
In Table 4.2.2, data is presented about the set of reference<br />
states. Generally, the proportions of wealth related<br />
to produced capital and urban land vary from 15% to<br />
20%; the percentage of natural capital between 1% and<br />
5%; and intangible capital 75% to 85%.<br />
An exception is the states with significant sub-soil<br />
assets, like Chile, where the percentage of natural capital<br />
reaches 18.5%. The relative importance of produced<br />
capital and urban land, compared to the other states, was<br />
somewhat higher in South Korea and the Czech Republic,<br />
where it reached 22.3% and 22.6%, respectively. A totally<br />
unique capital structure can be found in Singapore, where<br />
the rela tive importance of produced capital and urban land<br />
was 45.2%. In the case of this high percentage, a significant<br />
role is also played by the fact that investments made in<br />
Table 4.2.2<br />
Total wealth and its components in 2005.<br />
State<br />
Produced capital<br />
and urban land Natural capital Intangible capital Total Wealth<br />
Per capita<br />
(USD, thousands) %<br />
Per capita<br />
(USD, thousands) %<br />
Per capita<br />
(USD, thousands) %<br />
Per capita<br />
(USD, thousands) %<br />
Austria 104.8 18.4 9.1 1.6 456.8 80.0 570.7 100<br />
Estonia 31.7 19.2 8.2 4.9 125.4 75.9 165.3 100<br />
Netherlands 108.0 18.2 13.2 2.2 472.4 79.6 593.6 100<br />
Ireland 101.9 17.0 11.2 1.9 486.0 81.1 599.1 100<br />
Israel 43.7 13.4 4.8 1.5 278.9 85.1 327.4 100<br />
Canada 86.8 16.1 36.9 6.9 415.0 77.0 538.7 100<br />
South Korea 55.4 22.3 2.6 1.1 190.2 76.6 248.2 100<br />
Lithuania 18.1 13.6 6.0 4.5 108.8 81.9 132.9 100<br />
Latvia 19.3 15.9 7.3 6.1 94.7 78.0 121.3 100<br />
Singapore 136.1 45.2 0.0 0.0 164.9 54.8 301.0 100<br />
Finland 90.9 15.9 19.2 3.4 460.1 80.7 570.2 100<br />
Denmark 132.1 17.8 19.6 2.6 591.2 79.6 742.9 100<br />
Czech Republic 40.9 22.6 4.6 2.5 135.3 74.9 180.8 100<br />
Chile 17.3 16.9 18.9 18.5 65.8 64.6 101.9 100<br />
Hungary 25.7 14.9 6.0 3.4 141.3 81.7 173.0 100<br />
Uruguay 8.9 10.3 8.3 9.6 69.5 80.2 86.7 100<br />
Source: The Changing Wealth of Nations. Measuring Sustainable Development in the New Millennium 2011, 176–182.<br />
8 In principle, the sample W(t) = ∫C(t) r(s) is used, in which W(t) is wealth in period t; C(t) is consumption in period t; r(s) is the timing<br />
coefficient. In this case, in order to eliminate volatility in the calculation of wealth in 2005, the average consumption between 2003 and 2007<br />
was used along with a timing period of 25 years.<br />
9 The study is based on the use of available total and net national income indicators, for which various indicators of saving have been calculated.<br />
The available gross national income is traditionally derived from the gross domestic product (GDP), which appears in such comparisons in<br />
the following manner — the GDP is added to the net income from foreign countries and the current net transfers. The available net national<br />
income is arrived at by deducting the latest depreciation from the gross national income.<br />
Estonian Human Development Report 2012/2013<br />
161


