

DEVELOPMENT
The pdf-version - Eesti Koostöö Kogu
The pdf-version - Eesti Koostöö Kogu

Create successful ePaper yourself
Turn your PDF publications into a flip-book with our unique Google optimized e-Paper software.
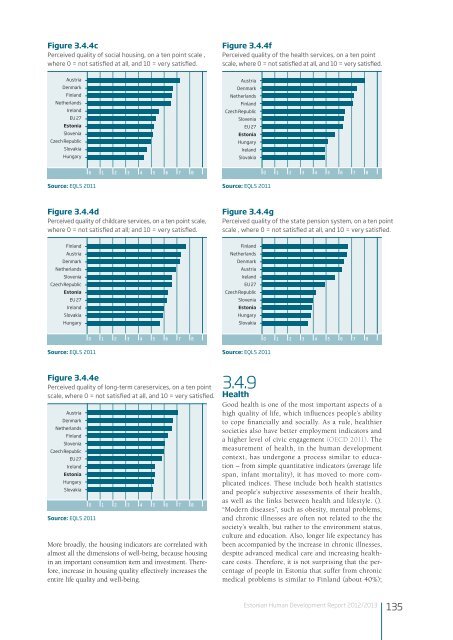
Figure 3.4.4c<br />
Perceived quality of social housing, on a ten point scale ,<br />
where 0 = not satisfied at all, and 10 = very satisfied.<br />
Figure 3.4.4f<br />
Perceived quality of the health services, on a ten point<br />
scale, where 0 = not satisfied at all, and 10 = very satisfied.<br />
Austria<br />
Denmark<br />
Finland<br />
Netherlands<br />
Ireland<br />
EU 27<br />
Estonia<br />
Slovenia<br />
Czech Republic<br />
Slovakia<br />
Hungary<br />
Austria<br />
Denmark<br />
Netherlands<br />
Finland<br />
Czech Republic<br />
Slovenia<br />
EU 27<br />
Estonia<br />
Hungary<br />
Ireland<br />
Slovakia<br />
0 1 2 3 4 5 6 7 8<br />
0 1 2 3 4 5 6 7 8<br />
Source: EQLS 2011 Source: EQLS 2011<br />
Figure 3.4.4d<br />
Perceived quality of childcare services, on a ten point scale,<br />
where 0 = not satisfied at all; and 10 = very satisfied.<br />
Figure 3.4.4g<br />
Perceived quality of the state pension system, on a ten point<br />
scale , where 0 = not satisfied at all, and 10 = very satisfied.<br />
Finland<br />
Austria<br />
Denmark<br />
Netherlands<br />
Slovenia<br />
Czech Republic<br />
Estonia<br />
EU 27<br />
Ireland<br />
Slovakia<br />
Hungary<br />
Finland<br />
Netherlands<br />
Denmark<br />
Austria<br />
Ireland<br />
EU 27<br />
Czech Republic<br />
Slovenia<br />
Estonia<br />
Hungary<br />
Slovakia<br />
Source: EQLS 2011<br />
0 1 2 3 4 5 6 7 8<br />
Source: EQLS 2011<br />
0 1 2 3 4 5 6 7 8<br />
Figure 3.4.4e<br />
Perceived quality of long-term careservices, on a ten point<br />
scale, where 0 = not satisfied at all, and 10 = very satisfied.<br />
Austria<br />
Denmark<br />
Netherlands<br />
Finland<br />
Slovenia<br />
Czech Republic<br />
EU 27<br />
Ireland<br />
Estonia<br />
Hungary<br />
Slovakia<br />
Source: EQLS 2011<br />
0 1 2 3 4 5 6 7 8<br />
More broadly, the housing indicators are correlated with<br />
almost all the dimensions of well-being, because housing<br />
in an important consumtion item and investment. Therefore,<br />
increase in housing quality effectively increases the<br />
entire life quality and well-being.<br />
3.4.9<br />
Health<br />
Good health is one of the most important aspects of a<br />
high quality of life, which influences people’s ability<br />
to cope financially and socially. As a rule, healthier<br />
societies also have better employment indicators and<br />
a higher level of civic engagement (OECD 2011). The<br />
measurement of health, in the human development<br />
context, has undergone a process similar to education<br />
– from simple quantitative indicators (average life<br />
span, infant mortality), it has moved to more complicated<br />
indices. These include both health statistics<br />
and people’s subjective assessments of their health,<br />
as well as the links between health and lifestyle. ().<br />
“Modern diseases”, such as obesity, mental problems,<br />
and chronic illnesses are often not related to the the<br />
society’s wealth, but rather to the environment status,<br />
culture and education. Also, longer life expectancy has<br />
been accompanied by the increase in chronic illnesses,<br />
despite advanced medical care and increasing healthcare<br />
costs. Therefore, it is not surprising that the percentage<br />
of people in Estonia that suffer from chronic<br />
medical problems is similar to Finland (about 40%);<br />
Estonian Human Development Report 2012/2013<br />
135


