

DEVELOPMENT
The pdf-version - Eesti Koostöö Kogu
The pdf-version - Eesti Koostöö Kogu

Create successful ePaper yourself
Turn your PDF publications into a flip-book with our unique Google optimized e-Paper software.
at about 70%. In Latvia and Lithuania, the proportion<br />
of satisfied people has increased during this period; if<br />
at the beginning of the century, slightly more than half<br />
of our southern neighbours were satisfied with life, currently,<br />
the percentage of satisfied people has reach about<br />
2/3 in both states.<br />
The European Foundation for the Improvement of<br />
Living and Working Conditions (Eurofound 2011) tries<br />
to measure life satisfaction along with happiness. The<br />
Eurofound question about happiness is formulated as<br />
follows: “Taking all things together, on a scale 1 to 10,<br />
how happy you would say you are? Here 1 means you<br />
are very unhappy and 10 means you are very happy.”<br />
The question about life satisfaction is the following: “All<br />
things concerned, how satisfied would you say you are<br />
with your life in these days? Please tell me on a scale of<br />
1 to 10, where 1 means very dissatisfied and 10 means<br />
very satisfied.”<br />
In Figure 3.3.1 it appears that in the case of most<br />
nations, the assessment of happiness is slightly higher<br />
than the assessment of satisfaction. And the gap between<br />
the assessments of satisfaction and happiness is greater,<br />
the lower the general life satisfaction level. Similarly<br />
to other researchers, the authors of this report also<br />
conclude that life satisfaction primarily reflects actual<br />
economic conditions and living standard; but the sense<br />
of happiness is connected to objective conditions more<br />
indirectly, and also includes a strong personal component,<br />
and is influenced by the cultural background.<br />
(Eurofound 2009).<br />
People’s assessments of their well-being are also<br />
used in many “combined” measures, of which, one of<br />
the most ambitious is the Happy Planet Index (HPI).<br />
This is compiled by the New Economics Foundation<br />
(NEF) (see http://www.neweconomics.org/). This think<br />
tank, which has operated in Great Britain since 1986,<br />
clearly contrasts itself with the dominant economic,<br />
environmental protection and social paradigm of the<br />
Western world. Among other things, the foundation<br />
focuses on such topics like eliminating the debt burden<br />
of developing countries, ethical commerce, and social<br />
investments, and they have tried to place pressure on<br />
the G8, etc. The foundation favours the introduction<br />
of new ways of viewing development and progress, by<br />
calling this sustainable well-being. In this context, they<br />
have also created the Happy Planet Index, which combines<br />
subjective well-being with life expectancy and the<br />
ecological footprint (HPI = Experienced Well-being x<br />
Life Expectancy/Ecological Footprint).<br />
The index value is increased by the number of<br />
happy years of life, but decreased by a large ecological<br />
footprint. In summary, the index value should allude to<br />
how successful the states have been in ensuring their<br />
populations good and happy lives, while also enabling<br />
the same for future generations. (The Happy ... 2012, 3).<br />
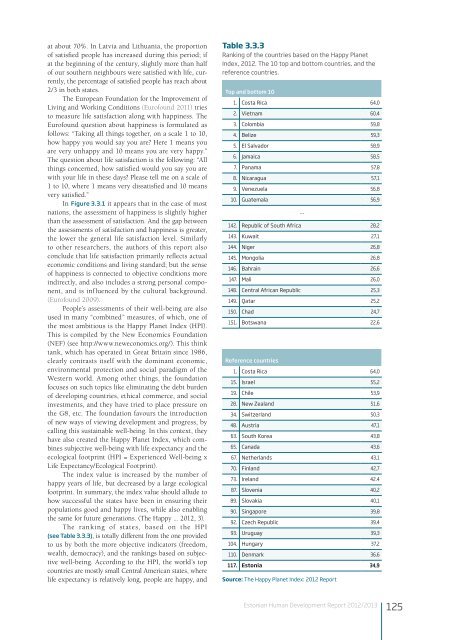
The ranking of states, based on the HPI<br />
(see Table 3.3.3), is totally different from the one provided<br />
to us by both the more objective indicators (freedom,<br />
wealth, democracy), and the rankings based on subjective<br />
well-being. According to the HPI, the world’s top<br />
countries are mostly small Central American states, where<br />
life expectancy is relatively long, people are happy, and<br />
Table 3.3.3<br />
Ranking of the countries based on the Happy Planet<br />
Index, 2012. The 10 top and bottom countries, and the<br />
reference countries.<br />
Top and bottom 10<br />
1. Costa Rica 64,0<br />
2. Vietnam 60,4<br />
3. Colombia 59,8<br />
4. Belize 59,3<br />
5. El Salvador 58,9<br />
6. Jamaica 58,5<br />
7. Panama 57,8<br />
8. Nicaragua 57,1<br />
9. Venezuela 56,8<br />
10. Guatemala 56,9<br />
...<br />
142. Republic of South Africa 28,2<br />
143. Kuwait 27,1<br />
144. Niger 26,8<br />
145. Mongolia 26,8<br />
146. Bahrain 26,6<br />
147. Mali 26,0<br />
148. Central African Republic 25,3<br />
149. Qatar 25,2<br />
150. Chad 24,7<br />
151. Botswana 22,6<br />
Reference countries<br />
1. Costa Rica 64,0<br />
15. Israel 55,2<br />
19. Chile 53,9<br />
28. New Zealand 51,6<br />
34. Switzerland 50,3<br />
48. Austria 47,1<br />
63. South Korea 43,8<br />
65. Canada 43,6<br />
67. Netherlands 43,1<br />
70. Finland 42,7<br />
73. Ireland 42.4<br />
87. Slovenia 40,2<br />
89. Slovakia 40,1<br />
90. Singapore 39,8<br />
92. Czech Republic 39,4<br />
93. Uruguay 39,3<br />
104. Hungary 37,2<br />
110. Denmark 36,6<br />
117. Estonia 34,9<br />
Source: The Happy Planet Index: 2012 Report<br />
Estonian Human Development Report 2012/2013<br />
125


