

DEVELOPMENT
The pdf-version - Eesti Koostöö Kogu
The pdf-version - Eesti Koostöö Kogu

Create successful ePaper yourself
Turn your PDF publications into a flip-book with our unique Google optimized e-Paper software.
118<br />
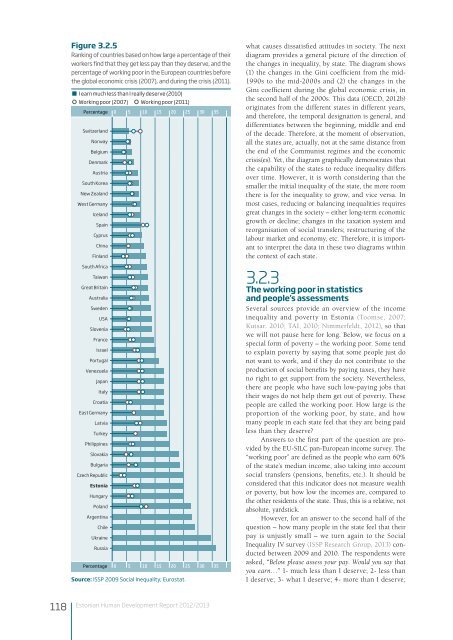
Figure 3.2.5<br />
Ranking of countries based on how large a percentage of their<br />
workers find that they get less pay than they deserve, and the<br />
percentage of working poor in the European countries before<br />
the global economic crisis (2007), and during the crisis (2011).<br />
I earn much less than I really deserve (2010)<br />
Working poor (2007) Working poor (2011)<br />
Percentage 0 5 10 15 20 25 30 35<br />
Switzerland<br />
Norway<br />
Belgium<br />
Denmark<br />
Austria<br />
South Korea<br />
New Zealand<br />
West Germany<br />
Iceland<br />
Spain<br />
Cyprus<br />
China<br />
Finland<br />
South Africa<br />
Taiwan<br />
Great Britain<br />
Australia<br />
Sweden<br />
USA<br />
Slovenia<br />
France<br />
Israel<br />
Portugal<br />
Venezuela<br />
Japan<br />
Italy<br />
Croatia<br />
East Germany<br />
Latvia<br />
Turkey<br />
Philippines<br />
Slovakia<br />
Bulgaria<br />
Czech Republic<br />
Estonia<br />
Hungary<br />
Poland<br />
Argentina<br />
Chile<br />
Ukraine<br />
Russia<br />
Percentage 0 5 10 15 20 25 30 35<br />
Source: ISSP 2009 Social Inequality; Eurostat.<br />
Estonian Human Development Report 2012/2013 what causes dissatisfied attitudes in society. The next<br />
diagram provides a general picture of the direction of<br />
the changes in inequality, by state. The diagram shows<br />
(1) the changes in the Gini coefficient from the mid-<br />
1990s to the mid-2000s and (2) the changes in the<br />
Gini coefficient during the global economic crisis, in<br />
the second half of the 2000s. This data (OECD, 2012b)<br />
originates from the different states in different years,<br />
and therefore, the temporal designation is general, and<br />
differentiates between the beginning, middle and end<br />
of the decade. Therefore, at the moment of observation,<br />
all the states are, actually, not at the same distance from<br />
the end of the Communist regimes and the economic<br />
crisis(es). Yet, the diagram graphically demonstrates that<br />
the capability of the states to reduce inequality differs<br />
over time. However, it is worth considering that the<br />
smaller the initial inequality of the state, the more room<br />
there is for the inequality to grow, and vice versa. In<br />
most cases, reducing or balancing inequalities requires<br />
great changes in the society – either long-term economic<br />
growth or decline; changes in the taxation system and<br />
reorganisation of social transfers; restructuring of the<br />
labour market and economy, etc. Therefore, it is important<br />
to interpret the data in these two diagrams within<br />
the context of each state.<br />
3.2.3<br />
The working poor in statistics<br />
and people’s assessments<br />
Several sources provide an overview of the income<br />
inequality and poverty in Estonia (Toomse, 2007;<br />
Kutsar. 2010; TAI, 2010; Nimmerfeldt, 2012), so that<br />
we will not pause here for long. Below, we focus on a<br />
special form of poverty – the working poor. Some tend<br />
to explain poverty by saying that some people just do<br />
not want to work, and if they do not contribute to the<br />
production of social benefits by paying taxes, they have<br />
no right to get support from the society. Nevertheless,<br />
there are people who have such low-paying jobs that<br />
their wages do not help them get out of poverty. These<br />
people are called the working poor. How large is the<br />
proportion of the working poor, by state, and how<br />
many people in each state feel that they are being paid<br />
less than they deserve?<br />
Answers to the first part of the question are provided<br />
by the EU-SILC pan-European income survey. The<br />
“working poor” are defined as the people who earn 60%<br />
of the state’s median income, also taking into account<br />
social transfers (pensions, benefits, etc.). It should be<br />
considered that this indicator does not measure wealth<br />
or poverty, but how low the incomes are, compared to<br />
the other residents of the state. Thus, this is a relative, not<br />
absolute, yardstick.<br />
However, for an answer to the second half of the<br />
question – how many people in the state feel that their<br />
pay is unjustly small – we turn again to the Social<br />
Inequality IV survey (ISSP Research Group, 2013) conducted<br />
between 2009 and 2010. The respondents were<br />
asked, “Below please assess your pay. Would you say that<br />
you earn…” 1- much less than I deserve; 2- less than<br />
I deserve; 3- what I deserve; 4- more than I deserve;


