

Estonian Human Development Report
Estonian Human Development Report - Eesti Koostöö Kogu
Estonian Human Development Report - Eesti Koostöö Kogu

You also want an ePaper? Increase the reach of your titles
YUMPU automatically turns print PDFs into web optimized ePapers that Google loves.
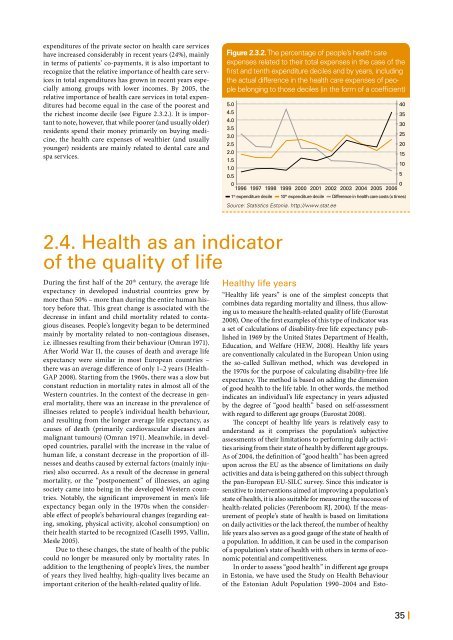
expenditures of the private sector on health care services<br />
have increased considerably in recent years (24%), mainly<br />
in terms of patients’ co-payments, it is also important to<br />
recognize that the relative importance of health care services<br />
in total expenditures has grown in recent years especially<br />
among groups with lower incomes. By 2005, the<br />
relative importance of health care services in total expenditures<br />
had become equal in the case of the poorest and<br />
the richest income decile (see Figure 2.3.2.). It is important<br />
to note, however, that while poorer (and usually older)<br />
residents spend their money primarily on buying medicine,<br />
the health care expenses of wealthier (and usually<br />
younger) residents are mainly related to dental care and<br />
spa services.<br />
Figure 2.3.2. The percentage of people’s health care<br />
expenses related to their total expenses in the case of the<br />
first and tenth expenditure deciles and by years, including<br />
the actual difference in the health care expenses of people<br />
belonging to those deciles (in the form of a coefficient)<br />
5.0<br />
4.5<br />
4.0<br />
3.5<br />
3.0<br />
2.5<br />
2.0<br />
15<br />
1.5<br />
10<br />
1.0<br />
0.5<br />
5<br />
0<br />
0<br />
1996 1997 1998 1999 2000 2001 2002 2003 2004 2005 2006<br />
1 st expenditure decile 10 th expenditure decile Difference in health care costs (x times)<br />
Source: Statistics Estonia. http://www.stat.ee<br />
40<br />
35<br />
30<br />
25<br />
20<br />
2.4. Health as an indicator<br />
of the quality of life<br />
During the first half of the 20 th century, the average life<br />
expectancy in developed industrial countries grew by<br />
more than 50% – more than during the entire human history<br />
before that. This great change is associated with the<br />
decrease in infant and child mortality related to contagious<br />
diseases. People’s longevity began to be determined<br />
mainly by mortality related to non-contagious diseases,<br />
i.e. illnesses resulting from their behaviour (Omran 1971).<br />
After World War II, the causes of death and average life<br />
expectancy were similar in most European countries –<br />
there was an average difference of only 1–2 years (Health-<br />
GAP 2008). Starting from the 1960s, there was a slow but<br />
constant reduction in mortality rates in almost all of the<br />
Western countries. In the context of the decrease in general<br />
mortality, there was an increase in the prevalence of<br />
illnesses related to people’s individual health behaviour,<br />
and resulting from the longer average life expectancy, as<br />
causes of death (primarily cardiovascular diseases and<br />
malignant tumours) (Omran 1971). Meanwhile, in developed<br />
countries, parallel with the increase in the value of<br />
human life, a constant decrease in the proportion of illnesses<br />
and deaths caused by external factors (mainly injuries)<br />
also occurred. As a result of the decrease in general<br />
mortality, or the “postponement” of illnesses, an aging<br />
society came into being in the developed Western countries.<br />
Notably, the significant improvement in men’s life<br />
expectancy began only in the 1970s when the considerable<br />
effect of people’s behavioural changes (regarding eating,<br />
smoking, physical activity, alcohol consumption) on<br />
their health started to be recognized (Caselli 1995, Vallin,<br />
Mesle 2005).<br />
Due to these changes, the state of health of the public<br />
could no longer be measured only by mortality rates. In<br />
addition to the lengthening of people’s lives, the number<br />
of years they lived healthy, high-quality lives became an<br />
important criterion of the health-related quality of life.<br />
Healthy life years<br />
“Healthy life years” is one of the simplest concepts that<br />
combines data regarding mortality and illness, thus allowing<br />
us to measure the health-related quality of life (Eurostat<br />
2008). One of the first examples of this type of indicator was<br />
a set of calculations of disability-free life expectancy published<br />
in 1969 by the United States Department of Health,<br />
Education, and Welfare (HEW, 2008). Healthy life years<br />
are conventionally calculated in the European Union using<br />
the so-called Sullivan method, which was developed in<br />
the 1970s for the purpose of calculating disability-free life<br />
expectancy. The method is based on adding the dimension<br />
of good health to the life table. In other words, the method<br />
indicates an individual’s life expectancy in years adjusted<br />
by the degree of “good health” based on self-assessment<br />
with regard to different age groups (Eurostat 2008).<br />
The concept of healthy life years is relatively easy to<br />
understand as it comprises the population’s subjective<br />
assessments of their limitations to performing daily activities<br />
arising from their state of health by different age groups.<br />
As of 2004, the definition of “good health” has been agreed<br />
upon across the EU as the absence of limitations on daily<br />
activities and data is being gathered on this subject through<br />
the pan-European EU-SILC survey. Since this indicator is<br />
sensitive to interventions aimed at improving a population’s<br />
state of health, it is also suitable for measuring the success of<br />
health-related policies (Perenboom RJ, 2004). If the measurement<br />
of people’s state of health is based on limitations<br />
on daily activities or the lack thereof, the number of healthy<br />
life years also serves as a good gauge of the state of health of<br />
a population. In addition, it can be used in the comparison<br />
of a population’s state of health with others in terms of economic<br />
potential and competitiveness.<br />
In order to assess “good health” in different age groups<br />
in Estonia, we have used the Study on Health Behaviour<br />
of the <strong>Estonian</strong> Adult Population 1990–2004 and Esto-<br />
35 |


