

Estonian Human Development Report
Estonian Human Development Report - Eesti Koostöö Kogu
Estonian Human Development Report - Eesti Koostöö Kogu

You also want an ePaper? Increase the reach of your titles
YUMPU automatically turns print PDFs into web optimized ePapers that Google loves.
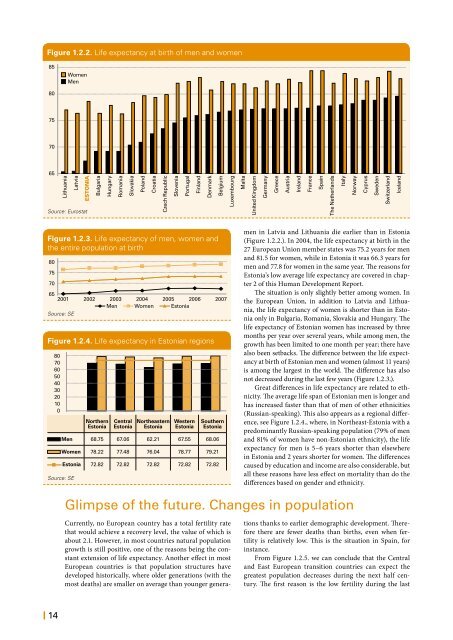
Figure 1.2.2. Life expectancy at birth of men and women<br />
85<br />
Women<br />
Men<br />
80<br />
75<br />
70<br />
65<br />
Lithuania<br />
Latvia<br />
Estonia<br />
Source: Eurostat<br />
Bulgaria<br />
Hungary<br />
Romania<br />
Slovakia<br />
Poland<br />
Croatia<br />
Czech Republic<br />
Slovenia<br />
Portugal<br />
Finland<br />
Denmark<br />
Belgium<br />
Luxembourg<br />
Malta<br />
United Kingdom<br />
Germany<br />
Greece<br />
Austria<br />
Ireland<br />
France<br />
Spain<br />
The Netherlands<br />
Italy<br />
Norway<br />
Cyprus<br />
Sweden<br />
Switzerland<br />
Iceland<br />
Figure 1.2.3. Life expectancy of men, women and<br />
the entire population at birth<br />
80<br />
75<br />
70<br />
65<br />
2001 2002 2003 2004 2005 2006 2007<br />
Men Women Estonia<br />
Source: SE<br />
Figure 1.2.4. Life expectancy in <strong>Estonian</strong> regions<br />
80<br />
70<br />
60<br />
50<br />
40<br />
30<br />
20<br />
10<br />
0<br />
Source: SE<br />
Northern<br />
Estonia<br />
Central<br />
Estonia<br />
Northeastern<br />
Estonia<br />
Western<br />
Estonia<br />
Southern<br />
Estonia<br />
Men 68.75 67.06 62.21 67.55 68.06<br />
Women 78.22 77.48 76.04 78.77 79.21<br />
Estonia 72.82 72.82 72.82 72.82 72.82<br />
men in Latvia and Lithuania die earlier than in Estonia<br />
(Figure 1.2.2.). In 2004, the life expectancy at birth in the<br />
27 European Union member states was 75.2 years for men<br />
and 81.5 for women, while in Estonia it was 66.3 years for<br />
men and 77.8 for women in the same year. The reasons for<br />
Estonia’s low average life expectancy are covered in chapter<br />
2 of this <strong>Human</strong> <strong>Development</strong> <strong>Report</strong>.<br />
The situation is only slightly better among women. In<br />
the European Union, in addition to Latvia and Lithuania,<br />
the life expectancy of women is shorter than in Estonia<br />
only in Bulgaria, Romania, Slovakia and Hungary. The<br />
life expectancy of <strong>Estonian</strong> women has increased by three<br />
months per year over several years, while among men, the<br />
growth has been limited to one month per year; there have<br />
also been setbacks. The difference between the life expectancy<br />
at birth of <strong>Estonian</strong> men and women (almost 11 years)<br />
is among the largest in the world. The difference has also<br />
not decreased during the last few years (Figure 1.2.3.).<br />
Great differences in life expectancy are related to ethnicity.<br />
The average life span of <strong>Estonian</strong> men is longer and<br />
has increased faster than that of men of other ethnicities<br />
(Russian-speaking). This also appears as a regional difference,<br />
see Figure 1.2.4., where, in Northeast-Estonia with a<br />
predominantly Russian-speaking population (79% of men<br />
and 81% of women have non-<strong>Estonian</strong> ethnicity), the life<br />
expectancy for men is 5–6 years shorter than elsewhere<br />
in Estonia and 2 years shorter for women. The differences<br />
caused by education and income are also considerable, but<br />
all these reasons have less effect on mortality than do the<br />
differences based on gender and ethnicity.<br />
Glimpse of the future. Changes in population<br />
Currently, no European country has a total fertility rate<br />
that would achieve a recovery level, the value of which is<br />
about 2.1. However, in most countries natural population<br />
growth is still positive, one of the reasons being the constant<br />
extension of life expectancy. Another effect in most<br />
European countries is that population structures have<br />
developed historically, where older generations (with the<br />
most deaths) are smaller on average than younger generations<br />
thanks to earlier demographic development. Therefore<br />
there are fewer deaths than births, even when fertility<br />
is relatively low. This is the situation in Spain, for<br />
instance.<br />
From Figure 1.2.5. we can conclude that the Central<br />
and East European transition countries can expect the<br />
greatest population decreases during the next half century.<br />
The first reason is the low fertility during the last<br />
| 14


