Small Enterprise Development Agency
Small Enterprise Development Agency - Seda
Small Enterprise Development Agency - Seda
- No tags were found...

You also want an ePaper? Increase the reach of your titles
YUMPU automatically turns print PDFs into web optimized ePapers that Google loves.
<strong>Small</strong> <strong>Enterprise</strong><br />
<strong>Development</strong><br />
<strong>Agency</strong><br />
Research on the Performance of the<br />
Agricultural Sector<br />
January 2012
Glossary<br />
SEDA<br />
<strong>Small</strong> <strong>Enterprise</strong> <strong>Development</strong> <strong>Agency</strong><br />
NPC<br />
National Planning Committee<br />
NGP<br />
National Growth Plan<br />
IPAP 2 Industrial Policy Action Plan 2<br />
SWOT<br />
Strengths, weaknesses, opportunities and<br />
threats<br />
PESTEL<br />
Political, economic, social, technological,<br />
environmental and legal factors<br />
1
Contents<br />
1 Key findings 6<br />
1.1 Background to the project 6<br />
1.2 Status quo analysis and short to medium term outlook: National 6<br />
1.2.1 Analysis of national situation 6<br />
1.2.2 Availability of supporting infrastructure 7<br />
1.2.3 Availability of water 8<br />
1.2.4 Electricity costs and supply 8<br />
1.2.5 Analysis of imported and exported commodities 8<br />
1.3 PESTEL and SWOT analysis of the agricultural sector 9<br />
1.3.1 Agricultural sector PESTEL analysis 9<br />
1.3.2 Sub-sector SWOT analysis 10<br />
1.4 Feedback from potential client surveys 13<br />
1.5 Identification of potential opportunities for intervention 15<br />
1.5.1 Interventions for small scale farmers 15<br />
1.5.2 Interventions for medium scale farmers 17<br />
1.6 Concluding remarks 19<br />
2 Background to the project 20<br />
2.1 Introduction 20<br />
2.2 Approach 21<br />
Phase 1: Project kick-off 21<br />
Phase 2: Desktop research 22<br />
Phase 3: Identification and categorisation 22<br />
Phase 4: Profiling of SEDA clients in the sector 24<br />
Phase 5: Preparation of draft and final report 25<br />
2.3 Report layout 25<br />
2.4 The role of SEDA in the agricultural sector 26<br />
2.5 Acknowledgements 26<br />
2.6 Disclaimer 26<br />
2.7 Limitations 26<br />
3 Status quo analysis and short to medium term forecast: National 28<br />
3.1 Analysis of national situation 28<br />
3.1.1 GDP contribution of the sector 30<br />
3.1.2 Employment in the sector 31<br />
3.1.3 National policy overview 32<br />
3.1.4 Analysis of ownership trends 36<br />
3.1.5 Analysis of financial stability 37<br />
2
3.1.6 Subsector analysis 45<br />
3.2 Availability of supporting infrastructure 52<br />
3.2.1 Availability of transport infrastructure 52<br />
3.2.2 Availability of water 54<br />
3.2.3 Electricity costs and supply 56<br />
3.3 Analysis of imported and exported agricultural commodities 59<br />
3.3.1 Exported commodities 59<br />
3.3.2 Imported commodities 61<br />
3.4 Future outlook for the sector 63<br />
3.4.1 Field crops 21 63<br />
3.4.2 Horticultural 65<br />
3.4.3 Animal 66<br />
4 Analysis of the provincial situation 68<br />
4.1 Provincial overview 68<br />
4.1.1 Eastern Cape 68<br />
4.1.2 Free State 74<br />
4.1.3 Gauteng 76<br />
4.1.4 Kwa-Zulu Natal 79<br />
4.1.5 Limpopo 84<br />
4.1.6 Mpumalanga 89<br />
4.1.7 Northern Cape 94<br />
4.1.8 North West Province 99<br />
4.1.9 Western Cape 102<br />
4.2 Provincial analysis of ownership trends 106<br />
4.3 Provincial Analysis of financial stability 107<br />
4.3.1 Capital expenditure 107<br />
4.3.2 Farming debt 110<br />
4.3.3 Market value of assets 111<br />
4.3.4 Losses 112<br />
4.3.5 Gross farming income 113<br />
4.4 Subsector analysis 115<br />
4.4.2 Horticultural products 123<br />
4.4.3 Animals and animal products 130<br />
5 Agricultural sector value chains 135<br />
5.1 Field crops 135<br />
5.1.1 Cereal value chain 135<br />
5.2 Horticultural products 136<br />
5.2.1 Citrus fruit value chain 136<br />
5.3 Animals and animal products 137<br />
5.3.1 Livestock value chain 137<br />
5.3.2 Red meat value chain 137<br />
5.3.3 Dairy farming value chain 138<br />
5.3.4 Beef market value chain 138<br />
3
5.4 Backward and forward economic linkages in the South African agricultural sector 138<br />
6 PESTEL and SWOT analysis of the agricultural sector 142<br />
6.1 Agricultural sector PESTEL analysis 142<br />
6.2 Sub-sector SWOT analysis 143<br />
6.2.1 Field crops 143<br />
6.2.2 Horticultural products 143<br />
6.2.3 Animals and animal products 145<br />
7 Feedback from potential client surveys 146<br />
7.1 Composition of respondents 146<br />
7.1.1 Composition based on type of respondent 146<br />
7.1.2 Composition based on service offering 146<br />
7.2 Are you aware of the role SEDA can play in the agricultural sector? 147<br />
7.3 To the best of your knowledge, do you know of existing incentives that farmers<br />
utilise? 148<br />
7.4 What, in your opinion, are the current challenges faced by small enterprises in the<br />
agricultural sector? 149<br />
7.5 In light of the challenges identified how do you think SEDA could become involved in<br />
dealing with these challenge? 150<br />
7.6 How could SEDA provide assistance in dealing with the challenges highlighted? 150<br />
7.7 In your opinion, what opportunities exist within the agricultural sector? 151<br />
7.8 How do you think SEDA can take advantage of these opportunities? 151<br />
8 Feedback from practitioner surveys 152<br />
8.1 Composition of respondents 152<br />
8.1.1 Composition by province 152<br />
8.1.2 Composition by key focus area 152<br />
8.2 What are the biggest day-to-day challenges faced by you as a SEDA practitioner? 153<br />
8.3 In what areas could SEDA assist the practitioner to improve the ability and<br />
efficiency? 153<br />
8.4 What are the biggest challenges faced the SEDA practitioner’s clients? 153<br />
8.5 Where can SEDA become involved when trying to deal with the challenges<br />
identified? 154<br />
9 Identification of potential opportunities and focus areas for<br />
interventions 155<br />
10 Concluding remarks 160<br />
4
Appendix 1 Linkages with relevant stakeholders 162<br />
5
1 Key findings<br />
1.1 Background to the project<br />
The agricultural sector’s contribution to South Africa’s Gross Domestic Product (GDP) declined<br />
gradually, over the past 10 years, from 2.7% in 2000 to 2.5% in 2010. However, despite agriculture’s<br />
reduced contribution to the country’s GDP, the sector remains vitally important to the South African<br />
economy. With 8.5 million people directly or indirectly dependant on agriculture for income and<br />
employment, it is a sector in need of robust initiatives and support.<br />
The New Growth Path (NGP) has highlighted the agriculture sector as a potential employment creator<br />
and one capable of achieving key development objectives, particularly through commercial farming<br />
and agro-processing initiatives. With the NGP targeting 300 000 households in smallholder schemes<br />
and 145 000 jobs in agro processing by 2020, SEDA has an important role to play in supporting small<br />
enterprises which will create many of these jobs<br />
In this light, KPMG conducted an extensive desktop research study of the agriculture sector in South<br />
Africa with the main objective being the identification of economic potential, and, in turn,<br />
opportunities for small enterprises and job-creation. The study aims to assess the current state of the<br />
agriculture sector in South Africa. In addition, this assessment examines the potential for the sector<br />
and the existence of any possible opportunities for small enterprises.<br />
1.2 Status quo analysis and short to medium term outlook:<br />
National<br />
1.2.1 Analysis of national situation<br />
The South African agriculture sector is characterised by diversity and incorporates crop production,<br />
horticulture, animal production, dairy farming, fish farming, and game farming. Only 12% of South<br />
Africa’s surface area is suitable for crop production with the biggest challenge being the availability of<br />
water. In economic terms, the sector comprises a highly developed commercial sub-sector geared<br />
towards export, as well as a smaller subsistence sector though there is much diversity and fluidity<br />
within these categorisations. South Africa remains a major exporter of agricultural produce and ranks<br />
highly on many products. It is currently the world’s leading producer of avocadoes, clementines, and<br />
ostrich products. Despite the dominance in these products, South Africa’s position as a major<br />
exporter is challenged by farming subsidies in the European Union and the United States, which are<br />
the country’s major export destinations.<br />
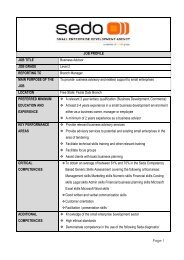
Agricultural production is widely distributed across the country owing to the environmental and<br />
climatic diversity of the country. Containing all seven climatic zones in one country, agricultural<br />
produce in South Africa ranges from summer and winter cereals to subtropical fruit and livestock. The<br />
diagram below illustrates this variety.<br />
6
Figure 1: Geographical distribution of agricultural activities across South Africa<br />
The global recession has not affected the local agriculture sector as much as expected. This is largely<br />
attributed to the fact that agricultural demand is relatively inelastic and therefore less vulnerable to<br />
economic conditions. Agricultural production actually grew by 13.7% between 2008 and 2009 to<br />
R126.3 billion. Nonetheless, the sector has been hit hard by rising input costs, particularly with animal<br />
feed, fuel, and fertilisers.<br />
Despite the agriculture sector’s small contribution to the South Africa economy (2.5% in 2010), it<br />
remains an important component of the national economy, with strong backward and forward<br />
linkages to other economic sectors.<br />
Employment however has declined considerably with the sector shedding 20% of its jobs between<br />
1988 and 1998. This was largely because of the casualisation of labour and the increased<br />
mechanisation of farming processes. Since 2008, the decline in employment has been more marked,<br />
because of the effects of the global recession. The decline in global trade and fluctuating exchange<br />
rates had a negative impact on the sector, as did the failure to implement fair trade policies around<br />
the world.<br />
1.2.2 Availability of supporting infrastructure<br />
South Africa’s transport infrastructure is modern and well developed when compared to other<br />
developing countries on the continent. The government highlighted the transport sector as one of the<br />
7
key contributors to South Africa’s competitiveness in global markets and it is increasingly crucial in<br />
driving economic growth and social development. The road and rail sub-sectors are vital in the<br />
transport of agricultural commodities on a regional level whilst airfreight and shipping’s role is limited<br />
to transporting time-sensitive agricultural products to and from international markets. The demand for<br />
rail and road freight grew by over 50% over the last 11 years however; the sector is unable to meet<br />
future demand due to dilapidated infrastructure. Given the importance of the transport sector, the<br />
government continues to identify areas of investment in transport infrastructure to meet the growing<br />
demand for logistic services. 1<br />
1.2.3 Availability of water<br />
Water is an essential resource to sustaining life and with no viable substitute, the topic of water<br />
security becomes vital. Water security is central to economic growth and development, energy<br />
generation and food security. Despite its various uses and essential role in an economy, the price of<br />
water does not reflect the underlying value that we derive from the resource. Food security is highly<br />
dependent on the availability and supply of water. Increasing pressure on the supply and availability of<br />
water will adversely influence the food security with the volatility in global food prices, over the past<br />
few years, testament to this.<br />
South Africa is currently classified as a ‘water stressed’ country due primarily to the country’s climatic<br />
conditions and human settlement patterns. The country’s relatively low annual rainfall and high<br />
evaporation rates result in only 8% of SA’s rainfall being converted to runoff, which places pressure<br />
on the nation’s water supply. The effects of climate change will directly affect water resources in<br />
South Africa and considering that the country is currently “water stressed,” this topic will be of<br />
particular importance in the future.<br />
In addition to the state of the country’s current water supply, there are also potential risks to future<br />
water availability and supply. South Africa’s water infrastructure is ageing and in a very poor condition<br />
due to current maintenance backlogs amounting to approximately R10 billion. Rand Water estimates<br />
that approximately 17% of all water is lost through leakages that are caused by eroded infrastructure.<br />
An inability to rectify these maintenance backlogs or upgrade the country’s water infrastructure could<br />
place significantly more pressure on water availability and supply.<br />
1.2.4 Electricity costs and supply<br />
Rising electricity prices will become a prominent feature of the South African economy due to the<br />
fundamental policy shift toward cost reflective pricing, in South Africa, to finance future capacity-build<br />
and maintenance programmes. The move toward cost reflective electricity pricing resulted in the<br />
Nation Energy Regulator of South Africa approving a set of increases between 2010 and 2013<br />
(MYPD2 period) which would almost double electricity tariffs over a 4 year period. Increasing<br />
electricity tariffs are likely to continue as Eskom estimates that the justifiable cost reflective tariff<br />
should be approximately 80-88c/kWh compared to the 2010 tariff of approximately 39c/kWh.<br />
The justifiable price “zone” is Eskom’s recommended tariff path, which will allow South Africa to<br />
complete economically whilst allowing the company to manage their future investment plans.<br />
Currently Eskom’s capacity will not be able to handle any additional demand beyond that experienced<br />
in 2007 and 2010. Given the government’s accelerated growth plans through IPAP2, future supply<br />
disruptions in energy intensive sectors could result in lower than expected growth. Eskom are in the<br />
process of implementing 2 base-load projects, namely the Medupi and Kusile power stations, to<br />
bolster future supply capacity and to meet the potential rise in electricity demand.<br />
1.2.5 Analysis of imported and exported commodities<br />
South Africa’s total agricultural exports increased by approximately 245% over a 13 year period<br />
translating to an average annual increase of 18.9%. Similarly, South Africa’s import rose by an<br />
1 www.southafrica,info/business/economy/infrastructure/transport.html<br />
8
estimated 290% over the same period with an annual growth rate of 22.3%. South Africa’s export<br />
trade levels rose significantly in 2008 as international consumer demand, particularly from Asia,<br />
elevated the demand for agricultural commodities. The effects of the global economic recession<br />
underline the constant levels of exported commodities between 2008 and 2010, as the demand for<br />
these commodities dwindled.<br />
The Netherlands became the country’s leading export destination for agricultural commodities in<br />
2010, overtaking the United Kingdom who held this position the previous year. The highest export<br />
growth markets are Mozambique, Japan, and the Netherlands with a growth rate of 41%, 18%, and<br />
12% respectively between 2009 and 2010. Angola, China and the UK comprise the country’s top 3<br />
shrinking export markets with an annual contraction in exports of 12%, 7% and 6% respectively.<br />
Argentina, Thailand, and Brazil are the countries primary import countries. However, their share of the<br />
country’s total agricultural imports declined by approximately 2%, for each country, between 2009<br />
and 2010. The highest import growth markets are the USA, Germany, and the UK with a growth rate<br />
of 35%, 17%, and 16% respectively between 2009 and 2010. Brazil, Netherlands, and Thailand<br />
comprise the country’s top 3 shrinking import markets with an annual contraction in imports of 24%,<br />
18% and 16% respectively.<br />
1.3 PESTEL and SWOT analysis of the agricultural sector<br />
1.3.1 Agricultural sector PESTEL analysis<br />
The section that follows identifies the political, economic, social, technological, environmental, and<br />
legal challenges affecting the agricultural sector.<br />
9
Figure 2: High-level PESTEL analysis for the agricultural sector<br />
Political<br />
•National focus on agrarian transformation, rural development,<br />
sustainable rural communities<br />
•IPAP2 policy focus on agro-processing, biofuels, forestry, paper<br />
and furniture<br />
•Backlogs in land restitution and lack of support to new land-owners<br />
•Focus on agriculture and rural development in the Provincial<br />
Growth nd <strong>Development</strong> Strategies<br />
•Nationally food-secure but 14% of South Africa's population is<br />
vulnerable to food insecurity<br />
Economic<br />
•Rising input costs particularly with seeds, animal feed, fertilisers<br />
and farming equipment<br />
•Increasing cost of electricity and inconsistent supply to remote<br />
rural areas<br />
•Seasonal nature of employment<br />
•Volatility in exchange rates<br />
•IPAP2 financial support to high-priority sectors<br />
•Lack of transport infrastructure in rural areas<br />
•Increased demand for food<br />
•Food inflation<br />
•Marginalisation of poor rural communities<br />
•Farming debt and lack of access to credit for small farmers<br />
Social<br />
•Migration out of rural areas reducing the agricultural workforce<br />
•Perception of agriculture as an unattractive sector<br />
•Consumption and buying paterns, e.g. the increased demand for<br />
organically grown foods<br />
•Levels of development in rural areas<br />
•Crime<br />
•HIV/AIDS<br />
•Availability of basic services such as health, education<br />
•Low levels of skill and skills development in the agricultural sector<br />
•Growing demand for holidays on game farms and lodges<br />
•Limited earning potential in rural areas<br />
Technological<br />
•Commercial farms opting for more high-tech equipment that is less<br />
labour intensive<br />
•Equipment hire is prohibitively high for small-scale farmers<br />
Environmental<br />
•Limited water supply in South Africa<br />
•Semi-arid conditions and effects of climate change increase<br />
vulnerability of agriculture<br />
•Historically unsustainable farming practices have casused<br />
environmental degradation<br />
•Interest in ecologically sustainable farming methods and use of<br />
alternative energy sources<br />
Legal<br />
•Stringent phyto-sanitary regulations imposed by the United States<br />
and European Union on imports of agricultural products<br />
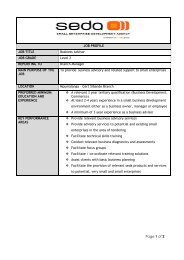
1.3.2 Sub-sector SWOT analysis<br />
The sub-sector SWOT analyses concentrates on three main divisions of the agricultural sector namely<br />
field crops, horticultural products, and animals/animal products. The sections that follow identify the<br />
general strengths, weaknesses, opportunities, and threats to these agricultural sub-sectors.<br />
10
1.3.2.1 Field crops<br />
Figure 3: SWOT analysis of field crop sub-sector<br />
Strengths<br />
•Maize is the primary food source for 80%<br />
of the country’s population and will<br />
maintain strong growth in future demand<br />
•We are one of a few countries that<br />
produces white maize with significant<br />
potential for export<br />
•Significant maize yield improvements due<br />
to stable production on irrigated land<br />
•Demand for maize is linked to rising<br />
demand in livestock as yellow maize is the<br />
main commodity in feed stock<br />
•Tobacco industry receives considerable<br />
interest from international countries due to<br />
the tobacco leaves we produce<br />
Weaknesses<br />
•Steady decline in planted area of maize<br />
•Farmers are financially constrained<br />
between planting and harvesting<br />
•Rising input costs for farmers<br />
•Volatile maize prices<br />
•Farmers are not cost competitive when<br />
compared to other sugar producing<br />
countries<br />
•Preferential trade agreements and high<br />
export tariffs for sugar farmers<br />
•Declining cotton prices and the perception<br />
that the industry is not profitable<br />
•Increased smoking laws, high tax rates<br />
and high input costs continues to deter<br />
demand for tobacco<br />
Opportunities<br />
•Creation of biodiesels will improve<br />
demand for oil seeds<br />
•Biodiesels has the potential to lower<br />
farmer’s input costs by using it to meet<br />
their energy requirements<br />
•Sugarcane-based renewable energy could<br />
assist Eskom with cogeneration of power<br />
•Cotton farming can create numerous jobs<br />
due to the labour intensive nature of the<br />
product<br />
•South African cotton is one of the world’s<br />
finest, in terms of impurities, and gives<br />
the country a distinct advantage<br />
•Tobacco sector and government<br />
partnership to help improve crop<br />
production levels and assist emerging<br />
farmers to enter the commercial space<br />
Threats<br />
•Rising prices of yellow maize places added<br />
pressure on the animal feed sector<br />
•Maize exports need to be monitored to<br />
ensure that domestic demand is met<br />
•Reducing profit margins for farmers may<br />
result in a reduction in production to<br />
remain profitable<br />
•Competition from cheaper imports may<br />
hurt the domestic production market<br />
•Major sugar producing nations subsidise<br />
the production of sugar with the<br />
overproduction eroding the global price of<br />
sugar<br />
•Crop diseases can severely affect farmer’s<br />
production levels and profitability<br />
11
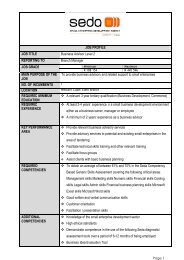
1.3.2.2 Horticultural products<br />
Figure 4: SWOT analysis of horticulture sub-sector<br />
Strengths<br />
•The climatic diversity of the country is<br />
suitable for the cultivation of a wide<br />
variety of fruits and vegetables<br />
•Citrus industry is export-orientated and SA<br />
is firmly established as one of the leading<br />
citrus producers in the world.<br />
Infrastructure and climate is suited to<br />
maintaining this position<br />
•Off-season production suites the<br />
European market and ensures demand for<br />
South African fruit<br />
Weaknesses<br />
•<strong>Small</strong>-scale fruit and vegetable farmers do<br />
not have sufficient access to credit,<br />
transport and storage infrastructure and<br />
markets - difficult to participate in<br />
commercial agriculture<br />
•<strong>Small</strong>-scale farmers lack access to<br />
advance farming technologies thus<br />
reducing their global competitiveness<br />
•The subtropical fruit industry is costintensive<br />
and requires high levels of<br />
investment required during non-bearing<br />
seasons<br />
Opportunities<br />
•Asia and the Middle East are forecast to<br />
become major market sfor South African<br />
table grapes<br />
•Niche markets for rooibos and honeybush<br />
tea as well as for essential oils set to<br />
increase especially as people get more<br />
health-conscious<br />
•Increasing demand for organic ally grown<br />
fruits and vegetables<br />
•Growing market for ornamental and cut<br />
flowers<br />
•Rising input costs<br />
Threats<br />
•Fruit and vegetable farmers are particularly<br />
prone to pests and diseases<br />
•The citrus industry does face serious<br />
international compeition and farmers will<br />
need to become increasingly costcompetitive<br />
12
1.3.2.3 Animals and animal products<br />
Figure 5: Swot analysis of livestock and animal product sub-sector<br />
Strengths<br />
•Livestock farming comprises 40% of the<br />
country’s agricultural output and is a major<br />
component of the sector<br />
•Approximately 80% of agricultural farm<br />
land can be used for the farming of<br />
livestock and as such farmers combine<br />
livestock and crop farming<br />
•Poultry is fast growing convenience food<br />
and has healthy future demand<br />
•MAFISA and Khula <strong>Enterprise</strong> Finance are<br />
currently assisting small-scale farmers<br />
with financing issues<br />
Weaknesses<br />
•Weak demand at present due to the<br />
effects of the global financial crisis<br />
•Net importer of red meat and with<br />
potential rise in demand<br />
•<strong>Small</strong>-scale farmers do not possess the<br />
relevant research and market information<br />
necessary to commercialise their products<br />
•Backlogs of financing through financing<br />
institutions<br />
•Financing options provided to small-scale<br />
farmers are not viable with high interest<br />
rates and repayments deterring growth<br />
Opportunities<br />
•Communal farming has the potential to<br />
assist local producers in satisfying<br />
domestic demand<br />
•Training of emerging and communal<br />
farmers to combat diseases<br />
•Access to viable and affordable financing<br />
options<br />
•Providing small-scale farmers with the<br />
technical skills and information to tap into<br />
the commercial markets<br />
Threats<br />
•Influx of cheap poultry will reduce<br />
production levels for local producers<br />
•Rising feed prices are likely to affect local<br />
producer costs<br />
•Avian flu could deter growth in the<br />
industry and would affect both poultry and<br />
ostriches<br />
•Foot and mouth disease is a major<br />
hindrance to small-scale farmers<br />
1.4 Feedback from potential client surveys<br />
1.4.1 Potential client survey<br />
The KPMG team conducted a survey of agriculture sector stakeholders in order to elicit information<br />
on where SEDA can intervene and what services and products it can develop to assist small and<br />
medium enterprises. Eighty-seven agricultural institutions were indentified during the preparatory<br />
phase of the project through research and internal KPMG networks. At the end of the phase, 18<br />
respondents submitted completed questionnaires. Given the time of year and the voluntary nature of<br />
the survey, we believe this to be a positive response rate.<br />
Respondents for the survey were drawn from a wide variety of institutions covering industry<br />
associations, farmers, academic institutions, and financial bodies. In terms of awareness, just under<br />
two-thirds of respondents were away of the role that SEDA can play in the agricultural sector with<br />
44% of respondents aware of existing incentives that farmers can utilise in the sector. Respondents<br />
13
perceived the most serious challenges for small and medium enterprises to be lack of access to<br />
finance, lack of access to land, the high cost of doing business and the lack of research and<br />
technology information networks.<br />
When asked about what SEDA can do to assist in dealing with these challenges, the overwhelming<br />
response was for SEDA to form strategic partnerships with finance institutions and academic and<br />
scientific bodies to broker access to SEDA clients.<br />
1.4.2 Practitioner survey<br />
As an additional value-add to the project, the KPMG team also spoke to SEDA practitioners operating<br />
around the country. The objective of the survey was to gain an understanding of the challenges<br />
facing potential SEDA clients, as observed by SEDA practitioners. The practitioners were also<br />
questioned about challenges they encountered during the course of their work. In addition, they were<br />
asked about what they would require to perform their jobs more effectively.<br />
The respondents were located across South Africa and covered a wide range of service areas<br />
including, SMME development, business development, cooperatives, and technical support.<br />
When asked about the major challenges faced while as SEDA practitioners, the most common<br />
responses were excessive administrative processes, lack of skills and difficulties in assisting clients<br />
gain access to finance and markets.<br />
When questioned about the challenges facing SEDA clients, their responses mirrored those of the<br />
potential clients and the main issues highlighted were access to finance and lack of skills.<br />
14
1.5 Identification of potential opportunities for intervention<br />
1.5.1 Interventions for small scale farmers<br />
Short term<br />
Medium Term<br />
Long term<br />
<strong>Small</strong> scale farmers<br />
• SEDA could facilitate interactions with smallscale<br />
logistic businesses to assist these farmers<br />
in getting their produce to local markets.<br />
• SEDA can facilitate interactions between financial<br />
institutions and small and medium scale farmers<br />
to negotiate affordable loan agreements.<br />
• SEDA can facilitate workshops between financial<br />
institutions and small and medium scale farmers<br />
to develop their financial management skills and<br />
learn to better manage their financial cash flow<br />
• Although some areas may not be used for crop<br />
farming, the land could be used to rear animals.<br />
This presents an area of opportunity for SEDA to<br />
facilitate training for these farmers to be able to<br />
diversify their products and enter the animal and<br />
animal products sector.<br />
• SEDA can facilitate interactions between<br />
commercial farmers and small and medium scale<br />
farmers to collaborate and irrigate unused land<br />
for the mutual benefit of both parties.<br />
• SEDA could facilitate interactions between<br />
businesses specialising in water storage facilities<br />
and small and medium scale farmers. This would<br />
allow farmers to sustain their water requirements<br />
in the event that there is an inadequate supply to<br />
their farms.<br />
• SEDA could assist small and medium scale<br />
farmers in researching methods for generating<br />
alternative energy through their agricultural<br />
• SEDA could facilitate agreements with medium and<br />
large-scale commercial farmers to assist small<br />
farmers in the logistical distribution of their<br />
products.<br />
• SEDA can facilitate training and assistance with the<br />
procedures required for products to be ready for<br />
market.<br />
• SEDA can facilitate the training of both small and<br />
medium scale farmers on ways to cut cost by land<br />
allocation, crop rotation and type of crops used<br />
• Retail chain stores (such as SPAR) may be able to<br />
source their products locally and assist with the<br />
distribution and collection of these products. SEDA<br />
could intervene by facilitating agreements between<br />
these chain stores and local small scale farmers<br />
• <strong>Small</strong> and medium scale farmers are not equipped<br />
to handle the additional costs required to enter the<br />
export market. As a result, SEDA could partner with<br />
financial institutions to assist these farmers in<br />
procuring affordable loan agreements to manage<br />
these additional costs. Furthermore, these<br />
institutions could further assist farmers in better<br />
managing their cash flow, which in turn could<br />
provide additional revenue for farmers to offset the<br />
additional costs required.<br />
• SEDA can help farmers cluster together to meet<br />
bulk export compliance requirements or aid them in<br />
brokering deals to sell their products under larger<br />
companies or labels.<br />
• Eskom’s future capacity plans incorporate the shift<br />
towards renewable energy with the by-products of<br />
sugar cane production being touted as a possible<br />
means of generating electricity. SEDA could play a<br />
role in facilitating negotiations between Eskom and<br />
small to medium scale farmers in the sugar cane<br />
sub-sector to generate electricity for both personal<br />
and commercial use.<br />
• As the demand for electricity rises, Eskom may not<br />
be able to sustain a steady flow of supply and as<br />
such farmers may need to consider other sources<br />
of electricity such as back-up generators, renewable<br />
energy etc. An area of opportunity exists for SEDA<br />
to collaborate with the Department of Trade and<br />
Industry (Dti) and facilitate interactions between<br />
small and medium scale farmers and companies<br />
involved in providing alternative energy sources<br />
such as solar panels and wind turbines. SEDA could<br />
assist these farmers in negotiating purchase<br />
agreements and affordable payment plans to meet<br />
the requirements of small to medium farmers.<br />
• An opportunity exists for SEDA to assist rural<br />
farmers in servicing the commercial market. These<br />
farmers would require technical knowledge about<br />
the commercial markets and would need to invest<br />
in appropriate infrastructure to service the<br />
commercial market.<br />
15
Short term<br />
products i.e. creating biodiesel from oil seed or<br />
sugar cane production for both personal and<br />
commercial use.<br />
• SEDA could aid in facilitating partnership<br />
agreements with large-scale commercial farmers<br />
or academic institutions to assist small and<br />
medium farmers in understanding the<br />
requirements of complying with international<br />
standards.<br />
Medium Term<br />
• Further research can be conducted into the future<br />
cost of water, water licensing, cost and benefits of<br />
boreholes and other new technology regarding<br />
methods of water usage as this will impact both<br />
small and medium scale farmers.<br />
• SEDA could engage with government to negotiate<br />
better import duties and export subsidies.<br />
Long term<br />
<strong>Small</strong> scale farmers<br />
• SEDA could assist small and medium scale<br />
farmers to attend trade fairs and agricultural<br />
expo’s to market their produce to both local and<br />
international markets.<br />
• SEDA could facilitate partnerships between<br />
academic institutions and small farmers to share<br />
knowledge on crop diseases and methods of<br />
prevention as well as supply farmers with<br />
reference to companies who can provide them<br />
with analysis of their current position.<br />
• SEDA could facilitate partnerships between<br />
academic institutions and small and medium<br />
scale farmers to share knowledge on wheat and<br />
animal farming methods.<br />
• SEDA can advise both small and medium scale<br />
farmers on bank loan requirements.<br />
• SEDA can conduct further research into potential<br />
opportunities and scope for small and medium<br />
scale farmers to produce pharmaceutical related<br />
products.<br />
16
1.5.2 Interventions for medium scale farmers<br />
Short term<br />
Medium Term<br />
Long term<br />
Medium scale farmers<br />
• SEDA could facilitate interactions between financial<br />
institutions and small and medium scale farmers to<br />
negotiate affordable loan agreements.<br />
• SEDA could facilitate workshops between financial<br />
institutions farmers to develop their financial<br />
management skills and learn to better manage their<br />
financial cash flow.<br />
• Although some areas may not be used for crop<br />
farming, the land could be used to rear animals. This<br />
represents an area of opportunity for SEDA to<br />
facilitate training for these farmers to diversify their<br />
products and enter the animal farming sector.<br />
• SEDA could facilitate interactions between<br />
commercial farmers and small and medium scale<br />
farmers to collaborate and irrigate unused land for<br />
the mutual benefit of both parties.<br />
• SEDA could facilitate interactions between<br />
businesses specialising in water storage facilities<br />
and small and medium scale farmers. This would<br />
allow farmers to meet their water requirements if<br />
there is an inadequate supply to their farms.<br />
• <strong>Small</strong> and medium scale farmers are not equipped<br />
to handle the additional costs required to enter the<br />
export market. As a result, SEDA could collaborate<br />
with financial institutions to assist these farmers in<br />
procuring affordable loan agreements to manage<br />
these additional costs. Furthermore, these<br />
institutions could further assist farmers in better<br />
managing their cash flow, which in turn could<br />
provide additional revenue for farmers to offset the<br />
additional costs required.<br />
• SEDA can facilitate the training of both small and<br />
medium scale farmers on ways to cut cost by land<br />
allocation, crop rotation and type of crops used.<br />
• Further research can be conducted into the future<br />
cost of water, water licensing, cost and benefits of<br />
boreholes and other new technology regarding<br />
methods of water usage as this will impact both<br />
small and medium scale farmers.<br />
• SEDA could engage with government to negotiate<br />
better import duties and export subsidies.<br />
• Eskom’s future capacity plans incorporate the shift<br />
towards renewable energy with the by-products of<br />
sugar cane production being touted as a possible<br />
means of generating electricity. SEDA could play a<br />
role in facilitating negotiations between Eskom and<br />
small to medium scale farmers in the sugar cane<br />
sub-sector to generate electricity for both personal<br />
and commercial use.<br />
• As the demand for electricity rises, Eskom may not<br />
be able to sustain a steady flow of supply and as<br />
such farmers may need to consider other sources<br />
of electricity such as back-up generators, renewable<br />
energy etc. An area of opportunity exists for SEDA<br />
to collaborate with the Department of Trade and<br />
Industry (Dti) and facilitate interactions between<br />
small and medium scale farmers and companies<br />
involved in providing alternative energy sources<br />
such as solar panels and wind turbines. SEDA could<br />
assist these farmers in negotiating purchase<br />
agreements and affordable payment plans to meet<br />
the requirements of small to medium farmers.<br />
• SEDA could assist small and medium scale farmers<br />
in researching methods for generating alternative<br />
energy through their agricultural products i.e.<br />
creating biodiesel from oil seed or sugar cane<br />
production for both personal and commercial use.<br />
• SEDA could aid in facilitating partnership<br />
agreements with commercial farmers or academic<br />
institutions to assist farmers with the requirements<br />
of complying with international standards.<br />
17
Short term<br />
Medium Term<br />
Long term<br />
Medium scale farmers<br />
• SEDA can advise both small and medium scale<br />
farmers on bank loan requirements.<br />
• SEDA could assist small and medium scale farmers<br />
to attend trade fairs and agricultural expos to market<br />
their produce to international buyers.<br />
• SEDA can conduct further research into potential<br />
opportunities and scope for small and medium scale<br />
farmers to produce pharmaceutical related<br />
products.<br />
18
1.6 Concluding remarks<br />
The KPMG team conducted an extensive desktop research study of the agriculture sector in South<br />
Africa with the main objective being the identification of economic potential, and, in turn,<br />
opportunities for small and medium enterprises and job-creation. The study analysed the current and<br />
future state of the agricultural sector. This enabled an assessment of possible opportunities in which<br />
SEDA can assist small and medium enterprises to enhance their businesses, in turn, improving the<br />
overall sector performance.<br />
The analysis comprised a desktop analysis, survey of potential SEDA clients and a survey of SEDA<br />
practitioners. The desktop research provided insight into the current and future trends within the<br />
agricultural sector as well as potential challenges faced by small and medium enterprises. The survey<br />
of SEDA’s potential clients provided information on where SEDA can intervene and what services<br />
and products it can develop to assist small and medium enterprises.<br />
As an additional value-add to the project, the KPMG team spoke to SEDA practitioners operating<br />
around the country. The objective of the survey was to gain an understanding of the challenges<br />
facing potential SEDA clients, as observed by SEDA practitioners. The practitioners were also<br />
questioned about challenges they encountered during the course of their work, In addition, they were<br />
asked about what they would require to perform their jobs more effectively.<br />
The results of all 3 segments of the engagement enabled an assessment of possible opportunities in<br />
which SEDA can assist small and medium enterprises in the agricultural sector. The possible areas of<br />
intervention, which the KPMG team identified, were within the following broad categories:<br />
■ Assistance due to lack of transport infrastructure<br />
■ Provision of affordable loan agreements<br />
■ Low percentage of arable land<br />
■ Inadequate supply of water<br />
■ Rising electricity cost and supply<br />
■ Assistance to enter the export market<br />
■ Shift towards organic products<br />
■ Sharing technical and practical knowledge on farming methods<br />
■ Decreasing the reliance on imported products<br />
19
2 Background to the project<br />
2.1 Introduction<br />
The agricultural sector’s contribution to South Africa’s Gross Domestic Product (GDP) declined<br />
gradually, over the past 10 years, from 2.7% in 2000 to 2.3% in 2010. However, despite agriculture’s<br />
reduced contribution to the country’s GDP, the sector remains vitally important to the South African<br />
economy.<br />
With 8.5 million people directly or indirectly dependant on agriculture either for income and<br />
employment, it is a sector in need of robust initiatives and support. The New Growth Path (NGP) has<br />
highlighted the agriculture sector as a potential employment creator and one capable of achieving key<br />
development objectives, particularly through commercial farming and agro-processing initiatives. With<br />
the NGP targeting 300 000 households in smallholder schemes and 145 000 jobs in agro processing<br />
by 2020, SEDA has an important role to play in supporting small enterprises which will create many<br />
of these jobs<br />
In this light, SEDA would like to conduct a desktop study of the South African agricultural sector. This<br />
study will provide an in-depth understanding of the agriculture sector thereby providing the<br />
organisation with information on which to base future decisions.<br />
KPMG conducted an extensive desktop research study of the agriculture sector in South Africa with<br />
the main objective being the identification of economic potential, and, in turn, opportunities for small<br />
enterprises and job-creation. The study aims to assess the current state of the agriculture sector in<br />
South Africa. In addition, this assessment examines the potential for the sector and the existence of<br />
any possible opportunities for small enterprises.<br />
In achieving the study objectives, as stipulated by SEDA, the study focused on the following tasks:<br />
■ Examining the long-term growth prospects for each of the major market segments and valuechains<br />
in the agriculture sector and relevant sub-sectors in South Africa;<br />
■ Analysing the investment intensity and major trends and factor conditions, which are likely to have<br />
significant impact on the sectors over the long-term;<br />
■ Identifying and quantifying the demand for specific products of each major market segment of the<br />
agriculture sector;<br />
■ Analysing the key differentiators and competitive environment for specific products and markets,<br />
such as product specifications, pricing, technology trends, sourcing, distribution arrangements and<br />
channels;<br />
■ Analysing the supply structure and identify key suppliers of products and services in each sector<br />
value-chain and present a profile of each of the major competitors in each sector and relevant subsector,<br />
including information on their product ranges and their estimated market share;<br />
■ Developing recommendations on where SEDA should focus its development mandate; and<br />
■ Making recommendations on options for market penetration strategies that can be ultimately fed<br />
into the process of SEDA’s development of business cases.<br />
20
2.2 Approach<br />
The following section provides a detailed overview of the approach followed by the project team.<br />
Phase 1<br />
Project Kick-off<br />
•Project kick-off meeting<br />
•<strong>Development</strong> of project plan and communication plan<br />
•Inception report<br />
Phase 2<br />
Desktop<br />
Research<br />
•Overview of sector and current performance<br />
•Literature review<br />
•Analysis of provincial and local government development strategies<br />
•Identification of additional growth sectors<br />
Phase 3<br />
Identification<br />
and<br />
categorisation<br />
•PESTEL analysis of agricultural sector<br />
•SWOT analysis of agricultural sector<br />
•Detailed study and strategy development for previously identified high-potential subsectors<br />
Phase 4<br />
Profiling of<br />
SEDA clients<br />
•Profiling of 100 SEDA clients from the SEDA database<br />
•<strong>Development</strong> of questionnaire<br />
•Calls to sub-sample and administartive questionnaire<br />
•Follow up with respondents<br />
•Questionnaire collected and anlaysed<br />
Phase 5<br />
Prepare draft<br />
and final report<br />
•Preparation of draft report<br />
•Incorporation of client feedback and finalisation report<br />
Phase 1: Project kick-off<br />
At the start of this project we met with SEDA representatives in order to set-up a project plan. This<br />
plan included SEDA meeting dates to ensure your involvement in the project process and to provide<br />
you with regular updates on the project’s progress. In addition, the goals and objectives of the project<br />
were also finalised at this stage.<br />
Based on our proposal a project steering committee (SC) was formed to manage the project<br />
governance aspects of this project. The SC consists of appropriate stakeholder representatives and is<br />
responsible for making all strategic decisions, monitoring progress, and approving deliverables as<br />
tabled jointly by the project director from SEDA and the project manager at KPMG. These two project<br />
managers are the core point of communication between the SEDA and the project team.<br />
A formal communication was developed, approved by the SC, and then implemented as the project<br />
progressed. KPMG provided a project inception report to SEDA, highlighting the key areas of focus<br />
covered in the final deliverables.<br />
The activities performed in this phase of the project are:<br />
■ Setting up of the project plan;<br />
21
■ Identification of project milestones and dates for progress updates; and<br />
■ Finalisation of project goals and objectives.<br />
The outputs from this phase of the project were a detailed project plan containing:<br />
■ Finalised project goals and objectives; and<br />
■ Important dates regarding the project milestones.<br />
Phase 2: Desktop research<br />
Phase two commenced with an analysis of the agriculture sector and its current performance. This<br />
was done by examining key statistical indicators including, sectoral revenue figures, national and<br />
regional Gross Domestic Product (GDP) contributions, and employment data. In addition to current<br />
information, the team also looked at historical data spanning the past five years in order to<br />
comprehend changes and trends that are critical to understanding sectoral performance. As a<br />
significant value-add, KPMG analysed this data to understand the impact of the global recession on<br />
the sector, as this will assist in determining if the sector has any particular vulnerabilities or<br />
resiliencies.<br />
The literature study involved a review of key studies that have been published over the past two<br />
years. These studies have looked at the state of the agriculture sector as well as important trends<br />
and developments. The literature review involved:<br />
■ The identification of previous studies, reports and policy documents;<br />
■ An analysis of the findings of these documents; and<br />
■ A comparison between the current KPMG study and the previous studies<br />
The information gathered from this review supplements the statistical analysis and provides a more<br />
detailed status-quo analysis of the agriculture sector.<br />
In order to assess the current growth and development environment of the agriculture sector, the<br />
KPMG project team examined the sector against broader regional, provincial, and national directives<br />
to determine alignment and synchronicity. The key policies considered here are the New Growth<br />
Path, the Industrial Policy Action Plan and the provincial growth and development strategies. In<br />
addition, this analysis ensures that all recommendations developed from this study will incorporate<br />
more recent development initiatives as well as additional policy directives, such as the greening of<br />
economic development, and the need to ensure that job creation focuses on “decent work.”<br />
In order to identify other potential high-growth sub-sectors in addition to those supplied by SEDA,<br />
KPMG adopted a two-tier approach by identifying and categorising these sub-sectors on two levels.<br />
These are:<br />
■ The large agricultural sub-sectors with high-employment and growth potential based on<br />
international trends; and<br />
■ <strong>Small</strong>er agricultural sub-sectors that include smaller-scale and niche activities that are more<br />
geared towards addressing localised development issues such as small enterprise development,<br />
rural development and employment creation.<br />
These sub-sectors were identified through a combination of desktop research and statistical analysis<br />
and will be finalised in consultation with SEDA.<br />
Phase 3: Identification and categorisation<br />
This phase of the project provides a more detailed understanding of the agriculture sector in South<br />
Africa. As per SEDA’s requirements, this looks at issues around job creation in the sector, the central<br />
role players and the incentives and support required for small enterprises. The diagram below<br />
illustrates the task flow for the project.<br />
22
SWOT ANALYSIS<br />
OF THE<br />
AGRICULTURE<br />
SECTOR<br />
DETAILED STUDY<br />
AND STRATEGY<br />
RECOMMENDATI<br />
ON FOR<br />
PREVIOUSLY<br />
IDENTIFIED HIGH-<br />
POTENTIAL<br />
SUBSECTORS<br />
PESTEL ANALYSIS<br />
OF THE<br />
AGRICULTURE<br />
SECTOR<br />
In order to assess these factors, KPMG conducted a PESTEL analysis (Political, Economic, Sociocultural,<br />
Technological, Environmental, and Legal analysis) of the agriculture sector. The results<br />
illustrate the investor environment within the sector as well those factors that may encourage or<br />
impede growth, job creation, and opportunities for small enterprises.<br />
The table below presents examples of factors identified in the PESTEL exercise.<br />
PESTEL FACTOR<br />
POLITICAL<br />
ECONOMIC<br />
SOCIO-CULTURAL<br />
TECHNOLOGICAL<br />
LEGAL<br />
POSSIBLE ISSUES TO BE EXPLORED<br />
- Political focus on the sector such as<br />
policies and strategies;<br />
- Subsidies for investment in the sector;<br />
- Planned investment in infrastructure; and<br />
- Political stability.<br />
- State of key economic indicators i.e.<br />
exchange rates, interest rates, inflation<br />
rates;<br />
- Cost of utilities;<br />
- Impact of global consumer trends; and<br />
- Impact of the global financial crisis.<br />
- Demographics;<br />
- Skill levels; and<br />
- Level of discouragement amongst<br />
workforce.<br />
- Access to new technology;<br />
- Access to ICT; and<br />
- Speed of transfer of new technologies.<br />
- Ease of doing business;<br />
- Tax policies;<br />
- Access to credit;<br />
- Protection of investors; and<br />
- Employment regulations.<br />
23
The results of the broader PESTEL analysis informed the SWOT (Strengths, Weaknesses,<br />
Opportunities, and Threats) study of the agriculture sector. The methodology involved the<br />
classification of factors that are both favourable and unfavourable to investment and innovation.<br />
These factors may be classified as either internal or external in nature. The SWOT analysis<br />
determined the growth potential of the specified sectors with a particular focus on contributing to<br />
economic growth, creating jobs and developing opportunities for small enterprises.<br />
As a means of providing more detail, this analysis was applied to the first and second tier sub-sectors<br />
identified in Phase 2 of the project. This provided a snapshot of each of these sectors by identifying<br />
the key role players and stakeholders.<br />
KPMG formulated a development plan for each first and second tier sub-sector that presents short-,<br />
medium- and long-term growth opportunities. In terms of timelines, the short-term looks at the next<br />
three years, with the medium-term outlook looking at 3-5 years and the long-term looks at 5 years or<br />
longer. It is important to note however that this may vary from sector to sector. The short to medium<br />
term forecasts generally look at more immediate interventions that will require less capital<br />
investment while long-term interventions will focus on sustainability and innovation. Once again, this<br />
may vary from sector to sector. Each sub-sector has goals for each time-period with an<br />
accompanying methodology to achieve the specified goal.<br />
In terms of value chain analysis, each sub-sector was analysed according to the value that it keeps<br />
and develops in the region. This focused on highlighting beneficiation opportunities as well as jobcreating<br />
potential. This also links to the potential for <strong>Small</strong>, Medium, and Micro <strong>Enterprise</strong>s to<br />
capitalise on opportunities by looking at the saturation of established players in the industry, the<br />
levels of required capital investment, and the room for smaller investors and businesses.<br />
Each sub-sector was analysed in terms of current access to infrastructure and services that increases<br />
the ease of doing business and enhances the attractiveness of the subsector itself. The analysis here<br />
was combined with an examination of local and natural conditions that provide unique opportunities<br />
to niche investors.<br />
Phase 4: Profiling of SEDA clients in the sector<br />
This phase profiled 100 of SEDA’s potential clients currently operating within the agriculture sector.<br />
Due to time constraints, KPMG were only able to interview a 25% sub-sample of SEDA’s 100<br />
potential clients in the agriculture sector. The KPMG team developed a questionnaire that will gather<br />
information from the sub-sample around their status, challenges, and required interventions.<br />
In addition, the KPMG team developed a practitioner survey to ascertain the impact of SEDA’s role<br />
within the agricultural sector. This phase of the project depended on SEDA providing accurate<br />
profiling and contact information from their database and contacting their clients to inform them of<br />
the project and KPMG’s role.<br />
The design of the questionnaire was based on our experiences from similar projects with invaluable<br />
insight being gained regarding:<br />
■ The length of the questionnaire;<br />
■ The wording of the questions so as to avoid ambiguity and confusion;<br />
■ The design and lay-out of the questionnaire; and<br />
■ The necessary amount of time allowed for satisfactory completion.<br />
KPMG worked closely with SEDA while drafting the questionnaire. The diagram below outlines the<br />
steps followed in administering the questionnaire.<br />
24
The administration of the surveys began with a KPMG staff member calling the SEDA clients and<br />
practitioners in the sub-sample. They explained the project and the questionnaire. The questionnaires<br />
were then emailed, faxed or posted as per the stated preference of the respondent.<br />
Respondents were then called to confirm receipt of the questionnaire and the submission due-date<br />
will be reiterated. KPMG stressed the need to have the questionnaires completed before or by the<br />
due date.<br />
Data capturing and analysis commenced as the questionnaires were received. All the responses<br />
received were mapped and grouped thus making for analysis that is more effective.<br />
Phase 5: Preparation of draft and final report<br />
Following completion of our work, we issued this written report to you in accordance with the scope<br />
of our engagement.<br />
The activities performed in this phase of the project were:<br />
■ Preparation of the draft report, results and findings;<br />
■ Presentation of draft report to SC and incorporation of subsequent feedback; and<br />
■ Issuing of final report.<br />
The deliverables for this phase of the project was:<br />
■ A draft report with the methodology, results and findings which was made available to SEDA for<br />
comment; and<br />
■ A final written report incorporating SEDA’s feedback and comments.<br />
In order to complete this final phase of the project we required SEDA’s project team’s comment on<br />
the draft report prior to issuing the final report.<br />
2.3 Report layout<br />
This report is organised as follows:<br />
■ Chapter 1: outlines the key findings of the report.<br />
■ Chapter 2: reports on the background to the project<br />
25
■ Chapter 3: reports on the national status quo analysis and short to medium term outlook.<br />
■ Chapter 4: reports on the provincial situation.<br />
■ Chapter 5: reports on the value chains within the agricultural sector.<br />
■ Chapter 6: reports on the PESTEL and SWOT analysis of the agricultural sector.<br />
■ Chapter 7: reports on the feedback from the potential client survey.<br />
■ Chapter 8: reports on the feedback from the SEDA practitioner surveys.<br />
■ Chapter 9: reports on the identification of potential opportunities for interventions<br />
■ Chapter 10: reports on the linkages with relevant stakeholders<br />
■ Chapter 11: contains the concluding remarks.<br />
2.4 The role of SEDA in the agricultural sector<br />
Established in 2004, SEDA provides business support services to small enterprises through a national<br />
network as well as through partnerships with local service providers. SEDA has been mandated to<br />
operate this network and apply it uniformly across the country while also coordinating all national and<br />
provincial initiatives to assist small and medium enterprises. The primary objective for the<br />
organisation is to increase the socio-economic contribution of these enterprises in the country. The<br />
SEDA branches across the country are tasked with assisting businesses with information, training,<br />
trade information, coaching, as well as facilitating access to markets.<br />
2.5 Acknowledgements<br />
We record our appreciation for the time and cooperation provided to the project team by the<br />
management and staff of SEDA, the SEDA practitioners and potential SEDA clients surveyed.<br />
2.6 Disclaimer<br />
This report has been compiled by KPMG for the sole and exclusive use of SEDA. It should not be<br />
quoted in whole or in part, by any party other than SEDA, without our prior written consent. KPMG’s<br />
findings in connection with this report are intended solely and exclusively for the benefit, information,<br />
and use by SEDA. No party, other than the SEDA, may rely on the findings, either in whole or in part.<br />
KPMG (including its directors or employees or anybody or entity controlled, owned or associated with<br />
KPMG) accepts no liability or responsibility whatsoever, resulting directly or indirectly from the<br />
disclosure of our findings to any third party and/or the reliance of any third party on the findings,<br />
either in whole or in part. KPMG’s findings are related to prevailing conditions and information<br />
available at the time of issuing our report.<br />
2.7 Limitations<br />
We have relied upon the sources of information referred to in this report. Except where specifically<br />
stated, we have not sought to establish the reliability of those sources. We have however reviewed<br />
the information and have sought explanations for key trends and salient features identified by us. We<br />
have also satisfied ourselves, as far as possible, that the information presented is consistent with<br />
other information obtained by us in the course of the work undertaken to prepare this report.<br />
Our engagement does not comprise a due diligence review or constitute an audit or review, other<br />
assurance engagement or an agreed-upon procedures engagement, performed in accordance with<br />
International Standards on Auditing (ISAs), International Standards on Review Engagements (ISAEs)<br />
or International Standards on Related Services (ISRS). Consequently, an audit opinion or assurance<br />
conclusion will not be expressed nor will there be a report on factual findings.<br />
As such, this report may not necessarily disclose all significant matters about the project or reveal<br />
errors or irregularities, if any, in the information and representations made to us and upon which we<br />
have relied.<br />
26
SEDA provided the financial information applied in the analysis. The information contains forwardlooking<br />
statements with respect to the refinery’s financial condition and results of operations. Such<br />
information is subject to risks and uncertainties that could cause actual results to differ materially<br />
from those forecasts since anticipated events frequently do not occur as expected; accordingly no<br />
assurance will be expressed regarding the achievability of the forecasts.<br />
Estimations made embody assumptions on the behaviour of factors in the macro and micro<br />
economy, and the project itself. These assumptions were based on evidence available as at the time<br />
of this report. Users of the forecasts may consider other assumptions to be more appropriate, which<br />
may materially change the outcome of the forecasts.<br />
Please note that any advice, opinion, statement of expectation, forecast, or recommendation supplied<br />
by us as part of the service shall not amount to any form of guarantee that we have determined or<br />
predicted future events or circumstances.<br />
27
3 Status quo analysis and short to<br />
medium term forecast: National<br />
3.1 Analysis of national situation<br />
The agriculture sector in South Africa is diverse, incorporating crop production, horticulture, animal<br />
production, dairy farming, fish farming, and game farming. The distribution of these activities across<br />
the country is highly dependent on climate, natural vegetation, and soil type. Crop production tends<br />
to be concentrated in winter-rainfall, high summer-rainfall areas, with cattle farming centred in the<br />
bushveld, and sheep farming concentrated in the more arid regions of the country. Only 12% of<br />
South Africa’s surface area is suitable for crop production with the biggest challenge being the<br />
availability of water 2 .<br />
The South African agricultural sector comprises a highly developed commercial sub-sector geared<br />
towards export, as well as a smaller subsistence sector. This categorisation, however, belies much<br />
3<br />
diversity . The table below illustrates the various types and sizes of enterprises within the sector as<br />
of 2009.<br />
Table 1: Typology of enterprises in the agriculture sector<br />
Typology of the agriculture sector<br />
Production Unit<br />
Turnover<br />
Ownership and<br />
management<br />
Number<br />
of units<br />
Binding<br />
constraint<br />
Support required<br />
Large commercial on<br />
private property<br />
> R 2 million<br />
Family owned but<br />
incorporated multiple<br />
farms<br />
Rent in land – professional<br />
management<br />
± 5 400<br />
Market size<br />
Equity capital<br />
• Export market<br />
access<br />
• Financial<br />
market<br />
innovation<br />
Medium commercial<br />
on private property<br />
R300 000 to<br />
R2 million<br />
Family owned – could be<br />
incorporated<br />
Some renting in of land –<br />
family management<br />
17 000<br />
Land capital<br />
management<br />
• Mortgage<br />
capital for land<br />
access<br />
• Management<br />
training<br />
<strong>Small</strong> commercial on<br />
private property<br />
< R 300 000<br />
Family owned, generally<br />
part time.<br />
Some lifestyle farming<br />
(game ranches, weekend<br />
farms)<br />
24 000<br />
Management<br />
time<br />
2 Government Communication and Information Systems (2010). South Africa Yearbook 2010/2011. Pretoria: GCIS<br />
3 AgriSETA. Agricultural Sector Strategic Skills Plan: 2011-2016. Prepared, on behalf of the Sector by AgriSETA for submission<br />
to the Department of Higher Education and Training. September 2010<br />
28
Typology of the agriculture sector<br />
Production Unit<br />
Turnover<br />
Ownership and<br />
management<br />
Number<br />
of units<br />
Binding<br />
constraint<br />
Support required<br />
Commercial in<br />
communal areas<br />
> R 300 000<br />
Communal ownership<br />
<strong>Development</strong> projects<br />
Private ownership<br />
-<br />
Capital<br />
management<br />
Infrastructure<br />
• Grants for land<br />
access<br />
• Comprehensive<br />
farmer support<br />
• Credit<br />
• Physical<br />
infrastructure<br />
“Emerging”<br />
commercial in<br />
communal areas<br />
< R 300 000<br />
> 20 hectares<br />
Communal ownership<br />
<strong>Small</strong> farmers in<br />
development projects<br />
35 000<br />
Land<br />
Property rights<br />
Capital<br />
Labour<br />
management<br />
• Grants for land<br />
access<br />
• Comprehensive<br />
farmer support<br />
• Physical<br />
infrastructure<br />
• Institutional<br />
infrastructure<br />
Private ownership<br />
Employment<br />
opportunities<br />
Subsistence farmer in<br />
communal areas<br />
Allotments<br />
< 20 hectares<br />
Communal ownership<br />
Private ownership<br />
1 256<br />
million<br />
Employment<br />
opportunities<br />
• Social welfare<br />
transfers<br />
Market gardens<br />
Little formal market<br />
participation<br />
Source: AgriSETA, 2010<br />
The dual categorisation of agricultural enterprises as either commercial or subsistence is highly fluid,<br />
with many commercial enterprises turning towards subsistence production and vice versa. This has<br />
largely been attributed to the global economic crisis and lower prices. Large corporations using<br />
smaller farmers for the supply of products and many smaller emerging farmers who are<br />
commercialising their operations and entering the export market have also underpinned the<br />
variability 4<br />
South Africa remains a major exporter of agricultural produce and ranks highly on many products, as<br />
illustrated in the table below:<br />
South Africa’s world ranking in selected products<br />
Export product<br />
Avocados<br />
Clementines<br />
Ostrich products<br />
Grapefruit<br />
South Africa’s world ranking<br />
1 st<br />
1 st<br />
1 st<br />
2 nd<br />
4 AgriSETA, 2010<br />
29
South Africa’s world ranking in selected products<br />
Export product<br />
Table grapes<br />
Plums<br />
Pears<br />
South Africa’s world ranking<br />
3 rd<br />
3 rd<br />
5 th<br />
Source: DTI, February 2010<br />
Despite the dominance in these products, South Africa’s position as a major exporter is challenged by<br />
farming subsidies in the European Union and the United States, which are the country’s major export<br />
destinations. With the lack of similar subsidies in South Africa, local producers are unable to compete<br />
against the lower prices overseas.<br />
The global recession has not affected the agriculture sector as much as expected. This is largely<br />
attributed to the fact that agricultural demand is relatively inelastic and therefore less vulnerable to<br />
economic conditions. In 2009, the global agriculture sector declined by 3% in volume and by 13% in<br />
total value. This decline was largely attributed to weaker demand, weakening currencies and falling<br />
commodity prices 5 .<br />
In South Africa, agricultural production grew by 13.7% between 2008 and 2009 to R126.3 billion.<br />
Despite this growth however, South Africa is still losing ground as one of only ten countries in the<br />
world that are net agricultural exporters. The biggest contributors to agricultural production are animal<br />
products (48.2%), crops (26.7%), and horticultural products (25.1%). The largest contributing<br />
subsectors have been poultry products (R21 billion, 16.7%), red meat (R20 billion), maize (R19 billion)<br />
and fruit (over R16 billion). Nonetheless, the sector has been hit hard by rising input costs, particularly<br />
6<br />
with animal feed, fuel, and fertilisers .<br />
In terms of capital, the South African Reserve Bank states that the sector’s capital stock has declined<br />
from R120 billion in value in the early 1990’s to R110 billion in 2009. During the same period, the<br />
7<br />
sector’s share of investment fell from 4% to 2% .<br />
3.1.1 GDP contribution of the sector<br />
In 2010, agriculture, forestry, and fishing contributed 2.5% to the national GDP. The table below<br />
presents the sectoral contributions.<br />
5 Issardi, E., Cloete, P., and Van Schalkwyk, H. (2010). “The impact of the economic crisis on agricultural trade: the case of<br />
South Africa’s fruit and wine exports”. Paper presented at the 21 st Annual Symposium and Forum of the International Food<br />
and Agribusiness Management Association. 20-23 June 2011. Frankfurt, Germany<br />
6 Finweek (2010). “Agribusiness: GDP contribution highly misleading” in Finweek. 15 April 2010<br />
7 Patel, E., (2011). “The New Growth Path: what is expected from the agricultural sector”. Address by Minister Ebrahim Patel<br />
to the AgriSA Conference, 22 February 2011<br />
30
Figure 6: Sectoral contribution to the South African GDP – 2010<br />
General<br />
government<br />
services, 15.3%<br />
Agriculture, forestry<br />
and fishing, 2.5%<br />
Mining and<br />
quarrying, 6.1%<br />
Community, social<br />
and personal<br />
services, 6.3%<br />
Manufacturing,<br />
17.1%<br />
Electricity, gas and<br />
water, 2.1%<br />
Financial<br />
intermedidation,<br />
insurance, real<br />
estate and business<br />
services, 23.5%<br />
Transport,<br />
storage and<br />
communication,<br />
10.2%<br />
Construction, 3.6%<br />
Wholesale and<br />
retail trade, catering<br />
and accomodation,<br />
13.3%<br />
Note: At constant 2000 prices<br />
Source: Statistics South Africa, 2011 (Adapted from Quantec, by KPMG)<br />
Despite the relatively small contribution, the agriculture sector has strong forward and backward<br />
linkages to other economic sectors. These include a major link to the manufacturing sector through<br />
agro-processing and to the wholesale and retail trade sector through game farms and lodges. If the<br />
linkages were taken into account, the contribution of the agro-industrial sector would account for<br />
12% of GDP 8 . The agricultural sector linkages will be discussed in more detail in Chapter 11 of this<br />
report.<br />
3.1.2 Employment in the sector<br />
Employment in the agriculture sector has been on the decline since the early 1990’s and along with<br />
mining, has shed the most number of jobs. Between 1988 and 1998 the sector shed 20% of its total<br />
employment and despite slight upturns in employment since then, the general trend has been one of<br />
decline. The table below illustrates the movement in employment in the sector.<br />
8 GCIS, 2010<br />
31
1 400 000<br />
1 200 000<br />
1 000 000<br />
800 000<br />
600 000<br />
400 000<br />
200 000<br />
-<br />
1Q2005<br />
3Q2005<br />
1Q2006<br />
3Q2006<br />
1Q2007<br />
3Q2007<br />
1Q2008<br />
2Q2008<br />
3Q2008<br />
Number of employees<br />
4Q2008<br />
1Q2009<br />
2Q2009<br />
3Q2009<br />
4Q2009<br />
1Q2010<br />
2Q2010<br />
3Q2010<br />
4Q2010<br />
1Q2011<br />
2Q2011<br />
Note: : * - Quarter 2, 2011<br />
Source: Statistics South Africa, 2011 (Adapted from Quantec, by KPMG)<br />
Year and Quarter<br />
One of the most important factors leading to the decline in employment has been the move away<br />
from formal labour to more casual seasonal labour. In addition, there has been a move towards<br />
increased mechanisation, motivated predominantly by cost-saving concerns. Since 2008, the decline<br />
in employment has been more marked, because of the effects of the global recession. Certain<br />
agricultural sub-sectors fared worse than others, resulting in a net loss of jobs. The decline in global<br />
trade and fluctuating exchange rates had a negative impact on the sector, as did the failure to<br />
implement fair trade policies around the world 9 .<br />
3.1.3 National policy overview<br />
3.1.3.1 The New Growth Path<br />
In 2010, the South African government launched the New Growth Path (NGP). The NGP provides the<br />
framework to drive economic development that would facilitate job creation. The target is the<br />
creation of 5 million new job opportunities by 2020. The strategy of the policy is to target capital and<br />
capacity at labour-absorbing activities. The NGP identified these activities as the agricultural and<br />
mining value chains, manufacturing and services.<br />
Concerning the agriculture sector the NGP aims to create 300 000 opportunities for households and<br />
145 000 new jobs in agro-processing by 2020. In achieving these outcomes, the NGP plans to<br />
address the following issues:<br />
■ Targeting land reform so as to support smallholder schemes and provide support around<br />
infrastructure, marketing, finance etc;<br />
■ Formalising employment in commercial agriculture;<br />
■ Support of the commercial farming sector so as to address risks around price fluctuations of<br />
certain crops while also tackling the issue of national food security;<br />
9 Department of Agriculture, Forestry and Fisheries. (2010). “Estimate of the contribution of the Agriculture sector to<br />
employment in the South African economy”. Compiled by the Directorate: Economic Services. August 2010<br />
32
■ Acceleration of the land-claims process and increased support to new farmers;<br />
■ Instituting programmes that monitor the pricing of agricultural inputs such as fertiliser; and<br />
■ Support for fishing and aquaculture.<br />
3.1.3.2 The Industrial Policy Action Plan 2011/2012 – 2013/2014 (IPAP 2)<br />
IPAP 2 is a key policy instrument within the NGP’s job-creation strategy. The policy provides an action<br />
plan for the implementation of the NGP, highlighting necessary interventions and key stakeholders<br />
that need to be engaged. IPAP 2 targets high-growth sectors with the potential to create<br />
employment, in particular, manufacturing as well as mining and agricultural value chains that process<br />
primary materials in to advanced products.<br />
IPAP 2 has classified their target sectors into three clusters. These are listed below along with the<br />
agriculture-related sub-sectors:<br />
■ Cluster 1 - Qualitatively new areas of focus: Agro-processing;<br />
■ Cluster 2 – Scaled-up and broadened interventions in existing IPAP sectors: Biofuels; Forestry,<br />
paper and furniture;<br />
■ Cluster 3 – Sectors with potential for long-term advanced capabilities: No direct linkages with the<br />
agriculture sector.<br />
The agricultural sub-sectors listed above are technically categorised as manufacturing. However, they<br />
do have strong backward linkages to the agriculture sector and thus provide strong opportunities for<br />
growth in the primary sector.<br />
Cluster 1: Agro-processing<br />
The major subsectors within agro-processing include food processing, beverages, aquaculture,<br />
horticulture and medicinal, aromatics and flavourants.<br />
According to the IPAP 2 policy document, agro-processing is the largest manufacturing sub-sector<br />
and employs 171 000 people. If primary agriculture was included, the total number of employees<br />
would rise to 1 million.<br />
Key opportunities in the sector include:<br />
■ Competitive advantages in high-value agricultural products such as wines, Rooibos and<br />
Honeybush tea and select fruits; and<br />
■ Fish farming.<br />
IPAP 2 has also identified and developed Key Action Programmes in the sector. These are:<br />
■ <strong>Development</strong> of a food-processing strategy and action plan;<br />
■ <strong>Development</strong> of a soya bean strategy and action plan;<br />
■ <strong>Development</strong> of marine aquaculture zones;<br />
■ Establish aquaculture hatcheries;<br />
■ <strong>Development</strong> of the organic food industry;<br />
■ Implementation of a water efficiency programme for the sugar sector;<br />
■ <strong>Development</strong> of a small-scale milling industry;<br />
■ Enhancement of competitiveness in the fruit and vegetable canning industry; and<br />
■ Promote exports of beneficiated Rooibos and Honeybush products.<br />
33
Cluster 2: Biofuels<br />
<strong>Development</strong> of the biofuels sector has lagged due to regulatory constraints and the global financial<br />
crisis that has increased input costs. The sector’s strong forward linkages to the agriculture sector.<br />
However, the sector has the potential to create a significant number of jobs.<br />
With government already having pledged a 2% target for biofuels inclusion in the national fuel supply,<br />
IPAP 2 estimates that a target of 10% would create at least 125 000 additional direct jobs, particularly<br />
in rural areas.<br />
Cluster 2: Forestry, timber, paper, pulp and furniture (FTPP)<br />
With the strong backward linkages to the agriculture sector, the FTPP sector has the potential to<br />
create substantial new employment opportunities. IPAP 2 estimates that new afforestation projects<br />
can create up to 15 600 jobs across the country.<br />
Key opportunities in the sector include:<br />
■ New forestry projects in the Eastern Cape and Kwazulu Natal with smaller opportunities in<br />
Limpopo and Mpumalanga;<br />
■ Value-added opportunities for small growers; and<br />
■ Recycling of wood waste.<br />
PAP 2 has also identified and developed Key Action Programmes in the sector. These are:<br />
■ Integrated approach to fast tracking the issuance of water licenses;<br />
■ Skills transfer and technology upgrading programme for small-scale saw millers;<br />
■ Furniture;<br />
■ Charcoal manufacturing enterprises; and<br />
■ Biomass sub-sector development for SMME’s.<br />
3.1.3.3 The Agricultural sector and the National <strong>Development</strong> Plan: Vision for 2030<br />
In August 2011, the National Planning Commission (NPC) published a Diagnostic Report on the South<br />
African economy. In November 2011, the National <strong>Development</strong> Plan followed this Diagnostic<br />
Report: Vision for 2030. Due to its connection with rural development and its importance for factors<br />
such as food security and poverty reduction, the agricultural sector plays a central role the NPCs<br />
Vision for 2030. As a mid-skill, labour intensive sector, agriculture can be seen as one of the sectors<br />
that is good for both growth and jobs.<br />
The Diagnostic Report focused on an analysis of the status quo of the country and identifying the<br />
central challenges for the country. Of the identified challenges, 4 have a particular link to the<br />
agricultural sector. These are:<br />
■ The high levels of unemployment in the country<br />
■ Infrastructure that is poorly positioned, under-maintained and inadequate to promote higher<br />
growth<br />
■ Spatial patterns that exclude the poor from the fruits of development, and<br />
■ The economy being excessively and unsustainably resource intensive.<br />
The NPC identified broad areas of importance in order to tackle these challenges. Areas of particular<br />
importance to the future success of the agricultural sector, are the following areas:<br />
■ Creating jobs and livelihoods<br />
34
■ Expanding infrastructure<br />
■ Transitioning to a low-carbon economy<br />
■ Transforming urban and rural spaces, and<br />
■ Improving education and training.<br />
In addition, the agricultural sector will be faced with changes in the external environment, such as<br />
changes in South Africa’s demographic trends, specifically the continued rate of urbanisation, as well<br />
as the impact of climate change. It is expected that by 2030, 70% of South Africa’s population will be<br />
living in urban areas. These changes in population patterns and challenges from climate change will<br />
play an important role in the future development of the agricultural sector.<br />
Vision 2030 for the agricultural sector<br />
The vision that the NPC has for the rural communities in South Africa, is that these communities<br />
should have increased opportunities to partake fully in the economic, social, and political life of the<br />
country. People should be able to access high-quality basic services that will allow them to be well<br />
nourished, healthy and progressively more skilled. The NPC views agriculture, agro-processing, and<br />
fisheries as some of the main sectors that will support development for rural communities. The NPC<br />
is of the opinion that the motivating factor behind the growth of the agricultural sector will be the<br />
development of irrigated agriculture, supplemented by dry-land production, where feasible.<br />
In respect to steps that the NPC view as important to the future success of the agricultural sector,<br />
the following is required:<br />
■ Agricultural development should take place based on successful land reform, employment<br />
creation, and strong environmental safeguards. To achieve this, irrigated agriculture and dry land<br />
production should be expanded. The process should beginning with smallholder farmers, where<br />
possible.<br />
■ In areas with greater economic potential, industries such as agro-processing, tourism, fisheries,<br />
and small enterprise development, could be keys to the growth of the sector.<br />
According to the research commissioned by the NPC, Agriculture has the ability to create close to 1<br />
million new jobs by 2030. This could a noteworthy contribution to the overall employment target.<br />
Actions identified by the NPC to achieve the estimated employment targets, are:<br />
■ The expansion of irrigated agriculture: Evidence shows that the 1.5 million hectares under<br />
irrigation can be expanded by at least 500 000 hectares through the better use of existing water<br />
resources and developing new water schemes. The majority of South Africa’s horticulture harvest<br />
and some field crops are produced in this way.<br />
■ The conversion of some under-utilised land in communal areas and land reform projects into<br />
commercial production.<br />
■ Giving preference to commercial agriculture sectors and regions that have the most potential for<br />
growth and employment.<br />
■ Supporting job creation in the upstream and downstream industries.<br />
■ Finding creative combinations between opportunities, and<br />
■ Developing strategies that give new entrants access to product value-chains and support from<br />
better resourced players.<br />
The implications of the above, potential opportunities, as well as potential areas for intervention by<br />
SEDA, will be discussed in the remaining chapters of this document.<br />
35
3.1.4 Analysis of ownership trends<br />
Figure 7 (below) illustrates the breakdown of national farming units by ownership type. In 2007, there<br />
were 39 966 active farming units which constitutes a 12.8% decrease compared to the 45 818 active<br />
farming units recorded in 2002. The deregulation of the agricultural industry reduced the financial<br />
assistance extended to small to medium enterprise farmers, which in turn increased their levels of<br />
debt and furthermore reduced their levels of profitability. Declining levels of profitability led to a<br />
reduction in farming units as smaller farmers were financially strained and could not compete with<br />
larger firms that were able to minimise their costs due to economies of scale. In 2007, individuals,<br />
6% by close corporations, 5% by private companies, 3% by partnerships, and 2% by families<br />
managed approximately 83% of these units. The smallest proportion of owners and operators are<br />
government departments and public corporations (classified as “other”) with a contribution of<br />
approximately 1%.<br />
Figure 7: National breakdown of farming unit ownership<br />
Partnership<br />
3%<br />
Private Company<br />
5%<br />
Other<br />
1%<br />
Close corporation<br />
6%<br />
Individual<br />
83%<br />
Family<br />
2%<br />
Table 2: Breakdown of national farms by type of ownership<br />
Farming unit ownership<br />
Ownership<br />
Number of farming units<br />
Close corporation 2 259<br />
Family 874<br />
Individual 33 249<br />
Partnership 1 180<br />
Private Company 2 167<br />
Other 237<br />
National Total 39 966<br />
Source: Census of commercial agriculture, Statistics South Africa, 2007<br />
36
3.1.5 Analysis of financial stability<br />
3.1.5.1 Capital expenditure<br />
Figure 8 (below) illustrates the breakdown of capital expenditure by ownership. Total capital<br />
expenditure, in 2007, equalled R2 859 million with approximately 51% contributed by individuals,<br />
33% by private companies, 8% by closed corporations, 5% by partnerships and 2% by families. The<br />
smallest proportion of owners and operators are government departments and public corporations<br />
(classified as “other”) with a contribution of approximately 1%. Interestingly, private companies own<br />
and operate approximately 5% of the national farming units but they contribute approximately 33% of<br />
capital expenditure in the sector. This equates to an estimated R433 770 spent on each farming unit<br />
owned and operated by private companies.<br />
Given the rising levels of farming debt, high interest rates and stringent loan payment periods,<br />
individuals and SMME’s are forced to minimise their costs and remain profitable which in turn limits<br />
their ability to invest in new infrastructure. Conversely, larger private firms minimise their operational<br />
costs due to economies of scale, receive preferential loan agreements and may have access to highly<br />
lucrative export markets. This allows private companies to invest in new infrastructure, which in turn<br />
aids the expansion of their business to meet export demand.<br />
Figure 8: National breakdown of capital expenditure by ownership type<br />
Partnership<br />
5% Private Company<br />
33%<br />
Other<br />
1%<br />
Closed corporation<br />
8%<br />
Individual<br />
51%<br />
Family<br />
2%<br />
Source: Census of commercial agriculture, Statistics South Africa, 2007<br />
Table 3: Capital expenditure breakdown by ownership type<br />
Capital expenditure in agricultural sector<br />
Ownership Number of farming units Capital expenditure (R ‘000)<br />
Capital expenditure per unit<br />
(R’000)<br />
Close corporation 2 259 244 405 108.19<br />
Family 874 44 340 50.73<br />
Individual 33 249 1 448 247 43.56<br />
Partnership 1 180 140 632 119.18<br />
Private Company 2 167 939 978 433.77<br />
37
Capital expenditure in agricultural sector<br />
Ownership Number of farming units Capital expenditure (R ‘000)<br />
Capital expenditure per unit<br />
(R’000)<br />
Other 237 41 479 175.02<br />
National Total 39 966 2 859 081 71.54<br />
Source: Census of commercial agriculture, Statistics South Africa, 2007; KPMG Analysis<br />
Figure 9 (below) illustrates the breakdown of capital expenditure within the agricultural sector.<br />
Investment in land, buildings and new developments accounts for approximately 57% of the<br />
agricultural sector’s capital expenditure (R2 859 million). Investment in new assets (30%) and preowned<br />
assets (13%) accounts for the remainder of the sector’s capital expenditure.<br />
Figure 9: Distribution of capital expenditure<br />
New assets<br />
30%<br />
Land, buildings<br />
and development<br />
57%<br />
Pre-owned assets<br />
13%<br />
Source: Census of commercial agriculture, Statistics South Africa, 2007<br />
3.1.5.2 Farming debt<br />
Figure 10 (below) illustrates the distribution of farming debt by ownership type. Farming debt, in<br />
2007, equalled R39 580 million, with approximately 61% contributed by individuals, 25% by private<br />
companies, 8% by close corporations and 4% by partnerships. The smallest proportion of owners<br />
and operators are government departments and public corporations (classified as “other”) and<br />
families with a contribution of approximately 1% each.<br />
Individuals contributed approximately 61% to the country’s farming debt, which is in line with<br />
expectations due to the 83% farming unit ownership held by this category. Farming debt increased<br />
by over 250% between 1993 and 2007, which is the result of reduced governmental aid, provided to<br />
small to medium enterprise farmers. Interestingly, private companies contribute approximately 25%<br />
of the country’s farming debt with only 5% of farming units being owned by private firms. The higher<br />
ratio of debt per farming unit for private companies may be attributed to higher investment in new<br />
infrastructure in order to meet rising export demand.<br />
38
Figure 10: Distribution of farming debt by ownership type (R '000)<br />
Partnership<br />
4%<br />
Private Company<br />
25%<br />
Individual<br />
61%<br />
Family<br />
1%<br />
Other<br />
1%<br />
Closed corporation<br />
8%<br />
Source: Census of commercial agriculture, Statistics South Africa, 2007<br />
Table 4: Distribution of farming debt by ownership type<br />
Farming debt by ownership<br />
Ownership Farming debt (R ‘000)<br />
Close corporation 3 137 987<br />
Family 633 959<br />
Individual 24 001 616<br />
Partnership 1 595 651<br />
Private Company 9 809 959<br />
Other 401 222<br />
National Total 39 580 394<br />
Source: Census of commercial agriculture, Statistics South Africa, 2007<br />
Figure 11 (below) depicts the distribution of the agricultural sector’s farming debt by creditor type.<br />
The largest creditors were commercial banks and private persons with amounts of R17 144 million<br />
and R10 306 million extended to the sector respectively. The significant reliance on commercial<br />
banks stems from of small to medium enterprises and individuals being able obtain loans through<br />
commercial banks more easily than any other creditor type. Commercial banks are able to extend<br />
credit more easily to these individuals due to their access to financial markets however; the<br />
downside is that interest rates and loan repayments are higher than other creditors.<br />
Other financial institutions (R4 752 million), Co-operations/agricultural companies (R4 402 million),<br />
Land Bank (R2 585 million) and the government (R391 million) also extended credit to the agricultural<br />
sector in 2007. Although the aforementioned institutions extend credit to the agricultural sector, they<br />
have not been comparable to the amounts provided by commercial banks and private institutions.<br />
This is due to the limited amount of funding available through these channels, which further restrict<br />
the number of small to medium enterprises and individuals that may receive financial assistance.<br />
39
Figure 11: Farming debt distribution by creditor type<br />
R million<br />
20 000<br />
18 000<br />
16 000<br />
14 000<br />
12 000<br />
10 000<br />
8 000<br />
6 000<br />
4 000<br />
2 000<br />
0<br />
Commercial<br />
banks<br />
Private persons Other Co-op/Agric<br />
companies<br />
Land bank<br />
Government<br />
Source: Census of commercial agriculture, Statistics South Africa, 2007<br />
3.1.5.3 Market value of assets<br />
Figure 12 (below) depicts the distribution of the agricultural sector’s assets by ownership type.<br />
Individuals and private companies possess the majority of the agricultural sector’s assets (by market<br />
value) with 66% and 20% respectively. The remaining contributors to the agricultural sectors<br />
R179 525 million asset pool are close corporations (6%), partnerships (4%), families (3%) and<br />
government departments/public corporations (1%).<br />
Figure 12: Market value of agricultural sector assets by ownership type<br />
Partnership<br />
4%<br />
Private Company<br />
20%<br />
Other<br />
1%<br />
Individual<br />
66%<br />
Close corporation<br />
6%<br />
Family<br />
3%<br />
Source: Census of commercial agriculture, Statistics South Africa, 2007<br />
40
Table 5: Breakdown of agricultural sector assets by ownership type<br />
Market value of agricultural assets<br />
Ownership Market value of assets (R ‘000)<br />
Close corporation 11 324 798<br />
Family 4 625 609<br />
Individual 118 079 667<br />
Partnership 8 066 498<br />
Private Company 35 860 003<br />
Other 1 568 821<br />
National Total 179 525 396<br />
Source: Census of commercial agriculture, Statistics South Africa, 2007<br />
Figure 13 (below) illustrates the breakdown of agricultural sector assets by asset type. Farm land and<br />
fixed improvements account for approximately 56% and 19% of the sector’s asset value<br />
respectively. The remaining contributors to the agricultural sectors R179 525 million asset pool are<br />
other farming assets (11%), vehicles, machinery, equipment and tools (9%) and tractors (5%).<br />
Figure 13: Breakdown of farming asset value by asset type<br />
Fixed<br />
improvements<br />
19%<br />
Tractors<br />
5%<br />
Vehicles,<br />
machinery,<br />
equipment and<br />
tools<br />
9%<br />
Farm land<br />
56%<br />
Other assets<br />
11%<br />
Source: Census of commercial agriculture, Statistics South Africa, 2007<br />
3.1.5.4 Losses<br />
Figure 14 (below) illustrates the total losses experienced by the agricultural sector per province in<br />
2007. The industry lost approximately R2 382 million with the highest losses occurring in Free State<br />
(R384 million), Mpumalanga (R367 million) and Western Cape (R329 million). The lowest reported<br />
loss occurred in Gauteng with an estimated R100 million. Farming losses have an adverse impact on<br />
the sector’s profitability and affects individuals and small to medium enterprises to a greater degree.<br />
This is due to losses affecting their revenue and profitability whilst also increasing their insurance<br />
premiums, which further erodes their profit margin.<br />
41
Figure 14: Farming losses per province<br />
Rands million<br />
450<br />
400<br />
350<br />
300<br />
250<br />
200<br />
150<br />
100<br />
50<br />
0<br />
Source: Census of commercial agriculture, Statistics South Africa, 2007<br />
Figure 15 (below) illustrates the total losses experienced by the agricultural sector by category. As<br />
mentioned previously, the industry lost approximately R2 382 million with the highest losses<br />
occurring through natural disasters and accidents to farming products (43%), burglary (13%) and<br />
stock theft (10%).<br />
Figure 15: Farming losses by category<br />
Absence due to<br />
injury or crime<br />
4%<br />
Disasters and<br />
accidents - Other<br />
4%<br />
Disasters and<br />
accidents -<br />
Buildings/Equipme<br />
nt<br />
2%<br />
Burglary<br />
13%<br />
Predators<br />
8%<br />
Stock theft<br />
10%<br />
Other<br />
7%<br />
Disasters and<br />
accidents -<br />
Pastures<br />
9%<br />
Disasters and<br />
accidents -<br />
Products<br />
43%<br />
Source: Census of commercial agriculture, Statistics South Africa, 2007<br />
42
3.1.5.5 Gross farming income<br />
Figure 16 (below) illustrates the gross farming income for the agricultural sector by ownership type.<br />
Individuals and private companies possess the majority of the agricultural sector’s gross income with<br />
52% and 34% respectively. The income generated by private companies per farming unit is higher<br />
than that of individuals and may be attributed to the higher levels of production and greater access to<br />
export markets. Greater access to export markets could improve the gross farming income of<br />
individuals and SMME’s and provide greater competition to private companies. The remaining<br />
contributors to the agricultural sector’s R76 604 million farming income are close corporations (7%),<br />
partnerships (4%), families (2%) and government departments/public corporations (1%).<br />
Figure 16: Gross farming income by ownership type<br />
Partnership<br />
4%<br />
Private Company<br />
34%<br />
Other<br />
1%<br />
Close corporation<br />
7%<br />
Individual<br />
52%<br />
Family<br />
2%<br />
Source: Census of commercial agriculture, Statistics South Africa, 2007<br />
Figure 17 (below) illustrates the income generated through field crops (maize, wheat, sugar cane) and<br />
horticultural products (potatoes, oranges and grapes). The graph illustrates the variance between<br />
income generated in 2002 and 2007. In terms of field crops, sugar cane exhibited the highest growth<br />
with a 1.5% annual increase whilst wheat exhibited a 2.9% annual contraction. The contraction of the<br />
wheat sub-sector is attributed to the rise in cheaper wheat imports which reduced the demand for<br />
local wheat supply. Maize remains the largest income generator, within the field crop category, with<br />
approximately R8 251 million generated in 2007 compared to R7 805 million in 2002.<br />
Horticultural products generated approximately R8 982 million in income during 2007 surpassing the<br />
2002 amount of R6 885 million. Potatoes exhibited the highest growth with a 10.1% annual increase<br />
whilst grapes were the second highest exhibiting a 4.1% annual increase. Grapes remains the largest<br />
income generator, within the horticultural product range, with approximately R4 314 million<br />
generated in 2007 compared to R3 525 million in 2002.<br />
43
Figure 17: Gross income generated through field crops and horticultural products<br />
9 000<br />
8 000<br />
2002<br />
2007<br />
Rands million (real value)<br />
7 000<br />
6 000<br />
5 000<br />
4 000<br />
3 000<br />
2 000<br />
1 000<br />
0<br />
Maize Wheat Sugar Cane Potatoes Oranges Grapes<br />
Source: Census of commercial agriculture, Statistics South Africa, 2007<br />
Figure 18 (below) illustrates the income generated through selected animals and animal products.<br />
The graph illustrates the variance between income generated in 2002 and 2007. In terms of animals,<br />
“other animals” exhibited the highest growth with a 36.4% annual increase whilst sheep exhibited<br />
the lowest growth rate of 6.2% annual contraction. All other animals and beef cattle remain the<br />
largest income generators, within the animal category, with approximately R15 508 million and<br />
R13 595 million generated respectively. The largest area of opportunity lies within the poultry farming<br />
sub-sector as the demand for this commodity will rise over the coming<br />
Figure 18: Income generated from selected animal and animal products<br />
18 000<br />
16 000<br />
2002<br />
2007<br />
Rands million (Real values)<br />
14 000<br />
12 000<br />
10 000<br />
8 000<br />
6 000<br />
4 000<br />
2 000<br />
0<br />
Dairy cattle Beef cattle Sheep All other animal Animal products<br />
Source: Census of commercial agriculture, Statistics South Africa, 2007<br />
44
3.1.6 Subsector analysis<br />
3.1.6.1 Field crops<br />
The grain industry accounts for between 25% and 33% of the country’s total agricultural output and<br />
is one of the largest sectors in the local agricultural industry. 10 The Free State, Kwa-Zulu Natal and<br />
Mpumalanga are the most significant contributors to the field crop sub-sector, based on gross<br />
farming income.<br />
Summer cereals<br />
Maize is of paramount importance to the economy, accounting for 80% of the country’s planted grain<br />
crops and being the primary food source a vast majority of the South African population. Maize<br />
production comprises 60% white maize and 40% yellow maize. The use of white maize is mainly for<br />
human consumption and, barring a few African countries and Mexico, is the world’s only white maize<br />
producing country. 39 Yellow maize is used primarily in animal feed and although high prices, strained<br />
supply and competition from low-grade wheat continues to place pressure on the animal feed subsector,<br />
yellow maize should maintain its position as the primary animal feed source.<br />
The country’s maize industry is the largest on the African continent, and, although there has been a<br />
decrease in the total planted area of maize, the country’s current production levels are sufficient to<br />
ensure adequate domestic supply. Over the past few years the maize industry was able to increase<br />
their export levels due to the profitability in international markets, but the local supply is at risk of<br />
suffering if the country commits too much of its domestic production for export.<br />
There are over 9 000 commercial farmers and numerous small-scale producers of maize in South<br />
Africa that are able to meet an estimated demand of 8 million tons per annum. The Free State, North<br />
West, Mpumalanga and Kwa-Zulu Natal midlands are the main regions in which maize is grown and<br />
accounts for approximately 85% of the country’s total production. Outside of these provinces, the<br />
Northern Cape steadily increased its reputation in terms of maize production increasing output from<br />
200 000 tons per annum in 1996/1997 to 660 000 tons per annum in 2007/2008. This increase is due<br />
to the region’s stable production on irrigated land producing an estimated 8.6 tons per planted<br />
hectare.<br />
The maize season begins with planting between October and December/January with harvesting<br />
commencing from June to August/September of the following year. During this period, farmers are<br />
under considerable financial strain due to the loans they required to finance their crops. This places<br />
considerable pressure on farmers to sell some of their crops at harvest time to recover some of<br />
these costs and maintain their loan repayments. However, prices are lowest during harvest time due<br />
to the abundant supply and as such farmers may not be as profitable when compared to selling their<br />
crops at a later stage. In addition, the volatility of maize prices do not guarantee that maize prices will<br />
increase after harvest time and is another factor which places considerable pressure on farmers.<br />
In 1997, the maize industry was deregulated, culminating in the removal of the country’s Maize<br />
Board. Commodity prices have since been influenced by free market conditions and traded on the<br />
South African Futures Exchange (SAFEX) – a subdivision of the JSE’s Agricultural Products division.<br />
Despite the increased levels of domestic production, low commodity prices and high input costs have<br />
reduced farmers’ margins and there is a significant risk that farmers will reduce their production<br />
levels to remain profitable. This could have an adverse effect on domestic supply and given the<br />
current export levels, the country may need to import to maize to meet rising domestic demand.<br />
Winter cereals<br />
After maize, wheat is the most important commodity produced in the grain sector with approximately<br />
4 000 famers producing this crop. Winter cereals, such as wheat and barley, are found predominantly<br />
10 Research report on growing of cereals and other crops, Who Owns Whom, February 2010<br />
45
in winter rainfall regions such as the Western Cape and eastern regions of the Free State. South<br />
Africa is the fourth largest wheat producing nation in Africa however, only 60%-70% of domestic<br />
production is able to meet local supply.<br />
The low profitably is underlined by farmers reducing the required area to harvest wheat and in 2009<br />
the Department of Agriculture suggested that wheat production declined by 27% y-o-y due to this<br />
challenge. 11 Furthermore, abolishing the 2% import duty on wheat further reduced the attractiveness<br />
of wheat farming as local farmers were under pressure to compete against cheaper international<br />
providers.<br />
In May 2010, South Africa’s International Trade Commission made an administrative change to<br />
increase the import duties on wheat in an attempt to counteract the recent decline in domestic<br />
wheat production. This provided some relief to local farmers but the industry needs to continue<br />
improving their yields in order to be more competitive and profitable. In the past, South Africa’s<br />
improving yield was due to farmers investing in research into various seed varieties. However, a<br />
major supplier of genetically and non-genetically modified grains indicated that the market is too small<br />
to finance increased research in seed variety, which could be a shortfall for the local wheat industry. 10<br />
Oil seeds<br />
South Africa is the 10 th largest producer of sunflower seeds in the world and is grown predominantly<br />
in dry regions such as the Free State, North West, Mpumalanga Highveld and Limpopo. International<br />
prices for both soya-beans and sunflower seeds is high and the demand for these products will be<br />
linked to the demand for animal products. Given the increased demand for animals and animal<br />
products in the coming years, sunflower seeds, and soya-bean production is expected to reach 1.8<br />
million tons by 2014.<br />
The introduction of biodiesel as an alternative energy source will have a marked impact on the<br />
sunflower and soy-bean industry. Biodiesel is a diesel fuel substitute produced from renewable<br />
sources such as vegetable oils, animal fats and recycled cooking oils. Grain SA predicts that the<br />
introduction of biodiesels will create significant new markets for grain producers and would entice<br />
new entrants to the agricultural sector. The benefits of biodiesel would affect both consumers and<br />
producers. Consumers would realise the benefits through the increase seed production whilst<br />
farmers would be able to lower their input costs by producing their own biodiesel to meet their<br />
energy requirements.<br />
Sugar cane<br />
South Africa is the world’s 13 th largest producer of sugarcane and is grown in the Eastern Cape<br />
through to the midland and coastal regions of Kwa-Zulu Natal. An estimated 2.5 million tons of<br />
sugarcane is produced per annum of which approximately 60% is utilised within southern Africa and<br />
the remaining surplus is exported to the rest of Africa, the Middle East, North America, and Asia.<br />
In 1996, the sugarcane industry realised the “emerging grower programme” which encouraged<br />
previously disadvantaged individuals to own and operate their own commercial sugarcane farms.<br />
There are currently 358 emerging farmers that produced sugarcane on approximately 43 200<br />
hectares of land – 13.6% of the national total. Despite the high level of encouragement, high input<br />
costs and low sugar prices adversely affected small-scale producers and resulted in over 5 000<br />
unemployed farmers in 2009.<br />
Although the country is consistently ranked within the top 15 of the world’s leading cost-competitive<br />
producers of high-quality sugar, the local industry continues to struggle with deriving profits from<br />
exported products. This is due to the global sugar price being eroded by subsidy-induced<br />
11 SA Agribusiness Report, Business Monitor International, 2011<br />
46
overproduction in some significant sugar-producing countries. In addition, access to the international<br />
market is limited by high tariffs and preferential trade agreements and quotas. South Africa’s<br />
exclusion from preferential market access to the EU region adversely affects the country’s export<br />
potential.<br />
A potential growth area for the industry is the introduction of sugarcane-based renewable energy and<br />
this could potentially offset the negative effects of preferential trade agreements and high export<br />
tariffs. South Africa’s 5 major sugar producing companies have the potential to produce 400MW of<br />
electricity per year, by utilising ethanol as an energy source, and this could feed into the country’s<br />
current electricity grid. Eskom currently does not have any plans in place to consider co-generation<br />
with the sugar industry but the National Energy Regulator of South Africa (NERSA) have begun<br />
considering the inclusion of bio-mass in their renewable energy plans.<br />
Cotton<br />
Cotton is grown in Mpumalanga, Limpopo, Northern Cape, Kwa-Zulu Natal and the North West.<br />
Production of this commodity is highly labour-intensive with approximately 75% of domestic<br />
production being harvested by hand. The cotton industry has gradually declined with the 8 500 tons<br />
produced in 2009 being the lowest levels in over 45 years and a 90% drop in production compared to<br />
the recorded highs in 1990.<br />
The decline in cotton farming has been a direct result of the decline in prices and change in<br />
perception that cotton farming is not as profitable as other competing field crops. Subsidies by<br />
governments in many cotton producing countries eroded international cotton prices and discouraged<br />
growth in the industry. Furthermore, crops were threatened by tobacco budworms, cotton bollworms<br />
and pink bollworms. However, the creation of BT cotton (genetically modified cotton) eliminated this<br />
risk by creating a toxin which repels many of these insects.<br />
The declining trend in cotton farming does not translate into a flailing agricultural subsector, but,<br />
instead, points to potential areas of growth given the benefits of cotton farming. Cotton farming is<br />
highly suited to small-scale farming, as cotton is drought resistant and non-perishable and could<br />
provide employment opportunities due to the labour intensive nature of production. In addition, the<br />
quality of cotton produced is regarded as one of the world’s finest, in terms of removed impurities,<br />
and gives South Africa a distinct advantage in the export market.<br />
Tobacco<br />
Tobacco farming is concentrated to the North West, Mpumalanga, Limpopo, Eastern Cape and the<br />
Western Cape. Approximately 34 million kilograms of tobacco is produced by 157 farmers nationally<br />
on an estimated 4 000 hectares of land. There is favourable demand for the South African tobacco<br />
leaf, with 100% of local production secured by local tobacco product manufacturers and there is<br />
considerable interest from international countries in local production.<br />
Tobacco farming declined due to higher production costs, high tax rates and increased laws on<br />
smoking. However, farmers are returning to tobacco farming, as prices have stabilised and demand is<br />
consistent, locally and internationally. The industry aims to partner with government and government<br />
agencies to improve crop production and partner new farmers with existing commercial farmers.<br />
47
3.1.6.2 Horticultural products<br />
Vegetables<br />
Major vegetables grown in South Africa include potatoes, sweet potatoes, green mielies, sweet corn,<br />
beetroot, tomatoes, onions, pumpkins, carrots, cabbage, green beans and mushrooms. Potatoes,<br />
tomatoes, onions and cabbages are the highest commodities in terms of production amount.<br />
Potato farming is common to areas such as the Free State, Western Cape, Limpopo and Kwa-Zulu<br />
Natal. In 2010, the industry produced over 2 million metric tons of potatoes and was a significant<br />
improvement from 2009 when the industry struggled with the effects of the global economic crisis.<br />
Between 2007 and 2009, the planted hectares for potatoes decreased by approximately 17%<br />
resulting in output decreasing from 1.9 million tons to 1.85 million tons.12 Potatoes South Africa<br />
manages the interests of enterprises in the potato industry. Their objective is to manage and develop<br />
the industry as well as assist enterprises to attract new talent and develop existing employees. The<br />
potential for other sectors to set up similar bodies, exist.<br />
Tomatoes are an integral part of South Africa’s vegetable industry with over 400 000 metric tons sold<br />
in 2007. A large proportion of the commodity is sold as fresh produce while the remainder is<br />
processed. 13 Limpopo, Eastern Cape and Western Cape are common areas for tomato farming due<br />
to the climatic and soil conditions necessary to produce high quality crops. A warm climate with daily<br />
temperatures ranging from 20°C to 24°C, in conjunction with fertile and moisture retentive soil,<br />
promotes high quality tomato growing. One of the key risk factors for tomato farmers are the<br />
occurrence and prevention of diseases. Farmers need to be aware of the preventative and treatment<br />
measures for various diseases in order to avoid significant crop losses.<br />
Onion farming is common to the Western Cape, Limpopo and Mpumalanga regions with<br />
approximately 280 000 tons produced on 9 000 hectares of planted land in 2007. Cabbage<br />
production, other than potatoes, tomatoes and onions, is one of the country’s highest produced<br />
vegetable. Farming of this commodity occurs mainly in Mpumalanga and Kwa-Zulu Natal.<br />
Citrus fruit<br />
The citrus industry in South Africa began as early as the 1654 with the first settlers planting the first<br />
citrus tree in the Western Cape. Over the years, the industry grew substantially and currently<br />
contributes over R2 billion to the agricultural sector, which represents approximately 4.5% of the<br />
agricultural sector’s gross value of production. 14 The southern African region only produces 1.5% of<br />
the world’s citrus fruits but it is the third largest export of these commodities in the world behind<br />
Spain and the USA.<br />
Citrus farming occurs in the irrigated regions of Limpopo, Mpumalanga, the Eastern Cape, Western<br />
Cape and KwaZulu-Natal and includes commodities such as oranges, lemons and naartjies. Oranges<br />
are the most important citrus fruit accounting for over 65% of the country’s citrus farming gross<br />
income. The industry possesses approximately 1 300 export farmers and 2 200 small farmers that<br />
meet the requirements of domestic demand. The industry employs approximately 100 000 workers<br />
due to the labour intensive nature of citrus farming whilst a further study indicates that export<br />
farming creates four jobs for every hectare farmed. 13<br />
Citrus farming is successful in a wide range of climatic conditions with the exception of frost prone<br />
regions. Furthermore, citrus fruit thrive in most, if not all, soil type provided that the soil is welldrained<br />
and there are sufficient irrigation facilities. Citrus farming in South Africa is geared towards<br />
the export due to the attractiveness of the market but this market is highly exposed to competition.<br />
12 http://www.potatoes.co.za<br />
13 http://www.kzndae.gov.za<br />
14 http://www.daff.gov.za/docs/FactSheet/citrus_profile.pdf<br />
48
Given the substantial level of competition, enterprises and farmers need to be cost competitive and<br />
produce high quality products that comply with international sanitary standards and may be cost<br />
intensive for smaller farmers entering the market.<br />
Subtropical fruit<br />
The growing of subtropical fruits is a cost intensive industry and requires careful planning to ensure<br />
that farmers remain profitable, as not all crops are early bearing and may require considerable<br />
investment for a number of seasons. Subtropical fruits grown in South Africa include avocados,<br />
mangoes, litchis, bananas, guavas, papaya and granadillas.<br />
Mpumalanga, Limpopo and the sub-tropical regions of Kwa-Zulu Natal and the Eastern Cape are<br />
regions suited to growing these subtropical fruits. These commodities thrive in climates where the<br />
mean temperatures in winter remain between 13°C and 18°C and there are distinct periods of<br />
rainfall. These crops are able to survive in frost however; prolonged and sever levels of frost can be<br />
extremely detrimental to these crop types.<br />
Deciduous fruit and viticulture<br />
Deciduous fruits and grapes are suited to a Mediterranean climate with winter rainfall and dry<br />
summer periods. Given the below average temperatures required for these crops, deciduous fruits<br />
thrive in the Western Cape and Eastern Cape regions. There are also smaller production levels along<br />
the Orange River in the Free State, Mpumalanga and Gauteng. Deciduous fruit exports account for<br />
approximately 12% of the country’s total agricultural earnings and is a significant component of the<br />
sector.<br />
In terms of viticulture, South Africa is the ninth largest producer in the world and cultivates over<br />
110 000 hectares of land and over 300 million vines. Approximately 4 000 primary wine producers<br />
employ over 60 000 workers and an estimated 84% of this labour force work for cooperatives. South<br />
Africa’s wine exports rose significantly over a 15 year period beginning at 22 million litres in 1992 to<br />
314 million litres in 2007.<br />
One of the major inhibitors for small-scale farmers is the access to modern technology to harvest<br />
these commodities on a large scale. This includes aspects such as irrigation, fertilisation and weed<br />
control as well as disease and pest control. Technology is a critical aspect in the value-adding chain<br />
for the deciduous fruit and viticulture sector, as it allows South African farmers to be competitive in<br />
international markets albeit at a higher investment cost.<br />
Flowers<br />
Ornamental plants are produced throughout South Africa, with flowers cultivated for export<br />
concentrated to Limpopo, Mpumalanga and Gauteng. Crops grown in South Africa include nursery<br />
plants, cut flowers and pot plants with the most important flowers for export being gladioli, proteas,<br />
bulbs, chrysanthemum cuttings, roses and amaryllis bulbs. 15<br />
In addition to ornamental plants, the country boasts a large fynbos industry, which transitioned from<br />
wild harvesting to cultivation over the past few years. There is significant growth potential in the<br />
fynbos industry. However, the sector requires further research funding to investigate further fynbos<br />
species. The fynbos industry also incorporates a large variety of dried flowers such as proteas and<br />
conebushes that are well established in the market place. 14<br />
15 http://www.southafrica.info/business/economy/sectors/542547.htm<br />
49
3.1.6.3 Animals and animal products<br />
The livestock sector in South Africa contributes over 40% to the agricultural sector and has the<br />
potential to contribute to economic growth in rural areas as well as meet governmental objectives<br />
and targets. Climatic conditions, vegetation and soil composition are the principal factors in<br />
determining the locale of livestock farming in South Africa. Livestock farming is suitable for<br />
approximately 80% of the country’s agricultural land and as a result farmers combine their crop<br />
farming with the breeding and cultivation of livestock.<br />
Poultry and ostrich<br />
Mpumalanga, Gauteng, Western Cape and North West are the leading provinces in terms of the<br />
number of poultry and ostriches sold. Poultry is fast becoming a” convenience” food among<br />
consumers with a larger number of health conscious and time-poor consumers opting for poultry as<br />
opposed to red meat. This growing trend will spur the demand for poultry by an estimated 23% over<br />
the next 5 years.<br />
Although there is a strong demand for poultry, major poultry producers reported that the current<br />
economic environment is placing significant strain on the industry. Weak economic growth, high<br />
levels of unemployment and a strong rand encouraged the influx of cheap poultry imports, which<br />
further eroded domestic companies’ profitability. However, the future of poultry farming is promising<br />
with strong forecasts for GDP per capital and declining unemployment expected to contribute to a<br />
19.8% growth in supply over the next 5 years. 16<br />
Despite promising growth forecasts for the industry, there is a risk that rising feed stock prices may<br />
deter growth as corn and soybean prices are expected to remain high and volatile over the next 5<br />
years. Furthermore, an outbreak of avian flu resulted in the temporary suspension of ostrich and<br />
ostrich product exports to Asia and Europe. Given the ostrich industry’s size domestically, the<br />
suspension in exports did not have a detrimental effect on the sector. However; the avian flu<br />
epidemic could have a much larger effect on the poultry industry and as such is a risk to future<br />
supply.<br />
Sheep and cattle<br />
The South African red meat industry comprises a large-scale commercial production and a small-scale<br />
communal farming sector existing predominantly in rural areas. The Northern Cape, Free State,<br />
Western Cape and the Eastern Cape are the leading provinces in terms of the number of sheep and<br />
cattle sold. South Africa is a net importer of red meat and is able to satisfy approximately 85% of<br />
domestic demand through local production channels. However, there is untapped potential in the<br />
communal farming industry.<br />
Commercial farmers possess 8.7 million cattle and 25.4 million sheep compared to the 4.7 million<br />
cattle and 3.4 million sheep found in communal and rural areas. This disparity illustrates the<br />
competitive advantage, which commercial farmers have within the livestock sector. Furthermore,<br />
approximately 40% of the country’s cattle belong to emerging farmers and communal farms and only<br />
5% of these are sold through formal marketing channels. This presents an area of opportunity for<br />
emerging and communal farmers. However, a lack of information to these farmers inhibits their<br />
ability to market their products commercially.<br />
The livestock industry is a critical component to achieving this target as it contributes approximately<br />
44% of the agricultural sector’s gross income. Although there have been efforts to improve the<br />
technical support to some emerging farmers, there are still numerous small-scale farmers that do not<br />
possess the relevant research and market information necessary to commercialise their products.<br />
Furthermore, emerging and communal farmers face many challenges in trying to competing with<br />
commercial farmers that are well established in the market place. Backlogs of financing through<br />
financial institutions, rising feed stock prices, availability of land and the opening of the market for<br />
their products have been a major hindrance to these farmers. There are currently a number of<br />
16 South Africa Agribusiness Report, Business Monitor International, 2011<br />
50
initiatives to counteract the financial constraints experienced by many of these farmers such as the<br />
initiatives provided by MAFISA and Khula <strong>Enterprise</strong> Finance. However, these initiatives are still in its<br />
infancy and although they provide farmers which access to loans, the repayments and interest rates<br />
are too high for many of the communal farmers.<br />
51
3.2 Availability of supporting infrastructure<br />
3.2.1 Availability of transport infrastructure<br />
South Africa’s transport infrastructure is modern and well developed when compared to other<br />
developing countries on the continent. The government highlighted the transport sector as one of the<br />
key contributors to South Africa’s competitiveness in global markets and it is increasingly crucial in<br />
driving economic growth and social development. The road and rail sub-sectors are vital in the<br />
transport of agricultural commodities on a regional level whilst air freight and shipping’s role is limited<br />
to transporting agricultural products to and from international markets. The demand for rail and road<br />
freight grew by over 50% over the last 11 years however; the sector is unable to meet this demand<br />
due to dilapidated infrastructure. Given the importance of the transport sector, the government<br />
continues to identify areas of investment in transport infrastructure to meet the growing demand of<br />
logistic services. 17<br />
3.2.1.1 Road infrastructure<br />
South Africa has the largest road network in Africa, of approximately 754 000 kilometres; of which<br />
70 000 kilometres is either paved or surfaced. Figure 19 (below) illustrates the major road<br />
infrastructure in South Africa that connects the country’s main commercial hubs. Minibus taxis<br />
account for 65% of the estimated 2.5 billion annual passenger trips, in urban areas, as well as a large<br />
proportion of rural and intercity journeys. Bus and railway services account for the remaining 35% of<br />
annual passenger trips with 21% and 14% respectively. 9<br />
The government aims to invest R70 billion in road infrastructure over the next 3 years for<br />
maintenance and upgrading as well as an additional R3 billion for the Expanded Public Works<br />
Programme for access roads. This investment aims to alleviate traffic congestion, improve the quality<br />
of roads and enhance job creation in the country. 9<br />
With statistics indicating that only 26% of households in South Africa have access to a motor car, car<br />
ownership in South Africa remains in its early growth phase and should increase significantly over the<br />
next decade. 18 Coupled with the country’s future population growth and rate of urbanisation;<br />
alleviating traffic congestion would more essential in the future.<br />
Figure 19: Major road infrastructure in South Africa<br />
Source: www.sa-venues.com/maps/default.htm<br />
17 www.southafrica,info/business/economy/infrastructure/transport.html<br />
18 National Household Survey, 2003, Statistics SA<br />
52
3.2.1.2 Railway infrastructure<br />
Passenger rail infrastructure and freight rail infrastructure are the two distinct categories of the South<br />
African railway industry. In 1990, the government established the South African Rail Commuter<br />
Corporation (SARCC), now known as the Public Rail Association of South Africa (PRASA), as a<br />
concessionaire to establish and monitor service standards, safety and security levels, and operating<br />
efficiencies of passenger rail services. The transfer of the country’s local passenger railway service<br />
(Metrorail) and long distance carrier (Shosoloza Meyl) from Transnet to the SARCC concluded in 2006<br />
and 2008 respectively.<br />
Although an estimated 1.7 million people use railway transportation on a daily basis, this form of<br />
transportation has been on the decline over the past few years. Declining levels of safety and<br />
security, dilapidated infrastructure and unreliable train schedules contributed to the population shift<br />
toward minibus taxis and bus transportation. The government’s aims to rectify this situation are<br />
evident in the overhauling and upgrading of the country’s ageing locomotive and railway<br />
infrastructure. Trains remain the one of the country’s cheapest modes of transportation, due to<br />
subsidisation, and this upgrade could result in a resurgence of future rail passenger numbers.<br />
Transnet is the country’s sole freight rail provider with approximately 20 247 kilometres of rail<br />
network of which 1 500 comprise heavy lines. This infrastructure constitutes approximately 80% of<br />
the country’s total rail infrastructure and connects the major ports and commercial hubs as well as<br />
the rail networks of other Sub-Saharan countries. Transnet offers freight logistic services to<br />
customers in numerous industries but their focus lies in the transportation of goods and commodities<br />
for the mining, manufacturing, agriculture, and automotive sectors. 11 In 2008, Transnet transported a<br />
variety of grains, sunflower baled and seed cotton as part of the 82 million tons of general freight<br />
transported. 19<br />
3.2.1.3 Aviation transport<br />
Airports Company South Africa (ACSA) currently own and operate 10 of the country’s airports and<br />
handles over 98% of the region’s commercial air traffic. The country has 3 major airports namely; OR<br />
Tambo International Airport (Johannesburg), King Shaka International Airport (Durban) and Cape Town<br />
International Airport. The aviation sector is critical to the transport sector, and the economy, with an<br />
estimated 43 million flights per year in 2010. 20<br />
Passenger numbers have increased significantly, from the 32 million passengers per year recorded in<br />
2006, and this trend should continue over the next few years with the emergence of low cost carriers<br />
providing a cost effective form of transportation to a larger portion of the population. Furthermore,<br />
airfreight has become increasingly popular for the transport of time-sensitive agricultural commodities<br />
such as flowers. However, since airfreight is still within its infancy in South Africa, the cost of air<br />
travel is high and is not profitable for individuals and SMME’s.<br />
Significant investment in the upgrade and expansion of aviation infrastructure underlines the<br />
government’s aim to cope with future growth and demand and could see the costs of airfreight<br />
reduced through economies of scale. This could further promote airfreight as a mode of transporting<br />
agricultural commodities to individuals and small to medium enterprise farmers.<br />
3.2.1.4 Ports and shipping infrastructure<br />
Major shipping lanes envelope the country’s South Atlantic and Indian Ocean coastlines with the<br />
country’s ports being the primarily channels of trade between other African countries, the Americas,<br />
Europe and Asia. Currently shipping is the primary mode of transportation for approximately 96% of<br />
the country’s exported commodities across eight commercial ports.<br />
The newest commercial port is the port of Ngqura in Port Elizabeth and is the deepest cargo terminal<br />
in Africa as well as being vital to Coega – one of the country’s strategic industrial development zones.<br />
In addition to Ngqura’s global standing, Durban is the busiest port in Africa and Richard’s Bay is the<br />
19 http://www.agbiz.co.za/LinkClick.aspx?fileticket=T7CUfS5SDQA%3D&tabid=113<br />
20 www.southafrica,info/business/economy/infrastructure/transport.html<br />
53
largest bulk coal terminal in the world. Transnet’s plans to invest in upgrading several of the country’s<br />
commercial ports, in a multi-billion rand programme, advocates their view of the market’s future<br />
potential.<br />
3.2.2 Availability of water<br />
On a global level, there is a significant level of pressure on water, energy, and food resources with<br />
this being exacerbated by increases in population, urbanisation, and consumption over the next few<br />
decades. Climate change is an important factor for consideration as it affects water supply, energy<br />
supply and food security.<br />
Figure 20 (below) illustrates the linkage between these elements and provides both key supply and<br />
demand figures for water, energy and food security.<br />
Water is an essential resource to sustaining life and with no viable substitute, the topic of water<br />
security becomes vital. Water security is central to economic growth and development, energy<br />
generation and food security. Despite its various uses and essential role in an economy, the price of<br />
water does not reflect the underlying value that we derive from the resource. Food security is highly<br />
dependent on the availability and supply of water. Increasing pressure on the supply and availability of<br />
water will adversely affect the food security with the volatility in global food prices, over the past few<br />
years, testament to this.<br />
Figure 20: Linkage between water supply, energy supply and food security<br />
Water<br />
Global demand<br />
for water<br />
projected to<br />
outstrip supply<br />
by 40 % by<br />
2030<br />
Food security<br />
Over 900<br />
million people<br />
currently<br />
undernourished<br />
Climate<br />
change<br />
Global primary<br />
energy<br />
demand<br />
projected to<br />
increase by 50<br />
% by 2030<br />
Energy<br />
Source: 2030 Water Resource Group, International Energy <strong>Agency</strong>, 2006<br />
South Africa is currently classified as a ‘water stressed’ country due primarily to the country’s climatic<br />
conditions and human settlement patterns. The country’s relatively low annual rainfall and high<br />
evaporation rates result in only 8% of SA’s rainfall being converted to runoff, which places pressure<br />
on the nation’s water supply. The effects of climate change will directly affect water resources in<br />
South Africa and considering that the country is currently “water stressed,” this topic will be of<br />
particular importance in the future.<br />
54
Figure 21: Water scarcity index<br />
Source: Smakhtin, Revenga and Doll, 2004<br />
South Africa is currently segregated into 19 water management areas as illustrated in Figure 22 with<br />
the water balances for each of the regions provided in Figure 21Error! Reference source not found..<br />
Figure 22: Water Management Areas in South Africa<br />
Source: SANBI, Working for Wetlands, 2007<br />
Figure 23: Water balances for the 19 water management areas in South Africa<br />
55
Water Management Areas (WMAs)<br />
Mzimvubu to Keiskamma<br />
Upper Orange<br />
Usutu to Mhlatuze<br />
Fish to Tsitsikamma<br />
CW&M<br />
Breede<br />
Lower Vaal<br />
Upper Vaal<br />
Middle Vaal<br />
Berg<br />
Lower Orange<br />
Limpopo<br />
Olifants/Doring<br />
Luvuvhu/Letaba<br />
Gouritz<br />
Thukela<br />
Olifants<br />
Mvoti to Umzimkulu<br />
Inkomati<br />
-241<br />
-258<br />
-194<br />
-103<br />
-5<br />
-9<br />
-23<br />
-35<br />
-36<br />
-63<br />
41<br />
38<br />
31<br />
17<br />
8<br />
95<br />
332<br />
319<br />
480<br />
-300 -200 -100 0 100 200 300 400 500 600<br />
millions m3/a<br />
Source: DWA, 2005<br />
In addition to the state of the country’s current water supply, there are also potential risks to future<br />
water availability and supply. South Africa’s water infrastructure is ageing and in a very poor condition<br />
due to current maintenance backlogs amounting to approximately R10 billion. Rand Water estimates<br />
that approximately 17% of all water is lost through leakages that are caused by eroded infrastructure.<br />
An inability to rectify these maintenance backlogs or upgrade the country’s water infrastructure could<br />
place significantly more pressure on water availability and supply.<br />
3.2.3 Electricity costs and supply<br />
3.2.3.1 Electricity costs<br />
Rising electricity prices will become a prominent feature of the South African economy for various<br />
reasons. Historically, artificially low electricity prices reflected a the operational costs of the electricity<br />
provider and did not factor in the full capital, operating, maintenance, administration and replacement<br />
costs, which led to a long period significant under-investment. This resulted in a fundamental policy<br />
shift toward cost reflective pricing, in South Africa, to finance future capacity build and maintenance<br />
programmes.<br />
The move toward cost reflective electricity pricing resulted in the Nation Energy Regulator of South<br />
Africa approving a set of increases between 2010 and 2013 (MYPD2 period) which would almost<br />
double electricity tariffs over a 4 year period. Increasing electricity tariffs are likely to continue as<br />
Eskom estimates that the justifiable cost reflective tariff should be approximately 80-88c/kWh<br />
compared to the 2010 tariff of approximately 39c/kWh.<br />
Figure 24 (below) illustrates the recommended electricity tariff path defined by the IRP2010. The<br />
justifiable price “zone” is Eskom’s recommended tariff path, which will allow South Africa to<br />
complete economically whilst allowing the company to manage their future investment plans.<br />
56
Figure 24: Historical and forecast electricity tariff in c/kWh<br />
135<br />
115<br />
c/kWh (2009 Real)<br />
95<br />
75<br />
55<br />
35<br />
15<br />
1970 1975 1980 1985 1990 1995 2000 2005 2010 2015 2020 2025 2030<br />
Source: Towards a justifiable electricity price path, Frost and Sullivan, January 2011<br />
Another reason for the introduction of electricity price increases is the shift toward more expensive,<br />
low carbon technologies, such as renewable energy and nuclear. The Integrated Resource Plan<br />
(IRP2010) favours the introduction of this technology, in future capacity build programmes, to ensure<br />
a sustainable, low carbon energy supply. Coal is a dominant feature of the country’s current<br />
electricity mix with 90% of the market but by 2030, coal usage is expected to decrease to 70%<br />
making way for nuclear technology (20%) and renewable energy (9%).<br />
The third reason for the rise in South Africa’s electricity prices relates to the national goals of<br />
economic development and poverty alleviation. In this regard, electricity policy increasingly advocates<br />
cross-subsidisation of electricity costs to reduce the effect of rising electricity prices on the poor. This<br />
is likely to be done through inclining block rate tariffs, which assign higher rates to the largest<br />
electricity consumers.<br />
3.2.3.2 Electricity supply<br />
Peak electricity reached its highest levels in 2007 but with Eskom suffering significant power<br />
shortages between 2008 and 2009, electricity consumption declined during these periods. Electricity<br />
consumption declined further as a result of the global economic recession in 2009 but the economic<br />
recovery saw 2010 consumption reach comparable figures to 2007 peak consumption levels.<br />
57
Figure 25: Electricity consumption levels from 2004 to 2010<br />
37 000<br />
35 000<br />
33 000<br />
MW<br />
31 000<br />
29 000<br />
27 000<br />
25 000<br />
23 000<br />
1 3 5 7 9 11 13 15 17 19 21 23 25 27 29 31 33 35 37 39 41 43 45 47 49 51 53<br />
Week No<br />
2004 2005 2006 2007 2008 2009 2010<br />
Source: Towards a justifiable electricity price path, Frost and Sullivan, January 2011<br />
Currently Eskom’s capacity will not be able to handle any additional demand beyond that experienced<br />
in 2007 and 2010. Given the government’s accelerated growth plans through IPAP2, future supply<br />
disruptions in energy intensive sectors could result in lower than expected growth. Eskom are in the<br />
process of implementing 2 base-load projects, in the Medupi and Kusile power stations, to bolster<br />
the future supply capacity.<br />
The commissioning of the Medupi Power Station units should occur in 9 month intervals between<br />
2012 and 2015 which is in line with international practice. The Kusile Power Station, once completed,<br />
will be the second most advanced power station in the country after Medupi. The power station will<br />
comprise 8 units of 800MW each which, once fully installed in 2015, will possess a combined<br />
capacity of 4,800MW.<br />
58
3.3 Analysis of imported and exported agricultural commodities<br />
South Africa’s total agricultural exports increased by approximately 245% over a 13 year period<br />
translating to an average annual increase of 18.9%. Similarly, South Africa’s import rose by an<br />
estimated 290% over the same period with an annual growth rate of 22.3%. South Africa’s export<br />
trade levels rose significantly in 2008 as international consumer demand, particularly from Asia,<br />
elevated the demand for agricultural commodities. The effects of the global economic recession<br />
underline the constant levels of exported commodities between 2008 and 2010, as the demand for<br />
these commodities dwindled.<br />
Figure 26: South Africa’s total agricultural imports and exports between 1998 and 2010<br />
50<br />
45<br />
Export<br />
Import<br />
40<br />
35<br />
Rands billion<br />
30<br />
25<br />
20<br />
15<br />
10<br />
5<br />
0<br />
1998 1999 2000 2001 2002 2003 2004 2005 2006 2007 2008 2009 2010<br />
Note: Trade data represented above does not include forestry and fisheries<br />
Source: Department of Agriculture, Forestry and Fisheries<br />
3.3.1 Exported commodities<br />
Table 6 illustrates South Africa’s top 10 export markets, based on their share of the country’s total<br />
agricultural exports, as well as the top three commodities exported to each region. The Netherlands<br />
became the country’s leading export destination for agricultural commodities in 2010, overtaking the<br />
United Kingdom who held this position the previous year.<br />
Table 6: Comparison between South Africa's major export countries in 2009 and 2010<br />
2009 Calendar Year 2010 Calendar Year<br />
Major export<br />
markets<br />
Share in SA<br />
total agric.<br />
exports<br />
Export<br />
Value<br />
Major export<br />
markets<br />
Share in SA<br />
total agric.<br />
exports<br />
Export<br />
Value<br />
Change in<br />
ranking<br />
Top 3 agricultural<br />
products exported<br />
UK 10% 4.7 Netherlands 11% 5.1 <br />
Netherlands 10% 4.6 UK 9% 4.4 <br />
Zimbabwe 8% 3.6 Zimbabwe 8% 3.6 -<br />
Grapes, oranges,<br />
grape wine<br />
Grape wines, grapes<br />
and apples<br />
Sunflower seeds<br />
and oils, wheat and<br />
sugar<br />
59
2009 Calendar Year 2010 Calendar Year<br />
Major export<br />
markets<br />
Share in SA<br />
total agric.<br />
exports<br />
Export<br />
Value<br />
Major export<br />
markets<br />
Share in SA<br />
total agric.<br />
exports<br />
Export<br />
Value<br />
Change in<br />
ranking<br />
Top 3 agricultural<br />
products exported<br />
Kenya 6% 2.8 Mozambique 6% 2.9 <br />
Mozambique 4% 2.1 Germany 4% 1.9 <br />
Germany 4% 1.9 USA 3% 1.6 <br />
USA 3% 1.6 Japan 3% 1.5 <br />
Angola 3% 1.5 UAE 3% 1.3 <br />
UAE 3% 1.4 Angola 3% 1.3 <br />
China 2% 1.3 China 3% 1.2 -<br />
Ethyl alcohol, sugar<br />
and food<br />
preparations<br />
Grape wines, meat<br />
and grapes<br />
Grape wines,<br />
oranges and<br />
macadamia nuts<br />
Sugar, grape fruit<br />
and maize<br />
Oranges, Grapes<br />
and Apples<br />
Fermented<br />
beverages,<br />
cigarettes and<br />
whisky<br />
Wool, Fish meal<br />
flour and grape wine<br />
Note: Export value is in Rand billions<br />
Source: Department of Agriculture, Forestry and Fisheries<br />
Table 7 is an extension of the above table and depicts the three highest export growth markets and<br />
shrinking markets. The highest export growth markets are Mozambique, Japan and the Netherlands<br />
with a growth rate of 41%, 18% and 12% respectively between 2009 and 2010. Ethyl alcohol<br />
exports rose by 2 147% in 2010 with increased demand from Mozambique with groundnuts (61%)<br />
and avocados (53%) being the highest growing commodities for Japan and the Netherlands. Angola,<br />
China and the UK comprise the country’s top 3 shrinking export markets with an annual contraction in<br />
exports of 12%, 7% and 6% respectively. Declining demand for refined sugar, wool and fruit<br />
preparations, in Angola, China and the UK respectively, contributed to the contraction in exports to<br />
these countries.<br />
Table 7: Identification of growing and shrinking export markets and commodities<br />
Growing export market<br />
Ranking<br />
Growing Market<br />
Total export<br />
growth<br />
Top 3 products driving total export growth and their individual<br />
growth percentage<br />
1 Mozambique 41%<br />
Ethyl alcohol<br />
(2147%)<br />
Cigarettes<br />
(136%)<br />
Whiskey<br />
(75%)<br />
2 Japan 18%<br />
Ground nuts<br />
(61%)<br />
Pears<br />
(60%)<br />
Oranges<br />
(37%)<br />
3 Netherlands 12%<br />
Avocados<br />
(53%)<br />
Oranges<br />
(52%)<br />
Macadamia<br />
(27%)<br />
Shrinking export market<br />
Ranking<br />
Growing Market<br />
Total export<br />
growth<br />
Top 3 products driving total export shrinkage and their<br />
individual shrinkage percentage<br />
1 Angola -12%<br />
Refined sugar<br />
(-66%)<br />
Yoghurt<br />
(-62%)<br />
Maize meal<br />
(-44%)<br />
60
Growing export market<br />
Ranking<br />
Growing Market<br />
Total export<br />
growth<br />
Top 3 products driving total export growth and their individual<br />
growth percentage<br />
2 China -7%<br />
Wool<br />
(-49%)<br />
Grape wines<br />
(-31%)<br />
Animal skins<br />
(-28%)<br />
3 UK -6%<br />
Fruit preps<br />
(-32%)<br />
Grape wines<br />
(-25%)<br />
Apples<br />
(-18%)<br />
Source: Department of Agriculture, Forestry and Fisheries<br />
3.3.2 Imported commodities<br />
Table 8 illustrates South Africa’s top 10 import markets, based on their share of the country’s total<br />
agricultural exports, as well as the top three commodities exported to each region. Argentina,<br />
Thailand and Brazil are the countries primary import countries. However, their share of the country’s<br />
total agricultural imports declined by approximately 2%, for each country, between 2009 and 2010.<br />
Table 8: Comparison between South Africa's major import countries between 2009 and 2010<br />
2009 Calendar Year 2010 Calendar Year<br />
Major import<br />
markets<br />
Share in SA<br />
total agric.<br />
imports<br />
Import<br />
Value<br />
Major import<br />
markets<br />
Share in SA<br />
total agric.<br />
imports<br />
Import<br />
Value<br />
Change in<br />
ranking<br />
Top 3 agricultural<br />
products imported<br />
Argentina 14% 5.1 Argentina 12% 4.3 -<br />
Thailand 11% 4 Thailand 9% 3.4 -<br />
Brazil 9% 3.5 Brazil 7% 2.7 -<br />
China 6% 2.2 Germany 7% 2.5 <br />
Germany 6% 2.1 China 6% 2.2 <br />
UK 5% 1.8 UK 6% 2.1 -<br />
Netherlands 5% 1.7 USA 5% 1.9 <br />
Malaysia 4% 1.6 Malaysia 5% 1.8 -<br />
USA 4% 1.4 Netherlands 4% 1.4 <br />
Indonesia 4% 1.3 Indonesia 4% 1.4 -<br />
Soybean, Sunflower<br />
Seeds and Oils and<br />
Chicken Meat<br />
Rice, Fish, Cereals<br />
and Starches<br />
Chicken Meat,<br />
Tobacco and Sugar<br />
Wheat, Soybean Oils<br />
and Swine Meat<br />
Beans, Animal Offal<br />
and Apple Juice<br />
Whiskies, Rum and<br />
Tafia and Food<br />
Preparations<br />
Wheat, Food<br />
Preparations, and<br />
Whiskies<br />
Palm Oil, Cocoa<br />
Butter and<br />
Vegetable Fats and<br />
Oils<br />
Soya-Bean Oils,<br />
Food Preparations<br />
and Malt Beer<br />
Palm Oil, Coffee and<br />
Cocoa Powder<br />
Note: Import value is in Rand billions<br />
Source: Agricultural Trade Performance Review, Department of Agriculture, Forestry and Fisheries<br />
Table 9 is an extension of the above table and depicts the three highest import growth markets and<br />
shrinking markets. The highest import growth markets are the USA, Germany and the UK with a<br />
61
growth rate of 35%, 17% and 16% respectively between 2009 and 2010. Wheat imports, from the<br />
USA, rose by 512% in 2010 to meet rising local demand with pork (132%) and meat flour (65%)<br />
being the highest growing commodities from Germany and the UK. Brazil, Netherlands and Thailand<br />
comprise the country’s top 3 shrinking import markets with an annual contraction in imports of 24%,<br />
18% and 16% respectively. Declining demand for tobacco, malt beer and sardines contributed to the<br />
contraction in imports from these countries.<br />
Table 9: Identification of growing and shrinking import markets and commodities<br />
Growing import market<br />
Ranking<br />
Growing Market<br />
Total import<br />
growth<br />
Top 3 products driving total import growth and their individual<br />
growth percentage<br />
1 USA 35%<br />
Wheat<br />
(512%)<br />
Animal Offal<br />
(16%)<br />
Food stuffs<br />
(5%)<br />
2 Germany 17%<br />
Swine meat<br />
(132%)<br />
Coffee extracts<br />
(21%)<br />
Food stuffs<br />
(1%)<br />
3 UK 16%<br />
Meat Flour<br />
(65%)<br />
Confectionary<br />
(30%)<br />
Oats and flakes<br />
(27%)<br />
Shrinking import market<br />
Ranking<br />
Growing Market<br />
Total import<br />
growth<br />
Top 3 products driving total import shrinkage and their<br />
individual shrinkage percentage<br />
1 Brazil -24%<br />
Tobacco<br />
(-51%)<br />
Raw sugar<br />
(-47%)<br />
Refined sugar<br />
(-23%)<br />
2 Netherlands -18%<br />
Malt beer<br />
(-90%)<br />
Bulbs/Tubers<br />
(-17%)<br />
Food stuffs<br />
(-13%)<br />
3 Thailand -16%<br />
Sardines<br />
(-37%)<br />
Tuna<br />
(-14%)<br />
Rice<br />
(-13%)<br />
Source: Agricultural Trade Performance Review, Department of Agriculture, Forestry and Fisheries<br />
62
3.4 Future outlook for the sector<br />
Over a 5-year period, consumption growth within most agricultural segments in South Africa is<br />
expected to be driven by rising living standards and a decrease in unemployment. The demand for<br />
rice, pork, beef, and poultry is also expected to be notably strong. 21<br />
3.4.1 Field crops 21<br />
Growth forecast for maize production is supported by the introduction of new maize varieties that will<br />
generate increased crop yields and an improved economic outlook. Forecasts for maize production<br />
indicate growth of 1.57% over 5 years between 2011 and 2015.<br />
The increase in the demand for maize is partly due to its use as a source of animal feed, which will be<br />
a strong component of maize demand. White maize used for human consumption will gradually level<br />
off in the long term as households move away from maize as part of greater diet diversification. The<br />
demand for maize is expected to grow by 16.2% in 5 years between 2011 and 2015.<br />
Figure 27: Maize production and consumption forecast estimates (‘000 tonnes)<br />
14 000<br />
12 000<br />
10 000<br />
8 000<br />
6 000<br />
4 000<br />
2 000<br />
0<br />
2011 F 2012 F 2013 F 2014 F 2015 F<br />
Production<br />
Consumption<br />
Source: BMI South African Agribusiness Report Q4 2011<br />
The long-term growth in wheat is expected to benefit from the introduction of new seed varieties and<br />
from the implementation of new import duties. An oversupply of maize would also benefit wheat<br />
production as farmers will dedicate additional land to wheat cultivation. Wheat production is forecast<br />
to experience positive, albeit moderate growth of 35.4% over the 5 year forecast period.<br />
The demand for wheat is expected to be underpinned by an expanding population, increase in<br />
domestic supply and rising living standards. Most of the country’s consumption need will have to be<br />
met by imports, even though wheat is forecast to growth in production.<br />
21 BMI South Africa Agribusiness Report Q4 2011<br />
63
Figure 28: Wheat production and consumption forecast estimates (‘000 tonnes)<br />
3 500.00<br />
3 000.00<br />
2 500.00<br />
2 000.00<br />
1 500.00<br />
1 000.00<br />
500.00<br />
0.00<br />
2011 F 2012 F 2013 F 2014 F 2015 F<br />
Production<br />
Consumption<br />
Source: BMI South African Agribusiness Report Q4 2011<br />
Used for human consumption and animal feed, Sorghum demand will roughly correlate with<br />
expected growth trends while sorghum production is expected to contract by 3.3% over the 5 year<br />
forecast period.<br />
Figure 29: Sorghum production and consumption forecast estimates (‘000 tonnes)<br />
250<br />
200<br />
150<br />
100<br />
50<br />
0<br />
2011 F 2012 F 2013 F 2014 F 2015 F<br />
Production<br />
Consumption<br />
Source: BMI South African Agribusiness Report Q4 2011<br />
The production of barley is expected to experience a moderate increase of 2.5% over between 2012<br />
and 2015. This is mainly due to higher prices in the area of barley cultivation. With relative flat growth<br />
expected for barely demand over the forecast period.<br />
64
Figure 30: Barley production and consumption forecast estimates (‘000 tonnes)<br />
350<br />
300<br />
250<br />
200<br />
150<br />
100<br />
50<br />
0<br />
2011 F 2012 F 2013 F 2014 F 2015 F<br />
Production<br />
Consumption<br />
Source: BMI South African Agribusiness Report Q4 2011<br />
3.4.2 Horticultural<br />
Because of improved macroeconomic fundamentals and the increased use of sugar as an alternative<br />
energy source, long-term growth growth is expected in sugar production. Over the medium term,<br />
growth is expected to be limited as a result of the negative effect of falling global sugar prices. Over<br />
the forecast period, growth is expected to contract by 1.2%.<br />
Over the next 5 years, sugar consumption is expected to grow by 16% mainly due to growth in the<br />
population, a demand for soft drinks and confectionary and an increase in disposable income.<br />
White sugar produced locally is gaining a reputation around the world for its fine quality, which will<br />
increase its appeal within the export market.<br />
Figure 31: Sugar production and consumption forecast estimates (‘000 tonnes)<br />
2500<br />
2000<br />
1500<br />
1000<br />
500<br />
0<br />
2011 F 2012 F 2013 F 2014 F 2015 F<br />
Production<br />
Consumption<br />
Source: BMI South African Agribusiness Report Q4 2011<br />
65
3.4.3 Animal<br />
A growing number of South African’s are moving towards diets containing a higher level of protein<br />
with poultry viewed as a convenient, healthy and affordable source of nutrition. Consumption of<br />
poultry is expected to increase by 23% by 2015 given its increased standing as a popular<br />
convenience food.<br />
The demand forecasts for poultry are expected to remain positive. The factors expected to benefit<br />
production in the long term are GDP per capita growth and a decrease in unemployment. Poultry<br />
production is expected to increase by 19.8% in the 5 years to 2014/15 due to the rise in demand.<br />
The sector is in the process of addressing the problem of cheap imported poultry being dumped on<br />
the local market. Future challenges include rising feed costs due to elevated maize and soybean<br />
prices that are expected to remain high and volatile.<br />
Beef remains South Africans favourite red meat followed by lamb and it is eaten by the more affluent<br />
consumer. The production of beef in expected to increase by 22.1% while the consumption of beef<br />
is expected to increase by 26.5% in 5 years between 2011 and 2015.<br />
In the last decade, the consumption of pork has overtaken lamb and it is expected to grow by 30.3%<br />
over the period to 2015. During the same period the demand for beef is expected to increase by<br />
18.8%. Robust growth in the demand for beef and pork will insure South Africa’s standing as a net<br />
importer of these products.<br />
The graphs below are a graphical representation of the production and consumption estimates for<br />
Beef and veal, pork and poultry over the 5-year period to 2015.<br />
Figure 32: Production estimates over 5-year period<br />
1800<br />
1600<br />
1400<br />
1200<br />
1000<br />
800<br />
600<br />
400<br />
200<br />
0<br />
2011 F 2012 F 2013 F 2014 F 2015 F<br />
Beef and Veal Pork Poultry<br />
Source: BMI South African Agribusiness Report Q4 2011<br />
66
Figure 33: Consumption estimates over 5-year period<br />
2500<br />
2000<br />
1500<br />
1000<br />
500<br />
0<br />
2011 F 2012 F 2013 F 2014 F 2015 F<br />
Beef and Veal Pork Poultry<br />
Source: BMI South African Agribusiness Report Q4 2011<br />
There are potential risks to the growth in both the production and consumption of beef and veal, pork<br />
and poultry. The risks to production include the potential for new disease outbreaks, avian flu as well<br />
as foot and mouth outbreaks. Potential rising feed costs also pose a risk to the sector’s production<br />
potential. The risk to the consumption of these goods lies in the possibility of lower than expected<br />
levels of disposable income because of a significant drop in economic growth.<br />
67
4 Analysis of the provincial situation<br />
4.1 Provincial overview<br />
4.1.1 Eastern Cape<br />
4.1.1.1 Provincial overview<br />
The Eastern Cape is a predominantly rural province, with 60% of its population classified as rural. The<br />
province is climatically and environmentally diverse and contains all seven of South Africa’s biomes.<br />
As such, the region is able to farm almost all of South Africa’s crop and animal varieties. Nonetheless,<br />
the province presents a paradox, as the provincial economy is very dependent on the tertiary<br />
sector 22 .The province is characterised by dual levels of development, with two advanced industrial<br />
hubs (Port Elizabeth and Uitenhage) and then a primarily underdeveloped rural interior. The<br />
agricultural sector is no different, with a highly developed commercial sector and a large struggling<br />
subsistence sector, particularly in the former Transkei and Ciskei regions 23 .<br />
The Eastern Cape is the largest livestock producer in the country and the sector is also the largest<br />
agricultural activity in the province. The region houses 28% of South Africa’s sheep, 21% of its cattle<br />
and 46% of its goats. The Eastern Cape is also the largest producer of mohair in South Africa, which<br />
24<br />
in turn is the largest producer in the world (producing 55% of the world’s mohair) . The province also<br />
produces a quarter of South Africa’s milk and the dairy industry is likely to expand, as dairy farmers<br />
tend to prefer the high-rainfall region.<br />
In terms of crop production, the Eastern Cape is the second largest cultivator of citrus fruit in the<br />
country, with oranges comprising 80% of its citrus output. Other deciduous fruits are also grown in<br />
the province, primarily apples, pears and apricots. The Eastern Cape is also a major producer of<br />
chicory, of which South Africa is the second-largest cultivator in the world. After a drop in the<br />
pineapple market, the province is also set to benefit from revitalisation initiatives. In addition to<br />
growing pineapples, there is also a regional initiative to produce dietary fibre from the pineapple peels<br />
25<br />
and the by-products of the juicing process .<br />
The Eastern Cape also has a comparative advantage with the production of Honeybush tea and could<br />
benefit from regional initiatives, as researched by the Coega <strong>Development</strong> Corporation. In addition,<br />
the province has the potential to benefit from the essentials oil trade, particularly with the production<br />
of the aloe ferox plant, which is used in the production of various cosmetic and medicinal products. A<br />
recent project in the pipeline for the province is the introduction of bamboo farming. The plant can be<br />
used for renewable energy projects, furniture, and craft manufacturing, construction and as a means<br />
if preventing soil erosion and land degradation. Pilot bamboo-farming projects have already been<br />
initiated in Port Elizabeth, Stutterheim, and Centane. The Eastern Cape <strong>Development</strong> Corporation has<br />
26<br />
also initiated research into the crop and hosted the first Bamboo symposium in 2011 .<br />
22 DEDEA. (2010). The Eastern Cape Economic Profile and Outlook. The Eastern Cape Department of Economic <strong>Development</strong><br />
and Environmental Affairs<br />
23 Eastern Cape Provincial Government. (2004). “Eastern Cape Provincial Growth and <strong>Development</strong> Plan”.<br />
24 Department of Agriculture, Forestry and Fisheries. (2010). “A profile of the South African value chain”. Pretoria: DAFF<br />
Directorate: Marketing<br />
25 Eastern Cape Business. (2011). “Eastern Cape: Agriculture and agriprocessing”.<br />
http://www.easterncapebusiness.co.za/pls/cms/ti_secout.secout_prov?p_sid=1&p_site_id=135 (Accessed 1 November 2012)<br />
26 Eastern Cape Business. (2011)<br />
68
4.1.1.2 Agricultural sector contribution to GDP<br />
Despite the rural profile of the province, the economy of the Eastern Cape is dominated by the<br />
tertiary sector, which contributed 76.3% to the province’s regional gross domestic product (GDP-R) in<br />
2010. The secondary and tertiary sectors have consistently outperformed the primary sector, with the<br />
latter’s contribution to GDP-R consistently declining since 1995. The agriculture sector in the province<br />
contributed just 2.2% to the Eastern Cape GDP-R in 2010, as illustrated below.<br />
Figure 34: Sectoral contribution to regional GDP in the Eastern Cape – 2010<br />
General<br />
government<br />
services, 21.3%<br />
Agriculture,<br />
forestry and<br />
fishing, 2.1%<br />
Mining and<br />
quarrying, 0.1%<br />
Manufacturing,<br />
17.7%<br />
Electricity, gas and<br />
water, 1.0%<br />
Community, social<br />
and personal<br />
services, 10.5%<br />
Financial<br />
intermedidation,<br />
insurance, real<br />
estate and<br />
business services,<br />
22.5%<br />
Transport, storage<br />
and<br />
communication,<br />
8.9%<br />
Construction, 2.7%<br />
Wholesale and<br />
retail trade,<br />
catering and<br />
accomodation,<br />
13.1%<br />
Source:<br />
Statistics South Africa, 2011 (Adapted from Quantec, by KPMG)<br />
The sector has declined steadily since 1998, when it contributed 2.7% to the province’s GDP-R. The<br />
sector has struggled particularly since 2009 due to prolonged drought conditions and the decline in<br />
global prices for agricultural products 27 . 2011 has been similarly disappointing with the sector<br />
declining by 1.8% in the first quarter of the year and 4% in the second quarter 28 .<br />
4.1.1.3 Job creation within the agricultural sector of the Eastern Cape<br />
As evidenced by the diagram below, the agriculture sector in the Eastern Cape has shed a significant<br />
number of jobs. In 2000, the sector contributed 41% to total provincial employment (formal and<br />
informal). However this figure had dropped to 6.4% in 2009. Employment in 2006 peaked at 440 000<br />
and plummeted to 61 200 in 2011. This dramatic decline in sectoral employment also underpins the<br />
decline in the sector’s contribution to GDP-R.<br />
27 Roos, P., (2010). “Eastern Cape Economy Still Growing”. Fin 24. 11 November 2010.<br />
http://www.fin24.com/Barometer/Eastern_Cape/Eastern-Cape-economy-still-growing-20101111 (Accessed 1 November 2011)<br />
28 Eastern Cape Socio-economic Consultative Council. (2011). Quarterly Economic Update.<br />
http://www.ecsecc.org/files/library/documents/2Q2011_econ_update_final_draft1.pdf (Accessed 1 November 2012)<br />
69
Figure 35: Employment in the agriculture sector in the Eastern Cape 2005 - 2011<br />
500 000<br />
450 000<br />
400 000<br />
350 000<br />
300 000<br />
250 000<br />
200 000<br />
150 000<br />
100 000<br />
50 000<br />
-<br />
1Q2005<br />
3Q2005<br />
1Q2006<br />
3Q2006<br />
1Q2007<br />
3Q2007<br />
1Q2008<br />
2Q2008<br />
Number of Employees<br />
3Q2008<br />
4Q2008<br />
1Q2009<br />
2Q2009<br />
3Q2009<br />
4Q2009<br />
1Q2010<br />
2Q2010<br />
3Q2010<br />
4Q2010<br />
1Q2011<br />
2Q2011<br />
Source:<br />
Statistics South Africa, 2011 (Adapted from Quantec, by KPMG)<br />
Year and Quarter<br />
4.1.1.4 Eastern Cape Provincial Growth and <strong>Development</strong> Plan<br />
The Eastern Cape Provincial Growth and <strong>Development</strong> Plan (PGDP) acknowledge the importance of<br />
the manufacturing sector in the province but also emphasises the need to maximise linkages to the<br />
agricultural and agri-processing sectors. This development strategy will serve to diversify the<br />
economy of the province, thereby making it less dependent on any particular sectors. The agriculture<br />
sector is highlighted for three primary reasons:<br />
■ It can improve food security for poorer households;<br />
■ The agricultural sector can develop and sustain agro-processing businesses and natural resourcebased<br />
industries; and<br />
■ It can spur development in rural areas thereby reducing the developmental disparities within the<br />
province.<br />
The Eastern Cape PGDP targets the sector specifically through one of its key action areas: Targeting<br />
agrarian transformation and strengthening household food security. The diagram below illustrates the<br />
province’s plan for the sector.<br />
70
Figure 36: Eastern Cape PGDP Strategy: Agrarian transformation and strengthening household food<br />
security<br />
APPROACH<br />
• Promote food security through<br />
support of small-scale famers<br />
and homesteads<br />
• Accelerate land reform<br />
• Expand commerical agricultural<br />
enterprises into the former<br />
homelands thus enouraging<br />
agro-industries to move closer<br />
to centers of production<br />
PROGRAM ME IMPLICATIONS<br />
• Support to smallholder<br />
agriculture through credit,<br />
processing and storage facilities,<br />
access roads and marketing<br />
facilities<br />
• Suppor t for animal husbandry<br />
initiatives<br />
• Divsreify the manufacturing<br />
sector and link to agriculture<br />
through agro-processing<br />
• Human resrouce development<br />
through support to agricultural<br />
schools and colleges<br />
• Land protection programmes<br />
including catchmant<br />
management, antii-erosion and<br />
re-forestation<br />
INSTITUTIONAL<br />
IMPLICATIONS<br />
• Reogoanisation of provincial<br />
department of agriulture and<br />
increased funding for food<br />
security programmes<br />
•Sufficient funding for<br />
smallholder agriculture<br />
programmes targeting cash<br />
crops and livestock production<br />
• New institutional structures for<br />
programmes in the former<br />
homelands such as cooperatives<br />
• Strengthen agricultural<br />
research<br />
• Support of agricultural LED<br />
initiatives<br />
• Land reform to be prioritised<br />
Source: Adapted from Eastern Cape Provincial Government. (2004)<br />
The Eastern Cape PGDP also targets the development of SMME’s particularly in terms of<br />
diversification of the manufacturing and tourism sectors. However, SMME activity has the potential<br />
to create the most employment in the agriculture sector, through agro-processing industries. The<br />
strategy targets gaps in the agricultural value chain and sees the potential for small enterprises in<br />
food processing, leather and leather goods, wood products, furniture production and the production<br />
of wool and mohair clothing 29 .<br />
The Department of Rural <strong>Development</strong> and Agrarian Reform – Strategic Plan 2010/2011 – 2014/2015<br />
The Eastern Cape released the Strategic Plan in 2011 with the aim of providing a blueprint for<br />
planning and implementing rural development. The document presents three key strategic goals.<br />
They are 30 :<br />
29 Eastern Cape Provincial Government. 2004<br />
30 Eastern Cape Department of Rural <strong>Development</strong> and Agrarian Reform. (2011). Strategic Plan 2010/2011 – 2014/2015<br />
71
1. A vibrant farming sector and access to affordable food;<br />
2. Improved rural economic livelihoods and creation of employment opportunities; and<br />
3. An environment conducive to service delivery.<br />
The table below illustrates how this goal has been conceived and the plans for implementation.<br />
Table 10: Eastern Cape – Agriculture Sector Plan 2010/2011 – 2014/2015<br />
Eastern Cape : Agriculture Sector Plan 2010/2011 – 2014/2015<br />
Goal Goal Statement Justification Outcome Impact<br />
A thriving farming<br />
sector and access to<br />
affordable food<br />
To promote and<br />
support at least two<br />
million farmers with<br />
crop and livestock<br />
initiatives, to the<br />
value of R5 billion.<br />
This will in turn<br />
increase the<br />
agriculture sector’s<br />
contribution to the<br />
GDP-R<br />
Improvement of rural<br />
livelihoods and<br />
creation of<br />
employment<br />
Improved rural<br />
opportunities through<br />
economic livelihoods<br />
facilitation,<br />
To develop rural<br />
and creation of<br />
coordination and areas<br />
employment<br />
reporting on<br />
opportunities<br />
infrastructure<br />
development, the<br />
rural economy, and<br />
social development<br />
An environment<br />
conducive to service<br />
delivery<br />
Mobilisation and<br />
utilisation of internal<br />
and external<br />
resources to improve<br />
service delivery<br />
Agricultural activities<br />
are not distributed<br />
evenly across the<br />
Increased agricultural<br />
province. This<br />
contribution to<br />
strategy aims to<br />
economic growth and Improved quality of<br />
target rural women,<br />
skilled and<br />
life<br />
youth and people<br />
empowered rural<br />
with disabilities to<br />
communities<br />
even distribute<br />
income and access to<br />
food production<br />
Ensure that the<br />
Department is ready<br />
to meet the<br />
programme demands<br />
Source: Adapted from Eastern Cape Department of Rural <strong>Development</strong> and Agrarian Reform. (2011).<br />
Improved rural<br />
livelihoods<br />
A staff contingent<br />
that is well prepared<br />
for the service<br />
delivery programme<br />
Reduction of poverty,<br />
unemployment and<br />
inequality<br />
Improved quality<br />
service delivery that<br />
satisfies all<br />
stakeholders<br />
The Strategic Plan also links to other national and provincial policies as well as the Millennium<br />
<strong>Development</strong> Goals and delves deeper into implementation plans as well as management,<br />
monitoring and evaluation.<br />
The Department of Economic <strong>Development</strong> and Environmental Affairs: An Integrated Strategy for<br />
Promotion of Entrepreneurship and <strong>Small</strong> <strong>Enterprise</strong>s in the Eastern Cape<br />
The vision for the strategy is the inclusion of SMMEs in the mainstream provincial economy and to<br />
enhance entrepreneurship and self-employment through economic and industry opportunities. The<br />
objectives of the strategy are to 31 :<br />
31 Eastern Cape Department of Economic <strong>Development</strong> and Environmental Affairs. (2009). “ An Integrated Strategy for<br />
Promotion of Entrepreneurship and <strong>Small</strong> <strong>Enterprise</strong>s in the Eastern Cape: A Framework for Creating an Enabling Environment<br />
for SMME Support, Promotion and <strong>Development</strong>”. September 2009<br />
72
■ Establish institutional support in the Eastern Cape for SMMEs to be included into the mainstream<br />
economy;<br />
■ Improve access to and develop new support programmes for SMMEs;<br />
■ Conduct continuous policy and strategic reviews so as to create an enabling environment for<br />
SMMEs; and<br />
■ Collate and monitor information on SMME activity through continuous research and knowledge<br />
management.<br />
The illustration below presents the pillars of the strategy with the accompanying strategic priorities<br />
designed to achieve the vision.<br />
Figure 37: Strategic pillars and priorities of the Eastern Cape SMME and Entrepreneurship Strategy<br />
STRATEGIC PILLAR 1: SMME INSTITUTIONAL FRAMEWORK<br />
• Develop capacity within DEDEA<br />
• Establish a forum for development finance institution<br />
• Establish a provincial SMME working group<br />
• Establish an enterprise development agency in the Eastern Cape<br />
• Establish an innovation hub to enhance product development and manufacturing in the province<br />
STRATEGIC PILLAR 2: SMME PROGRAMME DESIGN AND SUPPORT<br />
• Increase supply of financial and non-financial services<br />
• Increase demand for SMME products and services through government procurement<br />
• Increase access to markets to industry opoprtunities for SMMEs<br />
• Increase access to franchise opportunities<br />
• Skills enhancement of SMME owners<br />
• Support to the informal sector and hawkers<br />
STRATEGIC PILLAR 3: REGULATORY FUNCTIONS AND SERVICES<br />
• Reduce smalll business regulatory constraints<br />
• Build capacity amongst municipal officials on managing regulations affecting SMMEs and how to<br />
manage them<br />
STRATEGIC PILLAR 4: MONITORING AND EVALUATION<br />
• Conducting ongoing research on SMMEs inthe province<br />
• Align all district, metro and provincial SMME strategies with the Provincial Strategy<br />
• Develop knowledge and information about SMMEs to inform provincial programmes and policies<br />
• Hosting annual conferences and seminars on SMME ddevelopment in the province<br />
• Ongoing monitoring of the implementation of the provincial SMME strategy<br />
Source: Eastern Cape Department of Economic <strong>Development</strong> and Environmental Affairs. (2009)<br />
73
4.1.2 Free State<br />
4.1.2.1 Provincial Overview<br />
The Free State province has traditionally been known as the granary of South Africa with agriculture<br />
being a key sector in the province. Agricultural land comprises 32 000 square kilometres of cultivated<br />
land and 87 000 square kilometres of natural veld and grazing area. Field crops are the largest<br />
agricultural sub-sector in the province, accounting for approximately 65% of the Free State’s gross<br />
agricultural income. Animal farming and animal products account for a further 30% with the<br />
remainder come from horticulture.<br />
However, as with much of South Africa, the sector contribution in the province has declined in recent<br />
years as the tertiary economic sectors have developed. Nevertheless, the province is still a major<br />
agricultural producer as evidenced by the table below.<br />
Table 11: Main agricultural crops in Limpopo Province and percentage of national production<br />
Main agricultural products in Free State Province and percentage of national production<br />
Crop<br />
Percentage of national production<br />
Maize 34%<br />
Wheat 37%<br />
Sorghum 53%<br />
Potatoes 33%<br />
Sunflower 45%<br />
Red meat 18%<br />
Dry beans 26%<br />
Peanuts 38%<br />
Wool 24%<br />
Dairy 18%<br />
Cherries 90%<br />
Source: Armour, J., (2010). “The role of agriculture for LED in the Free State”. Presentation at SALGA meeting. 13 October 2010<br />
Maize and wheat are the Free State’s main field crops while the province also produces about<br />
100 000 tons of vegetables and 40 000 tons of fruit annually. Asparagus is widely cultivated and is<br />
the province’s main vegetable product with large quantities of onions and potatoes also being<br />
cultivated. The province does present opportunities for agro-processing as much of the produce is<br />
exported and leaves the province unprocessed 32<br />
The Free State has emerged as a major player in the horticulture industry and exports approximately<br />
1.2 million tons of cut flowers every year. Environmental conditions in the province make it ideal for<br />
horticultural activities. The opposing seasons with Europe and North America also make them ideal<br />
markets for the province’s horticultural products.<br />
32 Trade Invest South Africa. (2011). “Agricultural investment opportunities abound in Free State”.<br />
http://www.tradeinvestsa.co.za/investment_opportunities/768327.htm (Accessed 12 December 2011)<br />
74
4.1.2.2 Agricultural sector contribution to GDP<br />
The Free State economy has moved away from a reliance on its primary sectors towards an economy<br />
with well-developed tertiary sectors. Between 2000 and 2009, the agriculture and mining sectors’<br />
contribution to the GDP-R declined from 17.1% to 12.8%. As can be seen in the table below the<br />
agriculture sector contributed 3.9% to the Free State’s GDP-R in 2010. Despite the small<br />
contribution, the sector is still the province’s second largest exporter after manufacturing. To this<br />
end, the provincial government in its 2011 Medium Term budget allocated R1.7 billion to the<br />
development of the sector.<br />
Figure 38: Sectoral contribution to regional GDP in Free State – 2010<br />
General<br />
government<br />
services, 15.6%<br />
Agriculture,<br />
forestry and<br />
fishing, 3.9%<br />
Mining and<br />
quarrying, 9.4%<br />
Community,<br />
social and<br />
personal<br />
services,<br />
12.8%<br />
Manufacturing,<br />
13.6%<br />
Financial<br />
intermedidation,<br />
insurance, real<br />
estate and<br />
business services,<br />
19.7%<br />
Transport, storage<br />
and<br />
communication,<br />
9.2%<br />
Electricity, gas and<br />
water, 2.8%<br />
Construction, 2.0%<br />
Wholesale and<br />
retail trade,<br />
catering and<br />
accomodation,<br />
10.9%<br />
Source: Statistics South Africa, 2011 (Adapted from Quantec, by KPMG)<br />
4.1.2.3 The Free State Growth and <strong>Development</strong> Strategy<br />
Launch in 2005, the Free State Growth and <strong>Development</strong> Strategy (FSGDS) laid out a nine-year<br />
strategy to stimulate economic development and achieve the province’s socio-economic<br />
developmental goals. The key priority areas for the FSGDS were:<br />
• Economic growth and employment;<br />
• Justice and crime prevention;<br />
75
• Social and human development; and<br />
• Efficient governance and administration.<br />
The FS GDS tackles the agriculture sector specifically as it remains an important sector in the<br />
province, and one that has consistently performed above the national averages. The strategy for the<br />
sector is two-pronged and targets agricultural diversification and agricultural beneficiation. Agricultural<br />
diversification is recognised as a necessary tool to manage risk and avoid dependency on specific<br />
crops. For the Free State, possible options include farming new products such as olives, organic<br />
farming and cultivating for essential oils. Diversification is also likely to have additional impacts on the<br />
broader economy through creating agro-processing opportunities.<br />
Agricultural beneficiation was identified as a key target area for the Free State given the quantities of<br />
agricultural products harvested in the province. Local processing, packaging, marketing and<br />
distribution will assist in retaining agricultural value in the province. Agro-processing businesses are<br />
typically labour intensive and present opportunities for SMMEs.<br />
4.1.3 Gauteng<br />
4.1.3.1 Provincial overview<br />
Gauteng Province continues to be the powerhouse of the South African economy. The province<br />
occupies just 1.4% of the country’s land area but contributes 35% to national GDP and has the<br />
largest GDP-R, R625 billion in 2009 33 . The economy is traditionally dominated by the secondary and<br />
tertiary sectors with agriculture being a relatively small sector in the province. The larger farms in<br />
Gauteng are involved in cattle, game farming and eco-tourism while the smaller farming operations<br />
tend to be involved in nurseries, piggeries, eggs, chickens, vegetables, maize and nuts. The sector<br />
targets the local urban population and tends to be direct suppliers to local produce markets and<br />
retailers 34 .<br />
Maize is the most widely cultivated crop in Gauteng and is grown over 105 000 ha of land. A large<br />
part of the province falls within South Africa’s maize triangle and the province’s maize sector received<br />
added assistance in 2010 through a revitalisation programme initiated by the Gauteng provincial<br />
government. The project activities included maize planting, distribution of crop inputs like seeds,<br />
fertilisers, pest control and diesel, and the distribution of tractors to local communities. The project is<br />
ongoing and plans to provide additional input and mechanisation support up until 2012. In addition,<br />
the Gauteng Department of Agriculture and Rural <strong>Development</strong> also plans to sign marketing<br />
contracts with farmers for 25 000 tons of maize, valued at approximately R25 million for the<br />
2011/2012 financial year. The Department is also assessing the feasibility of constructing a milling<br />
35<br />
plant, which will assist Gauteng maize farmers in accessing markets .<br />
Farmland in the province comprises 44.2% (828 632 ha) of the total Gauteng area. This farmland<br />
comprises 438 623 ha of arable land and 390 000 ha of grazing land. At present, approximately 67%<br />
of all arable land is being cultivated. According to the Gauteng Agricultural <strong>Development</strong> Strategy, this<br />
indicates that there is land capacity for additional agricultural activities, particularly with the decline of<br />
mining and other industries that would typically compete for land. In essence, the province can claim<br />
36<br />
one-sixth of all South African land suitable for agriculture . The challenge however is that almost a<br />
third of all high- and medium-potential land in the province is not under cultivation and a further large<br />
proportion of the land is degraded or undeveloped with no plans for cultivation.<br />
33 Gauteng Department of Finance. (2011). Socio-economic Review and Outlook 2011. Johannesburg: Gauteng Provincial<br />
Government<br />
34 Mokoka, NN., and Murembiwa, CM. (2002). Gauteng Provincial Report on Education and Training for Agriculture on Rural<br />
<strong>Development</strong>. Department of Agriculture, Conservation, Environment and Land Affairs. November 2002<br />
35 Gauteng Department of Agriculture, Conservation and Environment. (2006)<br />
36 Gauteng Department of Agriculture, Conservation and Environment. (2006). The Gauteng Agricultural <strong>Development</strong> Strategy.<br />
February 2006<br />
76
4.1.3.2 Agricultural sector contribution to GDP<br />
The Gauteng economy is an advanced one that has moved away from its historical reliance on the<br />
primary sectors. As such, agriculture is the smallest contributor to the province’s GDP-R. The diagram<br />
below illustrates the contribution of the sector to the Gauteng economy. In 2010, the agriculture,<br />
forestry and fishing sector contributed just 0.4% to the provincial GDP.<br />
Figure 39: Sectoral contribution to regional GDP in Gauteng – 2010<br />
Community, social<br />
and personal<br />
services, 4.2%<br />
General government<br />
services, 17.7%<br />
Agriculture, forestry<br />
and fishing, 0.4%<br />
Mining and<br />
quarrying, 1.9%<br />
Financial<br />
intermedidation,<br />
insurance, real<br />
estate and business<br />
services, 26.7%<br />
Manufacturing,<br />
19.3%<br />
Electricity, gas and<br />
water, 2.0%<br />
Construction, 4.4%<br />
Transport, storage<br />
and communication,<br />
9.4%<br />
Wholesale and retail<br />
trade, catering and<br />
accomodation,<br />
13.9%<br />
Source: Statistics South Africa, 2011 (Adapted from Quantec, by KPMG)<br />
Gauteng has a stong manufacturing sector, of which agri-processing contrbutes 7.8%. Furthermore,<br />
the province has the largest proportion of food and bevergage processing plants in South Africa, with<br />
strong linkages to the agriculture sector. According to the Gauteng Provincial Government, if the<br />
contribution of agri-processing was combined with agriculture, the sectors would contribute 2.2% to<br />
the provincial economy 37 .<br />
4.1.3.3 Job creation within the agricultural sector of Gauteng<br />
The transformation of the Gauteng economy is reflected in the employment data for the agricultural<br />
sector. Employment has declined since a peak in 2007 as the sector’s contribution to the provincial<br />
economy has also declined.<br />
37 Gauteng Department of Finance. (2010). Review and Outlook of Agriculture Industry in South Africa and Gauteng.<br />
77
Figure 40: Employment in the agriculture sector in the Gauteng 2005 - 2011<br />
80 000<br />
70 000<br />
60 000<br />
Number of Employees<br />
50 000<br />
40 000<br />
30 000<br />
20 000<br />
10 000<br />
-<br />
Year and Quarter<br />
Source: Statistics South Africa, 2011 (Adapted from Quantec, by KPMG)<br />
4.1.3.4 The Gauteng Provincial Growth and <strong>Development</strong> Strategy<br />
The Gauteng Provincial Growth and <strong>Development</strong> (PGDS) was launched in 2005 with the focus on<br />
building a “smart” province, by fostering economic growth, creating employment, increasing<br />
transformation and representation in the economy and developing social and economic infrastructure.<br />
In achieving these outcomes, the Gauteng PGDS focused on six key areas 38 :<br />
■ Aim to halve poverty by developing effective pro-poor programmes and policies and boost socioeconomic<br />
infrastructure i.e. schools, clinics etc.<br />
■ Aim to halve unemployment by targeting high-potential labour-absorbing industries and ensure<br />
that economic growth reduces inequality<br />
■ Develop socio-economic development programmes that are sustainable in the long-term<br />
particularly in terms of funding and environmental impact<br />
■ Ensure that government departments have the required skills and efficiencies to roll out<br />
development initiatives and that all policy interventions are aligned with national, provincial and<br />
local objectives<br />
■ Promote responsible citizenship through responsible spatial planning which targets marginalised<br />
communities and by fostering a culture of human values<br />
■ Contribute to achieving NEPAD’s socio-economic development goals<br />
The Gauteng strategy highlights a number of mechanisms to achieve the stated objectives. The<br />
common themes running through these mechanisms are the pull of investments and the inclusion of<br />
the informal economy into the mainstream. The two mechanisms relevant to this study are (a)<br />
38 Gauteng Provincial Government. (2005). Gauteng Provincial Growth and <strong>Development</strong> Strategy. Johannesburg: Gauteng<br />
Provincial Government, April 2005<br />
78
Investment and support to targeted economic growth sectors (including agriculture – agri-processing<br />
and biotech) and (b) SMME support 39 .<br />
In terms of SMME support, the province committed to create an agency to provide financial and nonfinancial<br />
assistance to SMMEs in the province. This was achieved through the establishment of the<br />
Gauteng <strong>Enterprise</strong> Propeller.<br />
The Gauteng Agricultural <strong>Development</strong> Strategy<br />
The Gauteng Agricultural <strong>Development</strong> Strategy (GADS) was launched in 2006 and was designed to<br />
promote economic growth in the provincial agriculture sector, create employment, and align with the<br />
Gauteng PGDS. Leveraging off the PGDS, the GADS lists the following mechanisms to be<br />
pursued40:<br />
■ Natural agricultural resource protection: Protection of high-potential arable land. Gauteng has the<br />
highest proportion of arable land in the country<br />
■ Agricultural planning and market analysis: Information collection, dissemination and analysis using<br />
agricultural and economic modelling tools for optimal planning in the sector. The formation of<br />
clusters and agricultural zones around areas with a strategic and comparative advantage – In<br />
Gauteng, this is the high proportion of arable land<br />
■ Farmer development and support: Providing support to farmers that will maintain the<br />
competitiveness of formal farming operations while formalising the informal farming sector<br />
■ Enhancing the competitiveness of the sector: Achieve the annual provincial growth target of 8%.<br />
Given the size of the agriculture sector, the GADS determines that it would be more financially<br />
viable to focus on niche products<br />
■ Partnerships: Provincial and local agricultural institutions need to engage with national initiatives<br />
that support agricultural development<br />
■ Focus on vulnerable groups: Women and people with disabilities are to be targeted in the<br />
provision of support services.<br />
4.1.4 Kwa-Zulu Natal<br />
4.1.4.1 Provincial overview<br />
KwaZulu-Natal while comprising only 7.7% of South Africa’s total land area, is the second-largest<br />
provincial economy in the country. Known as the “Garden province”, KwaZulu-Natal has a diverse<br />
agriculture sector that benefits from its relatively high rainfall, subtropical climate, transport<br />
infrastructure and access to markets.<br />
The cultivation of field crops is the predominant agricultural activity in the province, accounting for<br />
43% of total agricultural GVA. Livestock farming is the second largest activity contributing 25%,<br />
followed by the processing of animal products (milk, wool, eggs) at 15% of provincial agricultural<br />
GVA. Horticultural activities (fruit and vegetables) comprise 10% and the remainder is made up of<br />
aquaculture, forestry, and honey production.<br />
Despite the province being well endowed with agriculturally favourable climatic and soil conditions, it<br />
does face serious challenges concerning sustainability. As the most populous province in the country,<br />
there is increased pressure on the land from urban expansion and increasing population density. This<br />
in turn has led to the reduction in the amount of available arable land and as agricultural prices<br />
decline, many farmers are opting to use their arable land for other non-agricultural profit-generating<br />
39 Gauteng Provincial Government. (2005)<br />
40 Gauteng Department of Agriculture, Conservation and Environment. (2006)<br />
79
means. Furthermore, the quality of the province’s arable land has declined considerably in recent<br />
years as farmers use unsustainable farming methods. According to the KwaZulu Natal Provincial and<br />
Growth Strategy (KZNPGDS), the province is one of two in South Africa with the most degraded land<br />
with the total area of eroded land increasing by 57% between 1994 and 2004. This has come about<br />
mainly as a result of poor land management and overgrazing. Other challenges facing the agriculture<br />
sector in KwaZulu Natal include 41 :<br />
■ Inadequate access to infrastructure;<br />
■ Lack of agri-industries;<br />
■ Increased competition arising from subsidies farming overseas;<br />
■ No links between graduates to commercial farming operations; and<br />
■ Backlogs in the land reform process<br />
There is potential in the province, however, to grow the agricultural sector in light of the agroprocessing<br />
industries that are based in KwaZulu Natal. Approximately 30% of the province’s<br />
manufacturing GVA is derived from “food, beverages and tobacco” and the “wood and paper”<br />
industries, which have direct linkages to the agriculture sector. An upturn in manufacturing could<br />
provide the needed stimulus for the agriculture sector.<br />
4.1.4.2 Agricultural sector contribution to GDP<br />
Agriculture is an important sector in the province and contributes 76% of the primary sector output,<br />
which differs from the rest of the country, where mining is the largest contributor to primary sector<br />
output. As can be seen in the figure below, the agriculture, forestry and fishing sector, contributes<br />
4.4% to the KwaZulu Natal GDP-R. However the province is the largest contributor to the national<br />
agriculture sector, with a contribution of 30% to national agricultural output.<br />
41 KwaZulu Natal Planning Commission. (2011). Provincial Growth and <strong>Development</strong> Strategy. KwaZulu Natal Provincial<br />
Government<br />
80
Figure 41: Sectoral contribution to regional GDP in KwaZulu-Natal – 2010<br />
Financial<br />
intermedidation,<br />
insurance, real<br />
estate and business<br />
services, 20.0%<br />
Community, social<br />
and personal<br />
services, 6.3%<br />
General<br />
government<br />
services, 12.9%<br />
Transport, storage<br />
and<br />
communication,<br />
13.6%<br />
Agriculture, forestry<br />
and fishing, 4.4%<br />
Mining and<br />
quarrying, 1.3%<br />
Wholesale and<br />
retail trade, catering<br />
and accomodation,<br />
14.2%<br />
Construction, 3.0%<br />
Electricity, gas and<br />
water, 2.2%<br />
Manufacturing,<br />
22.1%<br />
Source: Statistics South Africa, 2011 (Adapted from Quantec, by KPMG)<br />
Nevertheless, the province has experienced a decline in investment in agriculture and the sector’s<br />
contribution to the provincial economy has declined in recent years. As a result, the province has<br />
become a net-importer of agricultural products.<br />
4.1.4.3 Job creation within the agricultural sector of Kwa-zulu Natal<br />
KwaZulu-Natal has experienced a significant decline in investment in its primary sectors in recent<br />
years and this is evident in the drastic decline in employment in the agriculture sector, as seen in the<br />
graph below. Agricultural employment in the province peaked during the 3 rd quarter of 2006 at<br />
290 258 and dropped to 99 215 in the second quarter of 2011.<br />
81
Figure 42: Employment in the agriculture sector in KwaZulu-Natal 2005 - 2011<br />
350 000<br />
300 000<br />
250 000<br />
200 000<br />
150 000<br />
100 000<br />
50 000<br />
-<br />
1Q2005<br />
3Q2005<br />
1Q2006<br />
3Q2006<br />
1Q2007<br />
3Q2007<br />
1Q2008<br />
2Q2008<br />
Number of employees<br />
3Q2008<br />
4Q2008<br />
1Q2009<br />
2Q2009<br />
3Q2009<br />
4Q2009<br />
1Q2010<br />
2Q2010<br />
3Q2010<br />
4Q2010<br />
1Q2011<br />
2Q2011<br />
Year and Quarter<br />
Source: Statistics South Africa, 2011 (Adapted from Quantec, by KPMG)<br />
4.1.4.4 KwaZulu-Natal Provincial Growth and <strong>Development</strong> Strategy 2011<br />
The KwaZulu Natal Provincial Growth and <strong>Development</strong> Strategy (KZNPGDS) lays out a vision for the<br />
province for 2030 – “A prosperous province with a healthy, secure and skilled population, acting as a<br />
gateway to Africa and the world”42.<br />
The strategy acknowledges that poverty is one of the greatest challenges facing KwaZulu-Natal. The<br />
province is also hampered by the poor provision of social services, an increasing reliance on social<br />
welfare programmes and backlogs in the provision of water, sanitation, electricity, and rural<br />
infrastructure.<br />
In order to remedy the developmental challenges in the province, the KZNPGDS presents 7 strategic<br />
goals. The document acknowledges that these goals have merely been identified at this stage and<br />
precedes a more detailed Provincial Growth and <strong>Development</strong> Plan that will contain a detailed<br />
implementation framework. The following are the strategic goals presented in the KZNPGDS:<br />
■ Job creation<br />
■ Human resource development<br />
■ Human and community development<br />
■ Strategic infrastructure<br />
■ Response to climate change<br />
■ Governance and policy<br />
■ Spatial equity<br />
42 KwaZulu-Natal Provincial Planning Commission. (2011). Provincial Growth and <strong>Development</strong> Strategy 2011<br />
82
The illustration below highlights where agriculture fits into this strategic plan.<br />
Figure 43: The agricultural and SMME strategies of the KwaZulu-Natal Provincial Growth and<br />
<strong>Development</strong> Strategy 2011<br />
STRATEGIC GOAL: JOB<br />
CREATION<br />
OBJECTIVE INDICATORS<br />
INTERVENTIONS<br />
•Strategic objective:<br />
Unleashing agricultural<br />
potential<br />
• Increase in employment in<br />
the agricultural sector<br />
•Increase in hectares of land<br />
under active agriculture<br />
• Net gain in new emerging<br />
commercial farmers<br />
• Diversification of agricultural<br />
production and markets<br />
• Expansion of irrigation<br />
schemes and water-use<br />
efficiency<br />
• Strategy for the development<br />
of emerging commercial<br />
farmers<br />
• Protection and rehabilitation<br />
of agricultural resources<br />
STRATEGIC GOAL:<br />
RESPONSE TO CLIMATE<br />
CHANGE<br />
OBJECTIVE INDICATORS<br />
INTERVENTIONS<br />
•Strategic objective: To<br />
increase land productivity<br />
• Increased natural resource<br />
and land management<br />
• Percentage increase in<br />
sustainable land use practices<br />
•Percentage reduction in land<br />
degradation<br />
• Increased natural resource<br />
and land management<br />
• Increased support for<br />
effective utlisation of<br />
resources<br />
• Accelerated Rural<br />
<strong>Development</strong> and sustainable<br />
livelihoods<br />
•Promote sustainable<br />
agricultural land-use practices<br />
• Establish a Land Care<br />
Programme and a policy for<br />
the reduction of land<br />
degradation<br />
• Develop a provincial strategy<br />
for biodeiversity conservation<br />
83
STRATEGIC GOAL: JOB<br />
CREATION<br />
OBJECTIVE INDICATORS<br />
INTERVENTIONS<br />
•Strategic objective:<br />
Promoting SMME,<br />
Entrepreneuria and Youth<br />
<strong>Development</strong><br />
• Net gain in number of viable<br />
SMMEs<br />
• Percentage contribution of<br />
SMME's towards<br />
employment<br />
• Number of youth employed<br />
through assistance of the<br />
Youth Wage Subsidy<br />
Scheme<br />
• Support the establishment<br />
of learnerships,<br />
apprenticeships and<br />
mentorship programmes<br />
within the public and private<br />
sector<br />
• Prepare for the<br />
implementation of the Youth<br />
Wage Subsidy Scheme<br />
• Finalise and implement the<br />
KZN SMME Cooperative<br />
Strategies<br />
4.1.5 Limpopo<br />
4.1.5.1 Provincial overview<br />
Known as the breadbasket of South Africa, the Limpopo Province is one of South Africa’s most<br />
important agricultural regions and is a significant producer of livestock, fruit and vegetables. The<br />
province is predominantly rural with 89% of its 5.56 million inhabitants classified as rural 43 .<br />
As with the rest of South Africa, Limpopo’s agricultural system is characterised by its duality<br />
between commercial and subsistence agriculture. 5000 large-scale commercial farmers farm 70% of<br />
the province’s agricultural land. There are an additional 303 000 small-scale farmers operating on the<br />
remaining 30% of agricultural land. The majority of these small-scale farmers are located in areas<br />
previously located within the homelands and have low levels of production technology. These smallscale<br />
farmers tend to have small farms averaging 1.5ha and are primarily subsistence farmers with<br />
small surpluses that can be taken to market. In 2000, Statistics South Africa estimated that 80% of<br />
these smallholder farmers were women. Despite the agricultural potential of the province, these<br />
smallholders lack access to resources and thus pose a significant challenge to the development of<br />
44<br />
the sector .<br />
The agriculture sector in Limpopo has faced severe challenges in recent years, thus undermining the<br />
potential of the sector to contribute significantly to the provincial economy. The province has<br />
demonstrated its vulnerability to climatic conditions and has experienced severe droughts and floods.<br />
These conditions have necessitated the need for careful management of land, soil, and water<br />
resources which in turn requires engineering skills and new infrastructure. The lack of such<br />
infrastructure, particularly storage and processing facilities, has also resulted in farmers incurring<br />
severe post-harvest losses. The lack of mechanisation of farming processes has also meant that<br />
much of the province’s arable land is being underutilised or is unproductive. The cost of electricity<br />
and oil also poses a challenge to agribusinesses and underlies the need for alternate energy sources.<br />
The increasing input costs have also resulted in many farmers substituting quality for cost-cutting.<br />
43 Paterson, C., (2010). “Case Study 5: Partnerships in Agriculture: Market-based crop production”. Multi-stakeholder forum –<br />
Increasing service delivery through partnerships between private and public sector.<br />
44 Meliko, MO., and Oni, SA., (2010). “Contribution of agriculture to the economy of Limpopo Province”. Paper presented at<br />
the Join 3 rd African Association of Agricultural Economists and 48 th Agricultural Economists Association of South Africa<br />
Conference, Cape Town, South Africa, 19-23 September 2010<br />
84
The agriculture sector in Limpopo is dominated by horticulture, which included fruit and vegetable<br />
farming, accounting for 57% of total farming income in the province. The livestock sector accounts<br />
for 25% with field crops accounting for 11%. The smallholder farmers tend to grow predominantly<br />
field crops, particularly maize and on a smaller scale, grain sorghum, millet, beans and groundnuts.<br />
Only those smallholder farmers with access to irrigation plant vegetables 45 .<br />
The table below lists some of the key agricultural outputs of the province and the proportion of South<br />
Africa’s total output.<br />
Table 12: Main horticultural crops in Limpopo Province and percentage of national production<br />
Main horticultural crops in Limpopo Province and percentage of national production<br />
Crop<br />
Percentage of national production<br />
Mangoes 75%<br />
Paw paws 65%<br />
Citrus fruit 25%<br />
Litchis 25%<br />
Tomatoes 75%<br />
Macadamia nuts 54%<br />
Avocadoes 60%<br />
Despite the agricultural potential and output of the province, there are very few agro-processing<br />
entities in Limpopo. The only local operations are tomato-based given the dominance of the province<br />
in tomato production. The situation means that most agricultural produce from Limpopo has to be<br />
marketed at commercial centres outside of the province. The large supermarkets (Woolworths, Pick<br />
and Pay, Shoprite/Checkers and Spar) do procure fresh produce locally with Pick and Pay, Spar and<br />
Shoprite/Checkers) spending approximately R375 million in the province annually. However<br />
procurement is mainly done with large scale commercial farms due to large volumes required,<br />
consistent supplies and standard requirements. The Spar chain however does engage with black<br />
small farming enterprises without a need for contracts, however these farmers do tend to lack the<br />
technical and management skills required to fulfil large orders with high-standard requirements. The<br />
following are constrains faced by small farmers in Limpopo 46 :<br />
■ Access to land: Size of plots, especially communal farming areas is a major constraint and also a<br />
major factor is reduced profitability<br />
■ Access to irrigation water: Lack of access and affordability of irrigation is a significant constraint in<br />
a province with a threatened water supply<br />
■ Mechanisation: Most smallholder farmers cannot afford to purchase tractors and other<br />
mechanised farming tool and are forced to hire them from the large commercial farms,<br />
sometimes paying between R400 and R600 per ha for tractor services.<br />
■ Access to production inputs: There are affordability issues around quality inputs such as seeds,<br />
fertilisers and pesticides and lower-quality inputs tend to results in low agricultural yields. The<br />
challenge is exacerbated by lack of access to credit<br />
45 Baloti, JK., (2010). “An analysis of constraints facing smallholder farmers in the Agribusiness value chain: A case study of<br />
farmers in the Limpopo Province”. Dissertation submitted in partial fulfullment of the requirements of the degree M Inst Agrar<br />
(Agricultural Economics). University of Pretoria<br />
46 Baloti, JK., (2010)<br />
85
■ Extension support services: Limpopo province has tacked farmer assistance at the municipal level<br />
so that extension officers (provide information assistance and introduce new technologies and<br />
methods) are located close to farming operations. However, most farmers report having received<br />
no assistance or visits from these officers.<br />
■ Marketing constraints: Lack of transport and distance to markets; Lack of information on markets<br />
4.1.5.2 Agricultural sector contribution to GDP<br />
In 2010, the agriculture sector contributed 2.9% to the GDP-R of the province. This is relatively large<br />
as compared to the other provinces in the country and underlines the province’s position as South<br />
Africa’s breadbasket. As a major horticultural producer, the sector attracts a sizeable income from<br />
agricultural trade with Gauteng and through supplying agro-processing industries across the country.<br />
A good example of this is the Johannesburg Fresh Produce Market who sources about 45% of its<br />
produce from Limpopo (amounting to a turnover of approximately R1 billion) 47 .<br />
Figure 44: Sectoral contribution to regional GDP in Limpopo – 2010<br />
Financial<br />
intermedidation,<br />
insurance, real<br />
estate and<br />
business services,<br />
18.7%<br />
Community, social<br />
and personal<br />
services, 5.4%<br />
General<br />
government<br />
services, 19.2%<br />
Transport, storage<br />
and<br />
communication,<br />
10.0%<br />
Agriculture,<br />
forestry and<br />
fishing, 2.9%<br />
Wholesale and<br />
retail trade,<br />
catering and<br />
accomodation,<br />
12.2%<br />
Construction,<br />
2.3%<br />
Electricity, gas and<br />
water, 2.8%<br />
Manufacturing,<br />
3.9%<br />
Mining and<br />
quarrying, 22.7%<br />
Source: Statistics South Africa, 2011 (Adapted from Quantec, by KPMG)<br />
47 Trade and Investment Limpopo. (2011). “Agriculture and agriculture investment opportunities”.<br />
http://til.bz/TIL_INVESTMENT%20NODES-agric.htm (Accessed 17 November 2011)<br />
86
4.1.5.3 Job creation within the agricultural sector of Limpopo<br />
Figure 45: Employment in the agriculture sector in the Limpopo 2005 - 2011<br />
100 000<br />
90 000<br />
80 000<br />
Number of Employees<br />
70 000<br />
60 000<br />
50 000<br />
40 000<br />
30 000<br />
20 000<br />
10 000<br />
-<br />
Year and Quarter<br />
Source: Statistics South Africa, 2011 (Adapted from Quantec, by KPMG)<br />
4.1.5.4 Limpopo Employment Growth and <strong>Development</strong> Plan 2009-2014<br />
The Limpopo Employment Growth and <strong>Development</strong> Plan (LEGDP) presents a roadmap for the<br />
province to stimulate economic growth, create decent employment and reduce poverty. The plan<br />
does not claim to provide a comprehensive strategy but instead focuses on areas that have been<br />
deemed high potential for the province.<br />
For the agriculture sector, the Plan lists key strategic challenges and service gaps that will need to be<br />
addressed. These are:<br />
■ Extension services: The extension programme in the province has not been as dynamic and have<br />
not kept up with technological advancements in agriculture<br />
■ Infrastructure: The Limpopo Department of Agriculture (LDA) A has to prioritise the development<br />
of off-farm infrastructure, on-farm infrastructure, capacity building infrastructure and input costs,<br />
particularly for farmers that fall below the poverty line<br />
■ Use of limited resources: The LDA has to protect ecologically sensitive areas in the province and<br />
ensure that farmers have access to and utilise water-saving irrigation technology<br />
■ Climate change: The province needs to become more aware of the effects of climate change and<br />
the measures that can be employed to mitigate these impacts, such as the planting of more trees<br />
■ Collapsing of land reform projects: The lack of support for post-settlement farmers has resulted in<br />
lowering the productivity of many farms. The provincial government will need to rectify the<br />
situation and encourage struggling landowners to lease out their land<br />
■ Legislation and policies: There has to be incentives for entrepreneurs as their ventures are likely to<br />
create jobs<br />
■ Land claims: The slow process of land reform has reduced agricultural productivity, as uncertainly<br />
has discouraged long-term investment. The LDA will need to speed up the process but also<br />
87
identify and support young agricultural entrepreneurs to manage productive farms with their<br />
support and assistance from finance corporations in the sector<br />
■ Access to national markets: The province needs to establish its own fresh produce market and<br />
agri-processing facilities to keep the value of agricultural output in the province. In addition, smallscale<br />
famers need to increase their proportion of the province’s total agricultural output.<br />
Agriculture Strategic Plan 2010/11 – 2014/15<br />
The theme of the Limpopo Agricultural Strategic Plan (ASP) is stated as “from farming to agricultural<br />
industrial development”, thus encapsulating the province’s goal of transforming agriculture into a key<br />
element of economic growth in the province. The mission of the strategy is to promote economic<br />
growth and food security through sustainable agriculture and fostering of entrepreneurship.<br />
The table below presents the strategic goals listed in the plan.<br />
Table 13: Strategic goals of the Agricultural Strategic Plan 2010/2011 – 2014/2015<br />
Strategic goals of the Agricultural Strategic Plan 2010/2011 – 2014/2015<br />
Strategic goal Goal Statement Justification<br />
Creating an enabling service delivery<br />
environment<br />
Provide administrative support to all<br />
employees of the Provincial<br />
Department of Agriculture<br />
Skills development and effective<br />
human resources management will<br />
improve service delivery<br />
Efficient systems will increase<br />
productivity amongst staff<br />
Sustainable agricultural resource<br />
base<br />
Improved agriculture and sustainable<br />
farming practices will improve<br />
production<br />
The programme will aid rural<br />
communities and enable them to<br />
become more competitive through<br />
better farming practices<br />
The programme will speed up<br />
provincial infrastructure delivery and<br />
promote resource management<br />
Improved agricultural production<br />
Ensure that all farmers are able to<br />
access agricultural support<br />
programmes<br />
Improved production will increase<br />
economic growth and food security<br />
Safe and tradable animals and animal<br />
products<br />
Control and monitoring of animals<br />
and animal products<br />
Controlling and managing animal<br />
trading to ensure that only safe<br />
products are traded<br />
Demand-led training and research<br />
programmes<br />
Competitive agricultural sector<br />
Skilled and empowered farming<br />
community<br />
Skills transfer to prospective and<br />
practicing farmers, extension<br />
officials and supervisors in the<br />
agriculture sector<br />
Provide support through<br />
entrepreneurial development,<br />
marketing service as well as<br />
economic and statistical analysis<br />
To facilitate and provide education<br />
and training in line with the<br />
Agricultural Education and Training<br />
Strategy to all agricultural workers<br />
Proper training and skills<br />
development will ensure sustainable<br />
farming practices<br />
Farmers require marketing<br />
assistance and operational expertise<br />
to render their farms more<br />
competitive and financially<br />
sustainable<br />
Skills and training is essential for<br />
farmer development and sustainable<br />
farming. The large semi-skilled and<br />
unskilled workforce need to be<br />
accredited through on the job<br />
training<br />
88
4.1.6 Mpumalanga<br />
4.1.6.1 Provincial overview<br />
Mpumalanga is an important agricultural region in South Africa. With a diverse climate and two<br />
distinct climatic regions, the province produces a wide range of agricultural outputs. Mpumalanga’s<br />
Highveld is characterised by cold and frosty winters with moderate summers. The region is home to<br />
large-scale production of winter and summer cereals. Summer crops include maize and sorghum and<br />
the province produces approximately 1.1 million tons annually over an areas of 304 000 hectares.<br />
Wheat is the largest cultivated winter cereal with an annual production of 53 000 tons over an area of<br />
13 000 hectares. In addition to the cereals, the Mpumalanga Highveld is also home to the cultivation<br />
of oil seeds, legumes and fodder crops. 48 .<br />
Mpumalanga’s Lowveld region is characterised by its mild winters and sub-tropical climate. The<br />
region is a major cultivator of sugar cane and citrus fruits, producing about a third of the South<br />
Africa’s exported oranges. The Lowveld is also a major producer of bananas, mangos and avocados.<br />
Concerning vegetables, the province is a cultivator of potatoes, sweet potatoes, and beans. Together<br />
49<br />
with the Free State, Mpumalanga grows approximately 40% of South Africa’s potatoes .<br />
Mpumalanga has a large forestry industry and accounts for 40% of South Africa’s total forestry<br />
income. The sector currently employs 24 400 people and supports 46 300 indirect jobs. The foresty<br />
industry is highly commercialised and well developed with plants producing sawn logs, pulp, paper<br />
and board. However there are significant opportunities for small-scale businesses, particularly<br />
50<br />
growers, contractors, saw millers and waste-paper vendors .<br />
Despite the high levels of agricultural production and potential in the province, the predominantly rural<br />
province faces severe socio-economic developmental challenges. Approximately 1.79 million of its<br />
inhabitants (approximately 48%) live in poverty and rural areas continue to be economically<br />
51<br />
marginalised . Agriculture therefore provides opportunities to the province by providing employment<br />
for it’s largely unskilled population while also increasing food security and contributing to other<br />
sectors along the agricultural value chain.<br />
The province also faces serious environmental challenges through soil erosion and degradation,<br />
particularly in areas that are overpopulated. With the demand for water exceeding the supply, the lack<br />
of sufficient irrigation poses a significant threat to agricultural development. In addition, the<br />
52<br />
agriculture sector is also plagued by deforestation and the invasion of alien plant species .<br />
Land reform is also likely to play a significant role in agricultural development with 70% of<br />
Mpumalanga’s land under claim. Commercial farming uses 90% of all farming land in the province<br />
while only 19% is used by emerging black farmers. With large backlogs in the land claims process,<br />
the provincial government has expressed a desire to expedite the process as well as to acquire<br />
commercially viable land for redistribution to emerging black farmers. However, agricultural land is<br />
also threatened by competition with other industries in the region, particularly mining. With<br />
encroaching mining operations and urbanisation, the agricultural sector faces stiff competition for<br />
48 TradeInvest South Africa. (2011). “Mpumalanga is a fertile agricultural investment destination”.<br />
http://www.tradeinvestsa.co.za/business-opportunities/1068260.htm (Accessed 1 November 2011)<br />
49 Mahlangu, EE., and Sekgota, MGB. (2006). “Mpumalanga Agricultural Education and Training Report”. National Strategy on<br />
Education and Training for Agriculture and Rural <strong>Development</strong>. Nelspruit: Department of Agriculture, Conservation and<br />
Environment<br />
50 Mpumalanga Provincial Government. (2011). Draft Mpumalanga Economic Growth and <strong>Development</strong> Path”. February 2011<br />
51 Mashego-Dlamini, KC. (2011) “Budget Vote Address”. Presented by Mpumalanga MEC For Agriculture, Rural <strong>Development</strong><br />
and Land Administration. 7 June 2011<br />
52 Mashego-Dlamini, KC. (2011)<br />
89
available land. Protection of high-potential agricultural land is crucial for the sector if it is to create<br />
employment and improve food security 53<br />
4.1.6.2 Agricultural sector contribution to GAP<br />
Figure 46: Sectoral contribution to regional GDP in the Mpumalanga – 2010<br />
Financial<br />
intermedidation,<br />
insurance, real<br />
estate and<br />
business services,<br />
13.1%<br />
Community, social<br />
and personal<br />
services, 5.9%<br />
General<br />
government<br />
services, 10.3%<br />
Agriculture,<br />
forestry and<br />
fishing, 3.5%<br />
Transport, storage<br />
and<br />
communication,<br />
9.6%<br />
Mining and<br />
quarrying, 19.0%<br />
Wholesale and<br />
retail trade,<br />
catering and<br />
accomodation,<br />
10.9%<br />
Construction,<br />
2.5%<br />
Electricity, gas and<br />
water, 4.7%<br />
Manufacturing,<br />
20.6%<br />
Source:<br />
Statistics South Africa, 2011 (Adapted from Quantec)<br />
53 Mpumalanga Provincial Government. (2011)<br />
90
4.1.6.3 Job creation within the agricultural sector of Mpumalanga<br />
Figure 47: Employment in the agriculture sector in Mpumalanga 2005 - 2011<br />
140 000<br />
120 000<br />
100 000<br />
Number of employees<br />
80 000<br />
60 000<br />
40 000<br />
20 000<br />
-<br />
Year and Quarter<br />
Source:<br />
Statistics South Africa, 2011 (Adapted from Quantec)<br />
4.1.6.4 The Mpumalanga Provincial Growth and <strong>Development</strong> Strategy 2008 – 2014<br />
The Mpumalanga PGDS was originally developed and published in 2004. The policy document was<br />
subsequently reviewed in 2008 to reflect changes in the socio-economic profile of the province as<br />
well as new policy directives from national government. The mission of the PGDS is the promotion of<br />
economic growth and development that addresses job-creation and poverty-alleviation in an<br />
environmentally sustainable manner, with the underlying principles of good governance and spatial<br />
planning 54 .<br />
The situational analysis of the province gave rise to six priority areas. These are:<br />
1. Provide support to the industrial and service sectors to create employment;<br />
4. Use indigenous resources to create jobs, particularly within the agriculture and tourism sectors;<br />
5. Reduce the impact of poverty through social services;<br />
6. Enhance social cohesion and develop human capital;<br />
7. Strengthen sustainable development; and<br />
8. Maximise the provincial benefits from the mining and energy sectors while mitigating the<br />
environmental impact.<br />
The diagram below illustrates the impact of these priorities on the agricultural sector:<br />
54 Mpumalanga Provincial Government. (2008). “Provincial Growth and <strong>Development</strong> Strategy 2004 – 2014: 2008 Review”.<br />
91
Figure 48: Mpumalanga PGDS key interventions<br />
Provide support to the industrial and service sectors to create employment<br />
•Target primary product value-chains: Maximise links between primary products and their use in the<br />
secondary and tertiary sectors<br />
•Target agricultural beneficiation: Maximise value of agricultural products through agro-processing<br />
•Target forestry beneficiation: Develop value-add processes for forestry priducts e.g. roofs, furniture<br />
etc.<br />
• Target SMME development: Provide financial and non-financial support to SMMEs<br />
Using indigenous resources to create jobs<br />
• Target the land reform process: Accelerate the land claim processes and provide support to<br />
beneficiary communities<br />
• Target small farmers: <strong>Development</strong> of an agricultural strategy and initiatives for small farmers to<br />
access large markets and for techonological support in niche sub-sectors<br />
• Target biofuels from waste products: Use of plants harvested by small farms and community farms<br />
based on growth and development opportunities<br />
• Target environmental rehabilitation: Increase water availability through the support of water<br />
programmes<br />
• Target land restoration: Rehabilitating degraded land into productive land<br />
Reduce the impact of poverty through social services<br />
• Target of social services such as education, public transport, and social services but not agriculture in<br />
particular<br />
Enhance social cohesion and develop human capital<br />
• Target educational institutions: Ensure that FET colleges, teritiary institutions and provincial<br />
academies offer relevant and needed courses and skills development programmes<br />
• Target crime, female employment and the informal sector: To ensure social conhesion and<br />
stability<br />
Strengthen sustainable development<br />
• Target a wide variety of environmental issues to ensure sustainable development. These include<br />
environmental education, management and planning. Also included are water management,<br />
renewable energy, recycling and reclamation<br />
Source: Adapted from Mpumalanga Provincial Government, 2008<br />
92
The Mpumalanga Economic Growth and <strong>Development</strong> Path 2011<br />
Published in 2011, the Mpumalanga Economic Growth and <strong>Development</strong> Path (MEGDP) follows on<br />
from the New Growth Path and aims to foster economic development in the province while creating<br />
jobs and alleviating poverty. The illustration below outlines the provincial targets:<br />
Figure 49: Mpumalanga Growth and <strong>Development</strong> Path - Targets<br />
Mpumalanga 2010-2020<br />
Target Sectors<br />
• Reduce the currentl employment of 28%<br />
to 15% by 2020 by creating 719 000 jobs<br />
• Increase the income level of 620 000<br />
individuals above the poverty line<br />
• Increase the Human <strong>Development</strong> Index<br />
• Agriculture and forestry<br />
• Mining and energy<br />
• Manufacturing and benefication<br />
• Tourism and cultural inditries<br />
• Increase literacy from the current 40 000<br />
indviduals annually to 63 000 annuallly<br />
• Increase life expectancy from 51 years to<br />
62 years<br />
• Reduce the Geni Coefficient from 0.65 to<br />
0.55<br />
• Achieve an annual provincial growth rate<br />
of between 5 and 7 percent<br />
Source: Adapted from Mpumalanga Provincial Government. (2011)<br />
Despite the decline in earnings and employment in the agriculture sector, MEGDP expresses the<br />
view that the sector has potential to expand through research, better crop selection, skills<br />
development and growth in the value-add and agro-processing industries. The policy focuses on<br />
production of sugar cane, nuts, vegetables, citrus and sub-tropical fruits in the Lowveld and summer<br />
grains, oil seeds and deciduous fruits in the Highveld. Animal production will also be prioritised in the<br />
Highveld. The emplyment target for the sector is 27 000 new jobs by 2020 55 .<br />
The MEGDP also outlines potental opportunities in the forestry sector with an employment creation<br />
target of 4500 jobs by 2020. The high-potential sub-sectors are:<br />
■ Community forestry: By involving local communities in forestry initiatives on communal land, it is<br />
hoped that local households are able to benefit through job creation and poverty alleviation;<br />
■ Charcoal production: With increasing demand for charcoal in South Africa, this sub-sector has the<br />
potential to create opportunities for SMMEs. Some large manufacturers have demonstrated their<br />
55 Mpumalanga Provincial Government. (2011)<br />
93
willingness to partner with smaller firms in order to meet demand. This has been accompanied by<br />
funding, training, and in initial investment;<br />
■ Afforestation: Mpumalanga is one of three provinces (along with KwaZulu Natal and the Eastern<br />
Cape) which are able to initiate and sustain afforestation projects. The province will be able to<br />
benefit from this unique advantage and provide opportunities for local communities;<br />
■ Industrial forestry: These are large-scale forests that are planted for the specific purpose of<br />
supplying raw materials to other sectors, including mining and construction. Industrial forests are<br />
the largest suppliers of wood in the country which could translate into positive opportunities for<br />
provinces that have the capacity for forestry;<br />
■ Multiple-use forestry: These forests are used for purposes other than wood production. These<br />
include other forest by-products as well and tourism; and<br />
■ Forest protection: With the high value attached to forests, government has prioritised the<br />
safeguarding of forests from diseases, weeds, pests and wildfires. This requires the coordination<br />
of public and private resources and is likely to create employment opportunities.<br />
In order to achieve growth and create employment in the identified priority sub-sectors, the MEGDP<br />
has identified key areas for intervention. These are presented in the diagram below:<br />
Figure 50: Mpumalanga Growth and <strong>Development</strong> Path – Key intervention areas for agriculture and<br />
forestry<br />
Infrastructure<br />
<strong>Development</strong><br />
(Dams, irrigation, roads,<br />
silos, mechinasation,<br />
electricity)<br />
Skills <strong>Development</strong><br />
Support to small-scale<br />
farmers and agri-business<br />
Fast track settlement of<br />
land claims<br />
Optimal utlisation of<br />
restituted and distributed<br />
land<br />
Increase acquisition of<br />
agricultural land for the<br />
previously disadvantaged<br />
Address legislation gaps to<br />
create balance between<br />
mining and agriculture<br />
competition<br />
Source: Adapted from Mpumalanga Provincial Government. (2011)<br />
4.1.7 Northern Cape<br />
4.1.7.1 Provincial overview<br />
The Northern Cape is the largest province in South Africa. The province is a predominantly semi-arid<br />
region, prone to extreme temperatures. Occupying 36 million hectares, the province occupies almost<br />
a third of South Africa’s total land area. Almost 33.8 million hectares of this land is classified as<br />
farmland with 86% of the area dedicated to grazing, 13% for nature conservation and just 1% as<br />
94
arable land. This land distribution is indicative of the nature of agriculture production in the province<br />
i.e. a large livestock-farming sub-sector and intensive-irrigated cropping 56 .<br />
Cattle and sheep farming are located predominantly in the southeast and northeast of the province<br />
while game farms tend to be spread through the middle. In 2006, income derived from livestock<br />
(cattle, sheep and goats) activities accounted for 37% of provincial gross farming income. Sheep<br />
farming is the second-largest agricultural sector in the Northern Cape while 4% of all South Africa’s<br />
beef is produced in the province. Wool and mohair production are also strong industries in the<br />
57<br />
province with 11% of South Africa’s wool and 7% of South Africa’s mohair .<br />
Crop farming takes place mainly in the fertile areas along the Northern Cape’s main rivers i.e. the Vaal<br />
and Orange. The table below lists the major crop forming products from the province.<br />
Table 14: Key crop farming products in the Northern Cape<br />
Key crops produced in the Northern Cape<br />
Product<br />
Table grapes<br />
Wine<br />
Additional Notes<br />
■ Second largest producer of table grapes in South Africa, producing 25% of<br />
the country’s table grape output<br />
■ Exported predominantly to Europe and the United Kingdom<br />
■ Base of the Orange River Wine Cellars Cooperative – the second largest<br />
wine cooperative in the world with 740 wine-grape farmers and 445 juicegrape<br />
famers<br />
■ Supplying the local market<br />
Dried fruit<br />
Lucerne<br />
Field Crops<br />
Source: Adapted from Maisela, RJ., (2007)<br />
■ Produces 4% of the world’s total dried vine fruit<br />
■ Produces 90% of South Africa’s total dried vine fruit<br />
■ Approximately 80% of raisins are exported to Europe, Japan, Taiwan,<br />
Korea, Canada and the US<br />
■ One of the most important crops in the province<br />
■ Climatic conditions are optimal for production of high-quality hay<br />
■ Produces 18% of South Africa’s wheat. Approximately 55 000 hectares of<br />
land under maize production<br />
■ Produces approximately 4.6% of South Africa’s maize<br />
■ Produces approximately 20% of South Africa’s groundnuts<br />
56 Maisela, RJ., (2007). “Realising agricultural potential in land reform: The case of Vaalharts irrigation scheme in the Northern<br />
Cape Province”. Thesis submitted in partial fulfilment of the requirements for the degree of Magister Philosophiae in Land And<br />
Agrarian Studies. Faculty of Economic and Management Studies, University of Western Cape. September 2007<br />
57 Maisela, RJ., (2007)<br />
95
4.1.7.2 Agricultural sector contribution to GDP<br />
Figure 51: Sectoral contribution to regional GDP in the Northern Cape – 2010<br />
Financial<br />
intermedidation,<br />
insurance, real<br />
estate and<br />
business services,<br />
14.8%<br />
Community, social<br />
and personal<br />
services, 10.3%<br />
General<br />
government<br />
services, 15.1%<br />
Agriculture,<br />
forestry and<br />
fishing, 6.5%<br />
Transport, storage<br />
and<br />
communication,<br />
10.4%<br />
Wholesale and<br />
retail trade,<br />
catering and<br />
accomodation,<br />
11.4%<br />
Construction,<br />
1.7%<br />
Electricity, gas and<br />
water, 2.0%<br />
Mining and<br />
quarrying, 24.1%<br />
Manufacturing,<br />
3.8%<br />
Source: Statistics South Africa, 2011 (Adapted from Quantec, by KPMG)<br />
4.1.7.3 Job creation within the agricultural sector of the Northern Cape<br />
The agriculture sector in the Northern Cape has fared the worst in terms of job losses. The<br />
unemployment rate in the province has risen to 27.4% and off the 53 000jobs that were shed in the<br />
province in 2009, agriculture lost 24 000 58 .<br />
58 Jenkins, H. (2009). “Speech by Premier of the Northern Cape, Ms Hazel Jenkins, on the occasion of the Provincial Economic<br />
Summit”. Mayibuye Centre, Galeshewe. 2 December 2009<br />
96
Figure 52: Employment in the agriculture sector in Northern Cape 2005 - 2011<br />
70 000<br />
60 000<br />
50 000<br />
40 000<br />
30 000<br />
20 000<br />
10 000<br />
-<br />
1Q2005<br />
3Q2005<br />
1Q2006<br />
3Q2006<br />
1Q2007<br />
3Q2007<br />
1Q2008<br />
2Q2008<br />
3Q2008<br />
Number of employees<br />
4Q2008<br />
1Q2009<br />
2Q2009<br />
3Q2009<br />
4Q2009<br />
1Q2010<br />
2Q2010<br />
3Q2010<br />
4Q2010<br />
1Q2011<br />
2Q2011<br />
Year and Quarter<br />
Source: Statistics South Africa, 2011 (Adapted from Quantec, by KPMG)<br />
4.1.7.4 Northern Cape Provincial Growth and <strong>Development</strong> Strategy<br />
The Northern Cape PGDS (NCPGDS) outlines two primary objectives for the province. They are:<br />
■ Promoting the growth, diversification and transformation of the provincial economy; and<br />
■ Poverty reduction through social development.<br />
In order to achieve these objectives, the province has targeted skills development, improving the<br />
effectiveness and efficiency of development institutions, establishing, and improving infrastructure.<br />
Agriculture and agro-processing was identified as high-potential economic sectors, along with fishing<br />
and mariculture, mining and mineral processing, transport, manufacturing and tourism.<br />
The agriculture sector was noted to be facing two major challenges. The first involved the lack of<br />
transformation in the sector with emerging farmers needing assistance in accessing commercial<br />
markets as well as access to land and farming resources. The second challenge facing the sector<br />
was the need to diversify the agricultural outputs of the province in order to manage the risks<br />
involved as well to produce materials that would feed the agro-processing sub-sector.<br />
The diagram below outlines the province’s measures to stimulate and grow the agriculture sector:<br />
97
Figure 53: Northern Cape initiatives to stimulate growth<br />
Develop the agricultural economy<br />
• Promote investment in primary agricultural production<br />
• Use of more efficient irrigation methods<br />
• Promotion of crop diversification to reduce risk<br />
• Promote agro-processing to increase the value of agricultural output within the province<br />
• Promote export of high-value agricultural produce<br />
Transform ation of the agriculture sector<br />
• Facilitate land reform processess to provide land to emerging black farmers<br />
• Provide water rights for emerging black famrers<br />
• Transfer of skills and knowledge to emerging black farmers<br />
• Provision of credit to emerging black farmers<br />
Source: Adapted from the Northern Cape Provincial Growth and <strong>Development</strong> Strategy, 2006<br />
Northern Cape Agriculture and Agro-processing Sector Strategy<br />
The Northern Cape Agriculture and Agro-processing Sector Strategy addresses the dual challenge<br />
originally highlighted in the Northern Cape PGDS – balancing the need to increase the value and<br />
output of the agriculture sector while pursuing transformation.<br />
In developing an integrated strategy for the agriculture sector, the Northern Cape Province first<br />
compiled and prepared commodity strategies for the grain industry, cotton sector, livestock and food<br />
security. The common element in the strategies was to promote primary production while<br />
encouraging public-private partnerships. The strategy also acknowledged the need for the province to<br />
become more involved in the processing of its primary agricultural products with producers becoming<br />
more involved in the retail supply chain.<br />
Concerning agro-processing ventures, the Sector Strategy noted that the biggest challenges were the<br />
lack of access to capital and the low level of entrepreneurship in the sector. The lack of technical<br />
skills was also acknowledged and the lack of competitiveness against imported products.<br />
In concluding the strategy highlights the requirements for a successful agro-processing sector.<br />
Amongst the key interventions are:<br />
■ Market intelligence and information services;<br />
■ The establishment of an advisory centre to assist SMMEs with market information, administrative<br />
and procedural support, investment facilitation, and coordination of technological and financial<br />
support;<br />
■ Support from the Land Bank, Industrial <strong>Development</strong> Corporation and Khula;<br />
■ Selection of projects from core agricultural commodities in the Northern Cape; and<br />
■ Assessment of crops in terms of macro- and micro-economic conditions and competitiveness.<br />
Northern Cape SMME Strategy<br />
The Northern Cape SMME strategy was developed to provide immediate and direct support to<br />
SMMs in the province. The provincial government recognises the potential of SMMEs to make a<br />
98
significant contribution to the local economy. The proposed strategy listed the following<br />
recommendations:<br />
■ Establishment of an SMME Government Support Cluster: A grouping of government departments<br />
with economic development programmes that would present a single SMME strategy;<br />
■ Rationalise available funding and existing support structures: Government departments should [p;<br />
funds, staff, and facilities to provide assistance to SMMEs. Support should be differentiated<br />
according to business type i.e. formal small businesses as well as survivalist operations;<br />
■ Private sector support: Establishment of a forum to engage the private sector, particularly from<br />
Chambers of Business and corporate enterprises such as the mining houses;<br />
■ Apex Fund: Engagement with the national Apex Fund for SMMEs so that SMMEs in the Northern<br />
Cape are able to access funding; and<br />
■ Affirmative procurement: Reform of the procurements processes so that SMMEs are not<br />
hampered by tedious tender procedures, late payments and that they benefit from affirmative<br />
procurement.<br />
The strategy also laid out an action plan that highlighted the required activities, the responsible<br />
parties and the timeframes.<br />
4.1.8 North West Province<br />
4.1.8.1 Provincial overview<br />
The North West province is predominantly rural with approximately 65% of its population residing in<br />
rural areas. As with the rest of the country, the agriculture sector in North West Province is dualistic<br />
in nature, with a well-developed commercial sub-sector and a large subsistence sub-sector.<br />
Regarded as one of the poorest provinces in South Africa, it is also considered to have the most<br />
potential with regards to agricultural development. However, this potential has been thwarted due to<br />
the misuse and underutilisation of communal farming areas. This is attributable to a combination of<br />
factors such as overgrazing, lack of public sector support and ownership dynamics 59 .<br />
The North West province comprises three distinct climatic zones with various types of agriculture<br />
being practice in each. The central and southern region is home to extensive mixed crop farming,<br />
including the cultivation of maize, wheat, cotton, groundnuts, sunflowers, citrus and tobacco. The<br />
60<br />
province produces approximately a third of South Africa’s maize output and 15% of its wheat .<br />
The eastern and northeastern part of the province is wetter and is dominated by livestock farming<br />
and some crop farming. The livestock industry in the province is small relative to the rest of the<br />
country and accounts for just 6.6% of the country’s animals. Nevertheless, the province reported an<br />
18% increase in total livestock between 2005 and 2006 with a 16% increase in production during the<br />
same period. As the province with the second highest increase, this signifies some potential for the<br />
61<br />
livestock industry .<br />
The more arid western sections of the province are home to large beef and cattle herds as well as<br />
game farms. Favourable located close to Johannesburg, this part of the province benefits from<br />
59 Cloete, PC., (2010). “Economic growth and development through agriculture: The case of the North West Province in South<br />
Africa”, PhD Dissertation submitted to the Department of Agricultural Economics. University of the Free State. South Africa.<br />
May 2010<br />
60 North West Business. Economic Sectors/ Agriculture and Agri-Processing.<br />
http://www.northwestbusiness.co.za/pls/cms/ti_secout.secout_prov?p_sid=1&p_site_id=138 (Accessed 2 November 2011)<br />
61 Cloete, PC., (2010)<br />
99
tourism and eco-tourism with the Sun City resort as well as the Pilanesburg and Madikwe game<br />
reserves 62 .<br />
Although the province does provide potential for small and developing farmers, there are major<br />
challenges around product limitations, access to credit, human capacity and market access. The<br />
diagram below expands on these challenges facing these farmers.<br />
Figure 54: Challenges facing small-scale farmers in North West Province<br />
• Affordability and<br />
availability of highquality<br />
inputs<br />
•Inefficient and<br />
unsustainable farming<br />
practices<br />
• Lack of collateral<br />
amongst small-scale<br />
farmers<br />
• Higher cost of credit<br />
Production<br />
limitations<br />
Access to credit<br />
Human capacity<br />
Market access<br />
•Lack of skills and<br />
knowledge of new<br />
farming technologies<br />
• Poor health of farmers<br />
lowers productivity<br />
•Poor transport<br />
infrastructure<br />
•No access to transport<br />
and storage facilities<br />
•Limited access to<br />
credit and information<br />
Source: Adapted from Cloete, PC., (2010)<br />
4.1.8.2 Agricultural sector contribution to GDP<br />
Despite the fact that agriculture is a relatively small contributor to the North West GDP-R, it is still a<br />
major employer in the province. Employing approximately 9% of the workforce, the sector is the<br />
second largest employer after mining. Nonetheless, the province has experienced high rates of job<br />
shedding and has one of the highest unemployment rates in the country. As seen in the graph below,<br />
the agriculture sector has almost halved its employment since 2005.<br />
62 orth West Business. Economic Sectors/ Agriculture and Agri-Processing.<br />
http://www.northwestbusiness.co.za/pls/cms/ti_secout.secout_prov?p_sid=1&p_site_id=138 (Accessed 2 November 2011)<br />
100
Figure 55: Sectoral contribution to regional GDP in the North West Province – 2010<br />
Financial<br />
intermedidation,<br />
insurance, real<br />
estate and<br />
business services,<br />
16.6%<br />
Community, social<br />
and personal<br />
services, 9.2%<br />
General<br />
government<br />
services, 13.7%<br />
Agriculture,<br />
forestry and<br />
fishing, 2.9%<br />
Mining and<br />
quarrying, 25.4%<br />
Transport, storage<br />
and<br />
communication,<br />
9.5%<br />
Wholesale and<br />
retail trade,<br />
catering and<br />
accomodation,<br />
11.5%<br />
Construction,<br />
2.7%<br />
Manufacturing,<br />
7.5%<br />
Electricity, gas and<br />
water, 1.0%<br />
Source:<br />
Statistics South Africa, 2011 (Adapted from Quantec, by KPMG)<br />
4.1.8.3 Job creation within the agricultural sector of the North West<br />
Figure 56: Employment in the agriculture sector in North West Province 2005 - 2011<br />
90 000<br />
80 000<br />
70 000<br />
60 000<br />
50 000<br />
40 000<br />
30 000<br />
20 000<br />
10 000<br />
-<br />
1Q2005<br />
3Q2005<br />
1Q2006<br />
3Q2006<br />
1Q2007<br />
3Q2007<br />
1Q2008<br />
2Q2008<br />
3Q2008<br />
4Q2008<br />
1Q2009<br />
2Q2009<br />
Number of employees<br />
3Q2009<br />
4Q2009<br />
1Q2010<br />
2Q2010<br />
3Q2010<br />
4Q2010<br />
1Q2011<br />
2Q2011<br />
Year and quarter<br />
Source: Statistics South Africa, 2011 (Adapted from Quantec, by KPMG)<br />
101
In 2009, the North West province recorded the lowest regional growth in South Africa, with a decline<br />
of 2%. This came on the back of its largest economic sector, mining and quarrying, declining by<br />
5.5%. Agricultural output in the province also declined during the same period. The percentage<br />
contribution of agricultural to the North West regional GDP has also declined, dropping from 7.1% in<br />
1996 to 5.2% in 2004 and to 2.9% in 2010.<br />
4.1.8.4 North West Provincial Growth and <strong>Development</strong> Strategy<br />
The North West Province PGDS was launched in 2004 and presents a 10-year plan to achieve the key<br />
provincial developmental goals, as highlighted at the National Growth and <strong>Development</strong> Summit in<br />
2003. The provincial government highlighted two primary goals that it believed would assist in<br />
tackling unemployment, poverty, skills development and economic growth. These goals are as<br />
follows:<br />
■ The Economic Goal: The province would require an average annual growth rate of 6.6% between<br />
2004 and 2014 to ensure sustainable economic development. The investment required from both<br />
the public and private sector was R6.3 billion per annum.<br />
■ The Poverty Eradication Goal: The province would have to provide basic needs to all its residents<br />
thus preparing all sectors of the population for economic development. An investment of R854<br />
million per year was required to achieve this goal.<br />
The target growth rate for the agriculture sector was 6.6% annually with agriculture and rural<br />
development forming one of the central pillars of development. The NWPGDS targets the agriculture<br />
sector by aiming to foster and support cooperatives and emerging farmers and facilitating access to<br />
markets. In addition, there was a commitment to finance infrastructure, machinery, agro-processing,<br />
and technology and skills development. The province also outlined the need to speed up the land<br />
reform process in order to facilitate access to agricultural activities for previously disadvantaged<br />
sections of the population.<br />
4.1.9 Western Cape<br />
4.1.9.1 The agricultural sector in the Western Cape<br />
Agriculture is a key sector in the Western Province economy and contributes significantly to South<br />
Africa’s agricultural production. With 13 million hectares of land under agricultural production, the<br />
province accounts for 20.8% of South Africa’s total agricultural production and between 55 and 60%<br />
of the country’s agricultural exports 63 . The sector also has strong linkages to the food and beverage<br />
sectors and to the tourism sector through its wine industry. These linkages ensure that the sector is<br />
not only tied to agricultural market forces but also benefits from growth in the primary and secondary<br />
sectors 64 .<br />
Due to unique climatic conditions and physical resources, the province’s agricultural profile is very<br />
different to that of the rest of the country. The horticulture sector is the largest contributor to gross<br />
farming income in the Western Cape, making up 50% of the provincial total. In contrast, the<br />
provincial contribution of field crops and animal farming is significantly smaller than in the other<br />
65<br />
provinces .<br />
The Western Cape is the largest producer of essential oils in the country, accounting for 28% of all<br />
exports. In terms of wine production, the province produces 90.5% of South Africa’s total wine. In<br />
addition, the Western Cape is the second largest producer of wheat and the sole cultivator of hops.<br />
In the horticulture sub-sector, the province grows 95% of the country’s indigenous fynbos flowers.<br />
63 Western Cape Department of Agriculture. (2010). “Strategic Plan 2010/2011 – 2014/2015”. Strategic Plan for the Fiscal<br />
Years 2010/2011 – 2014/2015. Date of tabling: 2 March 2010<br />
64 Laubscher, P. (2011). “A macro-economic assessment of the Western Cape economys’ sectoral and industrial prospects :<br />
2010-2015, including an assessment of inter-industry linkages”. A research report prepared for the Department of Economic<br />
<strong>Development</strong> and Tourism and the Provincial Government of the Western Cape<br />
65 Wesgro. (2010). “Agriculture Sector Brief”. Western Cape Investment and Trade Promotion <strong>Agency</strong><br />
102
The dairy sub-sector is also important with the Western Cap housing a quarter of all national dairy<br />
producers in South Africa (second highest in the country) 66 .<br />
The table below outlines the main agricultural products and activities within the Western Cape.<br />
Table 15: Key agricultural products and activities in the Western Cape<br />
Key agricultural products and activities in the Western Cape<br />
Sub-sector Key Products Key Activities Additional Notes<br />
Horticulture<br />
Viticulture<br />
Fruit production and<br />
processing<br />
Vegetable production<br />
and processing<br />
Winter grains<br />
■ Cut flowers<br />
■ Flower Bulbs<br />
■ Indigenous fynbos<br />
and wild flowers<br />
■ Essential oils<br />
■ Drinking wine<br />
■ Rebate wine<br />
■ Distilling wine<br />
■ Grape juice<br />
■ Grape concentrate<br />
■ Fruit juice<br />
■ Concentrates<br />
■ Dried fruit<br />
■ Canned fruit<br />
■ Deciduous fruit<br />
■ Citrus and<br />
subtropical fruit<br />
■ Commercial farming<br />
■ Breeding and<br />
hybridisation<br />
■ Processing for<br />
essential oils<br />
■ Wine production<br />
■ Wholesale<br />
■ Distillation<br />
■ Growing<br />
■ Canning<br />
■ Drying<br />
■ Organic produce<br />
■ Fresh produce<br />
(tomatoes, potatoes<br />
and onions)<br />
■<br />
■ Growing<br />
Vegetable seed<br />
■<br />
■ Processing<br />
Processed<br />
vegetable products<br />
■ Frozen vegetables<br />
■ Dry beans<br />
■ Cereals<br />
■ Grain feeds<br />
■ Oil seeds and<br />
products<br />
■ Wheat<br />
■ Barley and malt<br />
■ Growing<br />
■ Processing<br />
■ Gross income from horticulture<br />
products grew by approximately<br />
30% between 2002 and 2007<br />
■ Strong wine industry with total<br />
turnover growing by 79%<br />
between 2003 and 2008 due to<br />
good export performance<br />
■<br />
■ 4390 primary wine producers and<br />
388 cellars in the province<br />
■ Growing citrus sector that has<br />
experienced annual average<br />
growth of 9.9% since 1990 and is<br />
valued at R1.8 billion annually<br />
■<br />
■ Largest producer of deciduous<br />
fruit in South Africa. The province<br />
produces 2% of global apple<br />
production and 1% of global pear<br />
production.<br />
■ Second largest producer of wheat<br />
in the country with 46% of the<br />
country’s wheat fields although<br />
there has been a decline in recent<br />
years<br />
■ Canola grown exclusively in the<br />
province. Annual production of<br />
40 000 tons<br />
■ Major producer of olives and olive<br />
oil. 8000 tons of olives produced<br />
in 2007<br />
66 Wesgro. (2010). “Agriculture Sector Brief”. Western Cape Investment and Trade Promotion <strong>Agency</strong><br />
103
Key agricultural products and activities in the Western Cape<br />
Sub-sector Key Products Key Activities Additional Notes<br />
Animal products<br />
Tea<br />
■ Dairy products<br />
■ Poultry and eggs<br />
■ Red and white<br />
meats<br />
■ Exotic meats<br />
■ Raw hides, skin and<br />
leather<br />
■ Wool<br />
■ Game<br />
■ Rooibos<br />
■ Commercial farming<br />
■ Processing<br />
■ Tanning<br />
■ Dressing and<br />
packing<br />
■ Cultivating<br />
■ Processing<br />
■ Packaging<br />
Source: Adapated from Wesgro. (2010). “Agriculture Sector Brief”, Western Cape Investment and Trade Promotion <strong>Agency</strong><br />
4.1.9.2 Provincial agricultural contribution to GDP<br />
■ Total gross farming revenue<br />
generated from animal products in<br />
the Western Cape increased<br />
173.6% between 2003 and 2007<br />
■ Poultry production has grown<br />
75% between 1999 and 2009 due<br />
to consumer demand. Demand is<br />
forecast to grow by 25% by 2014.<br />
■ Growth in red meat production<br />
has slowed down due to sluggish<br />
demand.<br />
In 2009, agriculture, forestry and fishing contributed 3.9% to the Western Province regional GDP. The<br />
contribution of the sector to the provincial economy has declined in recent years. However, it is still<br />
the largest Western Cape sectoral contributor to the national GDP. The relatively small contribution to<br />
the Western Cape GDP-R is more an indicator of the growing prominence of the secondary and<br />
tertiary sectors in the province.<br />
Figure 57: Sectoral contribution to regional GDP in the Western Cape – 2010<br />
Community, social<br />
and personal<br />
services, 5.2%<br />
General government<br />
services, 10.1%<br />
Agriculture, forestry<br />
and fishing, 3.9%<br />
Mining and<br />
quarrying, 0.2%<br />
Manufacturing,<br />
17.2%<br />
Electricity, gas and<br />
water, 1.5%<br />
Construction, 4.7%<br />
Financial<br />
intermedidation,<br />
insurance, real<br />
estate and business<br />
services, 32.4%<br />
Wholesale and retail<br />
trade, catering and<br />
accomodation,<br />
14.7%<br />
Source: Statistics South Africa, 2011 (Adapted from Quantec, by<br />
KPMG)<br />
Transport, storage<br />
and communication,<br />
10.2%<br />
104
4.1.9.3 Job creation within the agricultural sector of the Western Cape<br />
The Western Cape agriculture sector is still a significant employer, both at the national and provincial<br />
level. Employment levels in the sector have declined, as illustrated in the graph below, from a peak<br />
of 185 000 employees in 2005 to 99 000 in 2011. Despite this decline however, the sector still<br />
employs 15.6% of all South Africa’s farm workers and 7.2% of the provincial workforce 67 .<br />
Figure 58: Employment in the agriculture sector in the Western Cape 2005 - 2011<br />
200 000<br />
180 000<br />
160 000<br />
140 000<br />
120 000<br />
100 000<br />
80 000<br />
60 000<br />
40 000<br />
20 000<br />
-<br />
1Q2005<br />
3Q2005<br />
1Q2006<br />
3Q2006<br />
1Q2007<br />
3Q2007<br />
1Q2008<br />
2Q2008<br />
Number of employees<br />
3Q2008<br />
4Q2008<br />
1Q2009<br />
2Q2009<br />
3Q2009<br />
4Q2009<br />
1Q2010<br />
2Q2010<br />
3Q2010<br />
4Q2010<br />
1Q2011<br />
2Q2011<br />
Year and Quarter<br />
Source: Statistics South Africa, 2011 (Adapted from Quantec)<br />
4.1.9.4 Western Cape Provincial and Growth Strategy<br />
Launched in 2006, the Western Cape PGDS outlined the challenges and implementation plan to<br />
address the province’s developmental challenges. According to the PGDS, the province is<br />
predominantly urbanised with 90% of its population residing in cities and towns, even in rural<br />
locations. As opposed to much of the rest of the South Africa, poorer residents tend to migrate to<br />
these cities and towns, while farming in rural locations in dominated by high-income individuals. With<br />
the move away from labour intensive farming towards capital-intensive farming, migration out of the<br />
rural areas has increased. Poverty in the Western Cape therefore has more to do with economic<br />
marginalisation than the rural/urban split 68 .<br />
The PGDS does not specifically address the agriculture sector but does list Environmental Integrity as<br />
one of the four pillars of the development path (along with Growth, Equity and Empowerment). With<br />
the Western Cape economy largely dependent on tourism and agriculture, the need for sustainable<br />
use of the province’s natural resources is emphasised. There is a particular focus on examining the<br />
effects of climate change, energy production, water scarcity and waste and pollution. Nevertheless<br />
there are no agriculture-specific goals within the 2007-2014 action plan.<br />
67 Laubscher, P. (2011).<br />
68 Western Cape Provincial Government. (2006). iKapa Elihlumayo. Western Cape Provincial and Growth Strategy<br />
105
Western Cape Department of Agriculture: Annual Performance Plan 2011-2012<br />
The Western Cape Agriculture Annual Performance Plan (APP) lays out the blueprint for the<br />
agriculture sector in the province. In aligning provincial strategic objectives with those identified at<br />
the national level, the following are key priorities for the Western Cape 69 :<br />
■ Increasing opportunities for growth and jobs;<br />
■ Mainstreaming sustainability and optimising resource-use efficiency;<br />
■ Reducing and alleviating poverty;<br />
■ Integrating service delivery for maximum impact; and<br />
■ Creating opportunities for growth and development in rural areas.<br />
As with the Western Cape PGDS, the APP also addresses the issue of climate change and the<br />
threats posed by the phenomenon. The APP acknowledges that the agriculture sectors as well as the<br />
most marginalised communities are likely to be most affected. The APP commits to producing a<br />
climate change mitigation plan by 2016 that will look to develop alternate crops and better farming<br />
methods.<br />
The APP also articulates the following strategic goals 70 :<br />
■ Support the provincial agricultural sector to at least maintain its export position between 2011 and<br />
2016 by growing its value-added from R14 billion in 2009<br />
■ Ensure that at least 60% of all agricultural land reform projects in the province are successful<br />
between 2011 and 2016<br />
■ Support the sector (farmers and industries) to increase agricultural production (primary provincial<br />
commodities) by at least 10% between 2011 and 2021<br />
■ Optimise the sustainable utilisation of natural resources through conservation methods to<br />
increase agricultural production<br />
■ Increase agricultural economic opportunities in selected rural areas based on socio-economic<br />
needs over a 10-year period.<br />
4.2 Provincial analysis of ownership trends<br />
69 Western Cape Department of Agriculture. (2011). Annual Performance Plan 2011-2012. Provincial Government of the<br />
Western Cape<br />
70 Western Cape Department of Agriculture. (2011). Annual Performance Plan 2011-2012. Provincial Government of the<br />
Western Cape<br />
106
Figure 59 (below) illustrates the breakdown of provincial breakdown of farming units. In 2007, there<br />
were 39 966 active farming units which constitutes a 12.8% decrease compared to the 45 818 active<br />
farming units recorded in 2002. The highest percentage of farming units was in the Free State (19%),<br />
the Western Cape (17%) and Northern Cape (13%).<br />
Figure 59: Provincial breakdown of farming unit ownership<br />
North West<br />
12%<br />
Northern Cape<br />
13%<br />
Mpumalanga<br />
9%<br />
Western Cape<br />
17%<br />
Limpopo<br />
7%<br />
Kwa-Zulu Natal<br />
9%<br />
Eastern Cape<br />
10%<br />
Gauteng<br />
4%<br />
Free State<br />
19%<br />
Table 16: Breakdown of national farming units by province<br />
Farming unit ownership<br />
Province<br />
Number of farming units<br />
Eastern Cape 4 006<br />
Free State 7 473<br />
Gauteng 1 773<br />
Kwa-Zulu Natal 3 574<br />
Limpopo 2 934<br />
Mpumalanga 3 523<br />
North West 4 902<br />
Northern Cape 5 128<br />
Western Cape 6 653<br />
National Total 39 966<br />
Source: Census of commercial agriculture, Statistics South Africa, 2007<br />
4.3 Provincial Analysis of financial stability<br />
4.3.1 Capital expenditure<br />
Figure 60 (below) illustrates the breakdown of capital expenditure by province. Total capital<br />
expenditure, in 2007, equalled R2 859 million with the Western Cape, Mpumalanga and North West<br />
spending 29%, 12% and 11% respectively.<br />
107
Figure 60: Provincial breakdown of capital expenditure<br />
North West<br />
12%<br />
Northern Cape<br />
6%<br />
Mpumalanga<br />
12%<br />
Limpopo<br />
8%<br />
Western Cape<br />
29%<br />
Kwa-Zulu Natal<br />
10%<br />
Eastern Cape<br />
7%<br />
Gauteng<br />
7%<br />
Free State<br />
9%<br />
Table 17: Capital expenditure per province<br />
Capital expenditure in agricultural sector<br />
Province Number of farming units Capital expenditure (R ‘000)<br />
Capital expenditure per unit<br />
(R’000)<br />
Eastern Cape 4 006 208 755 52.11<br />
Free State 7 473 247 846 33.17<br />
Gauteng 1 773 211 642 119.37<br />
Kwa-Zulu Natal 3 574 282 775 79.12<br />
Limpopo 2 934 234 306 79.86<br />
Mpumalanga 3 523 340 194 96.56<br />
North West 4 902 329 385 67.19<br />
Northern Cape 5 128 164 747 32.13<br />
Western Cape 6 653 839 431 126.17<br />
National Total 39 966 2 859 081 71.54<br />
Source: Census of commercial agriculture, Statistics South Africa, 2007; KPMG Analysis<br />
108
Figure 61 (below) illustrates the breakdown of capital expenditure, within the agricultural sector, by<br />
asset type. Investment in land, buildings and new developments is highest in the Western Cape,<br />
North West and Mpumalanga. The Western Cape, Kwa-Zulu Natal and Mpumalanga have the largest<br />
expenditure on new assets when compared to other provinces.<br />
Figure 61: Capital expenditure breakdown by asset type<br />
900<br />
800<br />
700<br />
Pre-owned assets<br />
New assets<br />
Land, buildings and development<br />
Rands million<br />
600<br />
500<br />
400<br />
300<br />
200<br />
100<br />
0<br />
Table 18: Capital expenditure breakdown by asset<br />
Capital expenditure in agricultural sector<br />
Province<br />
Land, buildings and<br />
development<br />
New assets<br />
Pre-owned assets<br />
Eastern Cape 135 429 46 032 27 294<br />
Free State 119 909 82 840 45 097<br />
Gauteng 143 011 43 425 25 206<br />
Kwa-Zulu Natal 143 991 108 411 30 373<br />
Limpopo 140 557 72 680 21 069<br />
Mpumalanga 166 132 133 678 40 384<br />
North West 181 061 76 086 72 238<br />
Northern Cape 95 174 49 093 20 480<br />
Western Cape 513 488 228 204 97 739<br />
National Total 1 638 752 840 449 379 880<br />
109
Source: Census of commercial agriculture, Statistics South Africa, 2007; KPMG Analysis<br />
4.3.2 Farming debt<br />
Figure 62 (below) illustrates the distribution of farming debt by province. Farming debt, in 2007,<br />
equalled R39 580 million with the provinces contributing the largest proportion being the Western<br />
Cape (24%), Free State (17%) and North West (11%).<br />
Figure 62: Provincial breakdown of farming debt<br />
North West<br />
11%<br />
Northern Cape<br />
9%<br />
Mpumalanga<br />
10%<br />
Western Cape<br />
24%<br />
Limpopo<br />
8%<br />
Kwa-Zulu Natal<br />
10%<br />
Eastern Cape<br />
7%<br />
Gauteng<br />
4%<br />
Free State<br />
17%<br />
Table 19: Distribution of farming debt by ownership type<br />
Farming debt by province<br />
Province Farming debt (R ‘000)<br />
Eastern Cape 2 824 281<br />
Free State 6 686 495<br />
Gauteng 1 671 981<br />
Kwa-Zulu Natal 3 875 851<br />
Limpopo 3 163 171<br />
Mpumalanga 3 945 600<br />
North West 4 238 135<br />
Northern Cape 3 555 474<br />
Western Cape 9 619 406<br />
National Total 39 580 394<br />
Source: Census of commercial agriculture, Statistics South Africa, 2007<br />
Figure 63 (below) depicts the distribution of the agricultural sector’s farming debt by province and<br />
creditor type. Commercial banks and private individuals remain the largest creditor types amongst all<br />
nine provinces.<br />
110
Figure 63: Farming debt distribution by province and creditor type<br />
R million<br />
12 000 000<br />
10 000 000<br />
8 000 000<br />
6 000 000<br />
Government<br />
Land bank<br />
Co-op/Agric companies<br />
Other financial institutions<br />
Private persons<br />
Commercial banks<br />
4 000 000<br />
2 000 000<br />
0<br />
Source: Census of commercial agriculture, Statistics South Africa, 2007<br />
4.3.3 Market value of assets<br />
Figure 64 (below) depicts the distribution of the agricultural sector’s assets by province. The Western<br />
Cape, Free State and Kwa-Zulu Natal possess the largest proportions of the sector’s assets, based on<br />
market value, with 24%, 14% and 11% respectively.<br />
Figure 64: Market value of agricultural sector assets by province<br />
North West<br />
9%<br />
Northern Cape<br />
10%<br />
Mpumalanga<br />
10%<br />
Western Cape<br />
24%<br />
Limpopo<br />
8%<br />
Kwa-Zulu Natal<br />
11%<br />
Eastern Cape<br />
10%<br />
Gauteng<br />
4%<br />
Free State<br />
14%<br />
Source: Census of commercial agriculture, Statistics South Africa, 2007<br />
111
Table 20: Market value of agricultural sector assets by province<br />
Market value of agricultural assets<br />
Province Market value of assets (R ‘000)<br />
Eastern Cape 17 576 321<br />
Free State 25 061 608<br />
Gauteng 7 422 247<br />
Kwa-Zulu Natal 19 577 781<br />
Limpopo 13 762 348<br />
Mpumalanga 18 198 834<br />
North West 16 497 196<br />
Northern Cape 17 374 774<br />
Western Cape 44 054 287<br />
National Total 161949075<br />
Source: Census of commercial agriculture, Statistics South Africa, 2007<br />
Figure 65 (below) depicts the breakdown of agricultural sector assets by province and asset type.<br />
Gauteng, Free State and Eastern Cape are the three provinces with the highest value of farm land<br />
assets.<br />
Figure 65: Breakdown of farming assets by province and asset type<br />
R million<br />
50 000<br />
45 000<br />
40 000<br />
35 000<br />
30 000<br />
25 000<br />
20 000<br />
Other farming assets<br />
Vehicles, machinery, equipment and tools<br />
Tractors<br />
Fixed improvements<br />
Farm land<br />
15 000<br />
10 000<br />
5 000<br />
0<br />
Source: Census of commercial agriculture, Statistics South Africa, 2007<br />
4.3.4 Losses<br />
Figure 66 (below) illustrates the total farming losses, by province and type, experienced by the<br />
agricultural sector in 2007. The industry lost approximately R2 832 million with losses due to disaster<br />
and accidents being the main contributor to losses amongst all nine provinces. Losses due to<br />
disasters and accidents affected pastures, products (livestock, crops and aquaculture) and<br />
buildings/equipment with the highest losses occurring due to damage to products. Another concern<br />
is burglary and stock theft, which, behind losses to disaster and accidents, are the second and third<br />
highest components of farming losses. Burglary appears to be of greatest concern in the Northern<br />
112
Cape and Eastern Cape whilst stock theft is highest in the Free State and Eastern Cape, followed<br />
closely by the North West and Kwa-Zulu Natal.<br />
Figure 66: Farming losses by province and type<br />
450<br />
400<br />
350<br />
300<br />
R million<br />
250<br />
200<br />
150<br />
100<br />
50<br />
0<br />
Losses due to disaster and accidents<br />
Burglary<br />
Pilfering and stealing of crops<br />
Stock Theft<br />
Other losses<br />
Absence arising from injury or consequences of crime<br />
Lifting and stealing of tools<br />
Predators<br />
Veld and forest fires and natural disasters<br />
Source: Census of commercial agriculture, Statistics South Africa, 2007<br />
4.3.5 Gross farming income<br />
Figure 67 (below) illustrates the gross farming income for the agricultural sector per province, in<br />
2007. Farming income, on a national basis, equalled R76 604 million in 2007 with the Western Cape,<br />
Free State and Mpumalanga being the highest contributors to farming income.<br />
Figure 68 (below) indicates the income generated through field crops (maize, wheat and sugar cane)<br />
and horticultural products (potatoes, oranges and viticulture).In terms of field crops; the Free State,<br />
Kwa-Zulu Natal and Mpumalanga are the highest income generators with these three provinces<br />
accounting for approximately 65% of the R16 479 million generated nationally. The Western Cape,<br />
Limpopo and Mpumalanga are the highest income generators in terms of horticultural products<br />
accounting for approximately 70% of the R13 281 million generated nationally.<br />
113
Figure 67: Gross farming income on a provincial level<br />
18 000<br />
16 000<br />
14 000<br />
12 000<br />
R million<br />
10 000<br />
8 000<br />
6 000<br />
4 000<br />
2 000<br />
0<br />
Source: Census of commercial agriculture, Statistics South Africa, 2007<br />
Figure 68: Gross farming income for field crops and horticultural products on a provincial level<br />
9 000<br />
8 000<br />
Field crops<br />
Horticultural<br />
7 000<br />
6 000<br />
R million<br />
5 000<br />
4 000<br />
3 000<br />
2 000<br />
1 000<br />
0<br />
Source: Census of commercial agriculture, Statistics South Africa, 2007<br />
Figure 69 (below) illustrates the income generated through selected animals and animal products per<br />
province. In terms of animals; the North West, Free State and Western Cape are the highest income<br />
generators and these three provinces account for approximately 45% of the R33 323 million<br />
generated nationally. The Western Cape, Eastern Cape, and Kwa-Zulu Natal are the highest income<br />
generators with regards to animal products, accounting for approximately 56% of the R10 113 million<br />
generated nationally.<br />
114
Figure 69: Gross farming income for field crops and horticultural products on a provincial level<br />
6 000<br />
5 000<br />
Animals<br />
Animal products<br />
4 000<br />
R million<br />
3 000<br />
2 000<br />
1 000<br />
0<br />
Source: Census of commercial agriculture, Statistics South Africa, 2007<br />
4.4 Subsector analysis<br />
4.4.1.1 Field crops<br />
Figure 70 (below) illustrates the gross farming income for field crops by province. The Free State is<br />
the largest contributor to gross farming income with approximately R4 632 million generated primarily<br />
through maize production. Kwa-Zulu Natal and Mpumalanga are the second and third largest<br />
contributors to gross farming income with approximately R2 992 million and R2 985 million generated<br />
respectively in 2007. Kwa-Zulu Natal’s sugar cane production and Mpumalanga’s maize production<br />
are the largest contributors to their income generated from field crops.<br />
115
Figure 70: Gross farming income for field crops by province<br />
5 000<br />
4 500<br />
4 000<br />
3 500<br />
Rands million<br />
3 000<br />
2 500<br />
2 000<br />
1 500<br />
1 000<br />
500<br />
0<br />
Source: Census of commercial agriculture, Statistics South Africa, 2007<br />
Summer cereals<br />
Figure 71 (below) illustrates the production volume of summer cereals (maize for grain, maize<br />
sorghum and other summer cereals) per province. Summer cereal production on dry land is highest in<br />
the Free State, North West and Mpumalanga with production on irrigated land highest in the<br />
Northern Cape and Mpumalanga. Maize for grain production in Free State, North West and<br />
Mpumalanga contributed to the high production volumes on dry land.<br />
Table 21 is a numerical representation of Figure 71 and depicts the area planted, production volumes<br />
and volumes per hectare of summer cereals for each province. Interestingly, the Free State, despite<br />
its large production volume of summer cereals, only produces approximately 3 metric tons per<br />
hectare of dry land. The highest production volume per hectare of dry land is Kwa-Zulu Natal with<br />
244 969 metric tons of summer cereals produced on 59 167 hectares of dry land.<br />
116
Figure 71: Summer cereal production volume per province<br />
3 000<br />
2 500<br />
Dry land<br />
Irrigated<br />
Metric tons ('000)<br />
2 000<br />
1 500<br />
1 000<br />
500<br />
0<br />
Source: Census of commercial agriculture, Statistics South Africa, 2007<br />
Table 21: Area planted, production volume and production per hectare of summer cereals per<br />
province<br />
Summer cereals Planted hectares Production in metric tons Production per hectare<br />
Province Dry land Irrigated Dry land Irrigated Dry land Irrigated<br />
Eastern Cape 15 586 5 904 51 714 48 203 3.32 8.16<br />
Free State 876 951 53 165 2 641 110 228 836 3.01 4.30<br />
Gauteng 53 145 2 990 176 520 21 433 3.32 7.17<br />
Kwa-Zulu Natal 59 167 19 218 244 969 135 082 4.14 7.03<br />
Limpopo 25 479 15 639 76 057 76 784 2.99 4.91<br />
Mpumalanga 378 929 46 240 1 432 355 283 409 3.78 6.13<br />
North West 554 623 50 383 1 446 761 194 028 2.61 3.85<br />
Northern Cape 22 474 45 553 78 990 391 818 3.51 8.60<br />
Western Cape 42 072 2 279 113 896 9 677 2.71 4.25<br />
National Total 2 028 430 241 364 6 262 376 1 389 273 3.09 5.76<br />
Source: Census of commercial agriculture, Statistics South Africa, 2007; KPMG Analysis<br />
Winter cereals<br />
Figure 72 (below) illustrates the production volume of winter cereals (wheat, barley and other winter<br />
cereals) per province. Winter cereal production on dry land is highest in the Western Cape and Free<br />
State with production on irrigated land highest in the Northern Cape. Wheat production in Western<br />
Cape and Free State contributed to the high production volumes on dry land.<br />
Table 22 is a numerical representation of Figure 72 and depicts the area planted, production volumes<br />
and volumes per hectare of winter cereals for each province. Interestingly, the Western Cape,<br />
despite its large production volume of winter cereals, only produces approximately 2.36 metric tons<br />
117
per hectare of dry land. The highest production volume per hectare of dry land is Mpumalanga with<br />
19 561 metric tons of winter cereals produced on 6 507 hectares of dry land.<br />
Figure 72: Winter cereal production volume per province<br />
800<br />
700<br />
Dry land<br />
Irrigated<br />
600<br />
Metric tons ('000)<br />
500<br />
400<br />
300<br />
200<br />
100<br />
0<br />
Source: Census of commercial agriculture, Statistics South Africa, 2007<br />
Table 22: Area planted, production volume and production per hectare of winter cereals per province<br />
Winter cereals Planted hectares Production in metric tons Production per hectare<br />
Province Dry land Irrigated Dry land Irrigated Dry land Irrigated<br />
Eastern Cape 8 165 2 263 15 517 8 202 1.90 3.62<br />
Free State 220 857 19 342 488565 69 058 2.21 3.57<br />
Gauteng 1 188 501 3 054 1 958 2.57 3.91<br />
Kwa-Zulu Natal 4 380 4 795 9 727 23 063 2.22 4.81<br />
Limpopo 8 217 5 131 17 277 25 900 2.10 5.05<br />
Mpumalanga 6 507 7 032 19 561 37 684 3.01 5.36<br />
North West 12 486 11 441 36 929 52 902 2.96 4.62<br />
Northern Cape 21 749 41 584 47 524 243 014 2.19 5.84<br />
Western Cape 304 488 16 173 718 101 58 680 2.36 3.63<br />
National Total 588 040 108 265 1 356 259 540 465 2.31 4.99<br />
Source: Census of commercial agriculture, Statistics South Africa, 2007; KPMG Analysis<br />
Oil seeds<br />
Figure 73 (below) illustrates the production volume of oil seeds (sunflower seeds, ground nuts, soya<br />
beans and other oil seeds) per province. Oil seeds production on dry land is highest in the Free State,<br />
North West and Mpumalanga with production on irrigated land highest in the North West. Sunflower<br />
seed production in Free State and North West and soya bean production in Mpumalanga contributed<br />
to the high production volumes on dry land.<br />
118
Table 23 is a numerical representation of Figure 73 and depicts the area planted, production volumes<br />
and volumes per hectare of oil seeds for each province. Interestingly, the Free State, despite its large<br />
production volume of oil seeds, only produces approximately 1.33 metric tons per hectare of dry land.<br />
The highest production volume per hectare of dry land is Kwa-Zulu Natal with 25 905 metric tons of<br />
oil seeds produced on 12 767 hectares of dry land.<br />
Figure 73: Oil seeds production volume per province<br />
250<br />
200<br />
Dry land<br />
Irrigated<br />
Metric tons ('000)<br />
150<br />
100<br />
50<br />
0<br />
Source: Census of commercial agriculture, Statistics South Africa, 2007<br />
Table 23: Area planted, production volume and production per hectare of oil seeds per province<br />
Oil seeds Planted hectares Production in metric tons Production per hectare<br />
Province Dry land Irrigated Dry land Irrigated Dry land Irrigated<br />
Eastern Cape 948 0 1 261 0 1.33 -<br />
Free State 144 425 2 740 191 757 4 516 1.33 1.65<br />
Gauteng 5 118 7 7 240 14 1.41 2.00<br />
Kwa-Zulu Natal 12 767 3 103 25 905 9 029 2.03 2.91<br />
Limpopo 38 683 5 943 41 958 13 518 1.08 2.27<br />
Mpumalanga 68 677 4 781 99 644 13 526 1.45 2.83<br />
North West 91 063 6 927 112 807 17 258 1.24 2.49<br />
Northern Cape 2 821 4 278 4 201 10 820 1.49 2.53<br />
Western Cape 18 577 548 21 148 708 1.14 1.29<br />
National Total 383 079 28 328 505 921 69 389 1.32 2.45<br />
Source: Census of commercial agriculture, Statistics South Africa, 2007; KPMG Analysis<br />
Legumes<br />
Figure 74 (below) illustrates the production volume of legumes (dry beans and other legumes) per<br />
province. Legume production on dry land is highest in the Free State, Mpumalanga and North West<br />
with production on irrigated land highest in Mpumalanga. Dry bean production in Free State and<br />
North West and Mpumalanga contributed to the high production volumes on dry land.<br />
119
Table 24 is a numerical representation of Figure 74 and depicts the area planted, production volumes<br />
and volumes per hectare of legumes for each province. Interestingly, the North West and<br />
Mpumalanga, despite its large production volume of legumes, only produces approximately 1.09 and<br />
1.21 metric tons per hectare of dry land respectively. This is in contrast with the Free State, a large<br />
producer of legumes, which produces approximately 1.65 metric tons per hectare of dry land.<br />
Figure 74: Legumes production volume per province<br />
25<br />
20<br />
Dry land<br />
Irrigated<br />
Metric tons ('000)<br />
15<br />
10<br />
5<br />
0<br />
Source: Census of commercial agriculture, Statistics South Africa, 2007<br />
Table 24: Area planted, production volume and production per hectare of legumes per province<br />
Legumes Planted hectares Production in metric tons Production per hectare<br />
Province Dry land Irrigated Dry land Irrigated Dry land Irrigated<br />
Eastern Cape 16 56 29 275 1.81 4.91<br />
Free State 12 297 1 322 20 221 2 116 1.64 1.60<br />
Gauteng 1 877 0 2 208 0 1.18 -<br />
Kwa-Zulu Natal 735 568 922 1 410 1.25 2.48<br />
Limpopo 89 612 106 1 351 1.19 2.21<br />
Mpumalanga 9 600 1 451 11 621 3 369 1.21 2.32<br />
North West 5 213 709 5 704 1 134 1.09 1.60<br />
Northern Cape 185 106 306 279 1.65 2.63<br />
Western Cape 1 727 114 1 236 307 0.72 2.69<br />
National Total 31 739 4 938 42 353 10 241 1.33 2.07<br />
Source: Census of commercial agriculture, Statistics South Africa, 2007; KPMG Analysis<br />
Fodder crops<br />
Figure 75 (below) illustrates the production volume of fodder crops (lucerne, maize for silage, teff and<br />
other fodder crops) per province. Fodder crop production on dry land is highest in the Free State,<br />
Western Cape and Kwa-Zulu Natal with production on irrigated land highest in the Northern Cape.<br />
120
Table 25 is a numerical representation of Figure 75 and depicts the area planted, production volumes<br />
and volumes per hectare of fodder crops for each province. Interestingly, the Western Cape, despite<br />
its large production volume of fodder crops, only produces approximately 3.37 metric tons per<br />
hectare of dry land compared to the Free State and Kwa-Zulu Natal which produce approximately 5<br />
and 5.37 metric tons per hectare of dry land respectively.<br />
Figure 75: Fodder crop production volume per province<br />
600<br />
500<br />
Dry land<br />
Irrigated<br />
Metric tons ('000)<br />
400<br />
300<br />
200<br />
100<br />
0<br />
Source: Census of commercial agriculture, Statistics South Africa, 2007<br />
Table 25: Area planted, production volume and production per hectare of fodder crops per province<br />
Fodder Crops Planted hectares Production in metric tons Production per hectare<br />
Province Dry land Irrigated Dry land Irrigated Dry land Irrigated<br />
Eastern Cape 44 149 17 040 129 051 156 805 2.92 9.20<br />
Free State 110 123 8 654 550 625 67 946 5.00 7.85<br />
Gauteng 11 472 1 775 40 569 21 845 3.54 12.31<br />
Kwa-Zulu Natal 31 921 7 936 171 314 70 420 5.37 8.87<br />
Limpopo 8 297 1 246 9 871 19 743 1.19 15.85<br />
Mpumalanga 34 589 1 711 129 534 10 777 3.74 6.30<br />
North West 49 922 10 924 145 883 77 610 2.92 7.10<br />
Northern Cape 16 264 14 505 56 881 171 200 3.50 11.80<br />
Western Cape 85 843 19 327 289 268 162 607 3.37 8.41<br />
National Total 392 580 83 118 1 522 996 758 953 3.88 9.13<br />
Source: Census of commercial agriculture, Statistics South Africa, 2007; KPMG Analysis<br />
Other field crops<br />
Figure 76 (below) illustrates the production volume of other field crops (sugar cane, cotton, tobacco,<br />
seeds and other field crops) per province. Other field crops production on dry land is highest in Kwa-<br />
Zulu Natal and Mpumalanga with production on irrigated land highest in Kwa-Zulu Natal. Sugar cane<br />
121
production accounts for Kwa-Zulu Natal’s significantly large contribution to field crops produced on<br />
dry land.<br />
Table 26 is a numerical representation of Figure 76 and depicts the area planted, production volumes<br />
and volumes per hectare of other field crops for each province. Kwa-Zulu Natal despite its large<br />
production volume of fodder crops only produces approximately 3.37 metric tons per hectare of dry<br />
land compared to the Free State and Kwa-Zulu Natal which produce approximately 5 and 5.37 metric<br />
tons per hectare of dry land respectively.<br />
Figure 76: Other field crops production volume per province<br />
14 000<br />
12 000<br />
Dry land<br />
Irrigated<br />
Metric tons ('000)<br />
10 000<br />
8 000<br />
6 000<br />
4 000<br />
2 000<br />
0<br />
Source: Census of commercial agriculture, Statistics South Africa, 2007<br />
Table 26: Area planted, production volume and production per hectare of other field crops per<br />
province<br />
Other field crops Planted hectares Production in metric tons Production per hectare<br />
Province Dry land Irrigated Dry land Irrigated Dry land Irrigated<br />
Eastern Cape 462 1 250 1 065 1 523 2.31 1.22<br />
Free State 74 242 96 1 496 1.30 6.18<br />
Gauteng 98 0 183 0 1.87 -<br />
Kwa-Zulu Natal 211 107 36 518 11 736 660 2 454 954 55.60 67.23<br />
Limpopo 6 941 5 680 12 527 21 477 1.80 3.78<br />
Mpumalanga 6 119 30 699 185 337 2 302 627 30.29 75.01<br />
North West 1 492 923 2 246 2 779 1.51 3.01<br />
Northern Cape 2 722 1 876 5 506 10 735 2.02 5.72<br />
Western Cape 4 077 410 3 365 2 105 0.83 5.13<br />
National Total 233 092 77 598 11 946 985 15 619 51.25 61.83<br />
Source: Census of commercial agriculture, Statistics South Africa, 2007; KPMG Analysis<br />
122
4.4.2 Horticultural products<br />
Figure 77 (below) illustrates the gross farming income for field crops by province. The Western Cape<br />
is the largest contributor to gross farming income with approximately R8 285 million generated<br />
primarily through citrus fruit, deciduous fruit and viticulture. Limpop and Mpumalanga are the second<br />
and third largest contributors to gross farming income of horticultural products with approximately R3<br />
040 million and R1 956 million generated respectively in 2007. Limpopo’s vegetable production and<br />
Mpumalanga’s citrus fruit production are the largest contributors to their income generated from<br />
horticultural products.<br />
Figure 77: Gross farming income for horticultural products by province<br />
Rands million<br />
9 000<br />
8 000<br />
7 000<br />
6 000<br />
5 000<br />
4 000<br />
3 000<br />
2 000<br />
1 000<br />
0<br />
Source: Census of commercial agriculture, Statistics South Africa, 2007<br />
Vegetables<br />
Figure 78 (below) illustrates the production volume of vegetables (potatoes, sweet potatoes, green<br />
mielies, sweet corn, beetroot, tomatoes, onions, pumpkins, carrots, cabbage, mushrooms, green<br />
beans and other vegetables) per province. Vegetable production is highest in the Western Cape and<br />
due primarily to the large production of potatoes.<br />
Table 27 is a numerical representation of Figure 78 and depicts the area planted, production volumes<br />
and volumes per hectare of other field crops for each province. Western Cape, despite its large<br />
production volume of vegetables, only produces 29.84 metric tons per hectare compared to Limpopo<br />
which produces approximately 31.61 metric tons per hectare.<br />
123
Figure 78: Vegetable production volume per province<br />
1 000<br />
900<br />
800<br />
Metric tons ('000)<br />
700<br />
600<br />
500<br />
400<br />
300<br />
200<br />
100<br />
0<br />
Source: Census of commercial agriculture, Statistics South Africa, 2007<br />
Table 27: Area planted, production volume and production per hectare of vegetables per province<br />
Vegetable Production<br />
Province Planted hectares Production in metric tons Production per hectare<br />
Eastern Cape 8 365 217 461 26.00<br />
Free State 21 018 566 108 26.93<br />
Gauteng 5 375 154 538 28.75<br />
Kwa-Zulu Natal 8 484 236 504 27.88<br />
Limpopo 22 621 715 072 31.61<br />
Mpumalanga 8 169 209 824 25.69<br />
North West 8 428 210 084 24.93<br />
Northern Cape 4 193 137 607 32.82<br />
Western Cape 31 623 943 763 29.84<br />
National Total 118 276 3 390 961 28.67<br />
Source: Census of commercial agriculture, Statistics South Africa, 2007; KPMG Analysis<br />
Citrus fruit<br />
Figure 79 (below) illustrates the production volume of citrus fruits (oranges, lemons, naartjies and<br />
other citrus fruits) per province. Citrus fruit production is highest in Limpopo due primarily to the large<br />
production of oranges.<br />
Table 28 is a numerical representation of Figure 79 and depicts the area planted, production volumes<br />
and volumes per hectare of citrus fruits for each province. Given Limpopo’s significant citrus fruit<br />
production volumes, the province produces approximately 32.11 metric tons of product per hectare<br />
of planted land.<br />
124
Figure 79: Citrus fruit production volume per province<br />
700<br />
600<br />
Metric tons ('000)<br />
500<br />
400<br />
300<br />
200<br />
100<br />
0<br />
Source: Census of commercial agriculture, Statistics South Africa, 2007<br />
Table 28: Area planted, production volume and production per hectare of citrus fruit per province<br />
Citrus fruit production<br />
Province Planted hectares Production in metric tons Production per hectare<br />
Eastern Cape 15 006 450 951 30.05<br />
Free State 29 524 18.07<br />
Gauteng 0 0 -<br />
Kwa-Zulu Natal 3 258 93 628 28.74<br />
Limpopo 19 644 630 837 32.11<br />
Mpumalanga 13 635 429 730 31.52<br />
North West 3 194 41 548 13.01<br />
Northern Cape 842 22 200 26.37<br />
Western Cape 10 820 292 190 27.00<br />
National Total 66 428 1 961 608 29.53<br />
Source: Census of commercial agriculture, Statistics South Africa, 2007; KPMG Analysis<br />
Subtropical fruit<br />
Figure 80 (below) illustrates the production volume of subtropical fruits (pineapple, bananas and other<br />
subtropical fruits) per province. Subtropical fruit production is highest in Mpumalanga due primarily to<br />
the large production of bananas in the region.<br />
Table 29 is a numerical representation of Figure 80 and depicts the area planted, production volumes<br />
and volumes per hectare of subtropical fruits for each province. Despite Mpumalanga’s significant<br />
subtropical fruit production volumes, the province only produces approximately 18.96 metric tons per<br />
hectare of planted land compared to Kwa-Zulu Natal’s metric ton production per hectare of 25.78.<br />
125
Figure 80: Subtropical fruit production volume per province<br />
250<br />
200<br />
Metric tons ('000)<br />
150<br />
100<br />
50<br />
0<br />
Source: Census of commercial agriculture, Statistics South Africa, 2007<br />
Table 29: Area planted, production volume and production per hectare of subtropical fruit per province<br />
Subtropical fruit production<br />
Province Planted hectares Production in metric tons Production per hectare<br />
Eastern Cape 6 136 75 481 12.30<br />
Free State 0 0 -<br />
Gauteng 17 157 9.24<br />
Kwa-Zulu Natal 4 912 126 645 25.78<br />
Limpopo 12 729 136 746 10.74<br />
Mpumalanga 10 253 194 405 18.96<br />
North West 89 294 3.30<br />
Northern Cape 24 350 14.58<br />
Western Cape 440 7 778 17.68<br />
National Total 34 600 541 856 15.66<br />
Source: Census of commercial agriculture, Statistics South Africa, 2007; KPMG Analysis<br />
Deciduous fruit and viticulture<br />
Figure 81 (below) illustrates the production volume of deciduous fruit and viticulture (apples, pears,<br />
peaches, table grapes, wine grapes, watermelons, and other deciduous fruit) per province. Deciduous<br />
fruit and viticulture production is highest in the Western Cape due primarily to the large production of<br />
pears and grapes in the region.<br />
Table 30 is a numerical representation of Figure 81 and depicts the area planted, production volumes<br />
and volumes per hectare of deciduous fruit and viticulture for each province. Despite the Western<br />
Cape’s significant deciduous fruit and viticulture production volumes, the province only produces<br />
approximately 15.12 metric tons per hectare of planted land compared to the Eastern Cape’s metric<br />
ton production per hectare of 24.86.<br />
126
Figure 81: Deciduous fruit and viticulture production volume per province<br />
3 000<br />
2 500<br />
Metric tons ('000)<br />
2 000<br />
1 500<br />
1 000<br />
500<br />
0<br />
Source: Census of commercial agriculture, Statistics South Africa, 2007<br />
Table 30: Area planted, production volume and production per hectare of deciduous fruit and<br />
viticulture per province<br />
Deciduous fruit and viticulture production<br />
Province Planted hectares Production in metric tons Production per hectare<br />
Eastern Cape 5 156 128 196 24.86<br />
Free State 1 190 17 741 14.91<br />
Gauteng 504 5 355 10.63<br />
Kwa-Zulu Natal 157 2 257 14.38<br />
Limpopo 3 029 46 767 15.44<br />
Mpumalanga 1 447 27 980 19.34<br />
North West 523 9 531 18.22<br />
Northern Cape 17 365 239 214 13.78<br />
Western Cape 162 464 2 456 373 15.12<br />
National Total 191 835 2 933 414 15.29<br />
Source: Census of commercial agriculture, Statistics South Africa, 2007; KPMG Analysis<br />
Nuts<br />
Figure 82 (below) illustrates the production volume of nuts (macadamia nuts, pecan nuts and other<br />
nuts) per province. Nuts production is highest in Mpumalanga due primarily to the large production of<br />
macadamia nuts in the region.<br />
Table 31 is a numerical representation of Figure 82 and depicts the area planted, production volumes<br />
and volumes per hectare of nuts for each province. Despite the Mpumalanga’s significant nut<br />
production volumes, the province only produces approximately 2.10 metric tons per hectare of<br />
planted land compared to the Western Cape’s metric ton production per hectare of 6.66.<br />
127
Figure 82: Nut production volume per province<br />
16<br />
14<br />
12<br />
Metric tons ('000)<br />
10<br />
8<br />
6<br />
4<br />
2<br />
0<br />
Source: Census of commercial agriculture, Statistics South Africa, 2007<br />
Table 31: Area planted, production volume and production per hectare of nuts per province<br />
Nut production<br />
Province Planted hectares Production in metric tons Production per hectare<br />
Eastern Cape 156 705 4.52<br />
Free State 338 389 1.15<br />
Gauteng 193 160 0.83<br />
Kwa-Zulu Natal 3 239 4 263 1.32<br />
Limpopo 5 084 10 803 2.12<br />
Mpumalanga 6 912 14 534 2.10<br />
North West 303 224 0.74<br />
Northern Cape 818 992 1.21<br />
Western Cape 218 1 452 6.66<br />
National Total 17 261 33 522 1.94<br />
Source: Census of commercial agriculture, Statistics South Africa, 2007; KPMG Analysis<br />
Flowers<br />
Figure 83 (below) illustrates the production volume of flowers (cultivated, wild and pot plants) per<br />
province. Flower production is highest in Gauteng due primarily to the large production of cultivated<br />
flowers in the region.<br />
Table 32 is a numerical representation of Figure 83 and depicts the area planted, production volumes<br />
and volumes per hectare of flowers for each province. Despite Gauteng’s significant flower<br />
production volumes, the province produces approximately 102 778 metric tons per hectare of planted<br />
land compared to Kwa-Zulu Natal’s metric ton production per hectare of 137 306.<br />
128
Figure 83: Flower production volume per province<br />
60 000<br />
50 000<br />
Metric tons ('000)<br />
40 000<br />
30 000<br />
20 000<br />
10 000<br />
0<br />
Source: Census of commercial agriculture, Statistics South Africa, 2007<br />
Table 32: Area planted, production volume and production per hectare of flowers per province<br />
Flower production<br />
Province Planted hectares Production in metric tons Production per hectare<br />
Eastern Cape 116 2 120 668 18 282<br />
Free State 291 1 263 993 4 344<br />
Gauteng 504 51 800 136 102 778<br />
Kwa-Zulu Natal 170 23 341 944 137 306<br />
Limpopo 2 417 2 625 456 1 086<br />
Mpumalanga 161 7 307 564 45 389<br />
North West 256 3 884 471 15 174<br />
Northern Cape 51 200 035 3 922<br />
Western Cape 31 414 44 968 357 1 431<br />
National Total 35 380 137 512 624 3 887<br />
Source: Census of commercial agriculture, Statistics South Africa, 2007; KPMG Analysis<br />
Other horticultural products<br />
Figure 84 (below) illustrates the production volume of other horticultural products (rooibos, herbs,<br />
seeds, seedlings and other products) per province. Rooibos and herb production is highest in the<br />
Western Cape whilst seeds and seedlings are primarily produced in the Eastern Cape. Table 33 is a<br />
numerical representation of Figure 84 and depicts the area planted, production volumes and volumes<br />
per hectare of other horticultural products for each province.<br />
129
Figure 84: Other horticultural item production volume per province<br />
2 500<br />
2 000<br />
Metric tons ('000)<br />
1 500<br />
1 000<br />
500<br />
0<br />
Source: Census of commercial agriculture, Statistics South Africa, 2007<br />
Table 33: Area planted, production volume and production per hectare of other horticultural products<br />
per province<br />
Other horticultural products<br />
Province Planted hectares Production in metric tons Production per hectare<br />
Eastern Cape 939 65 506 69.76<br />
Free State 155 561 3.62<br />
Gauteng 1 211 14 627 12.08<br />
Kwa-Zulu Natal 671 14 403 21.46<br />
Limpopo 490 10 542 21.51<br />
Mpumalanga 392 300 267 765.99<br />
North West 1 365 76 150 55.79<br />
Northern Cape 8 839 43 249 4.89<br />
Western Cape 40 363 2 084 625 51.65<br />
National Total 54 425 609 932 47.95<br />
Source: Census of commercial agriculture, Statistics South Africa, 2007; KPMG Analysis<br />
4.4.3 Animals and animal products<br />
Figure 85 (below) illustrates the gross farming income for animal and animal products by province.<br />
The North West is the largest contributor to gross farming income, with respect to animal production,<br />
with approximately R5 567 million generated whilst the Western Cape is the largest contributor to<br />
gross farming income, with respect to animal product generation, with approximately R2 245 million<br />
generated. Free State and Eastern Cape are the second largest contributors to gross farming income,<br />
of animals and animal products respectively, with approximately R4 840 million and R1 907 million<br />
generated respectively in 2007.<br />
130
Figure 85: Gross farming income for animal and animal products by province<br />
6 000<br />
5 000<br />
Animals<br />
Animal products<br />
Rands million<br />
4 000<br />
3 000<br />
2 000<br />
1 000<br />
0<br />
Source: Census of commercial agriculture, Statistics South Africa, 2007<br />
Poultry and ostrich<br />
Figure 86 (below) indicates the number of poultry and ostrich sold (broiler chickens, laying hens,<br />
ostriches, other poultry and other animals) per province. Mpumalanga had the highest number of<br />
poultry and ostrich sold, in 2007, and was closely followed by Gauteng and the Western Cape. Table<br />
34 is a numerical representation of Figure 86 and depicts the type and number of poultry and ostrich<br />
sold.<br />
Table 34: Number of poultry and ostriches sold<br />
Poultry and ostrich sold<br />
Province<br />
Chickens:<br />
Broilers<br />
Chickens:<br />
Laying hens<br />
Ostriches<br />
Other poultry<br />
Other<br />
animals<br />
Total poultry<br />
sold<br />
Eastern Cape 4 383 205 714 949 42 073 682 5 138 5 146 047<br />
Free State 12 376 383 5 215 336 2 949 29 3 352 17 598 049<br />
Gauteng 132 317 047 73 778 144 156 16 927 138 462 206 250 736<br />
Kwa-Zulu Natal 134 874 865 3 994 176 8 0 2 716 138 871 765<br />
Limpopo 63 781 249 4 497 347 17 170 3 970 68 282 753<br />
Mpumalanga 215 315 215 3 754 256 6 268 629 257 219 338 363<br />
North West 178 142 493 5 693 000 32 180 010 2 738 184 018 273<br />
Northern Cape 1 843 572 75 000 5 773 0 1 017 1 925 362<br />
Western Cape 180 231 950 5 342 828 396 646 65 98 5 739 637<br />
National Total 743 266 159 103 065 036 447 660 466 512 157 748<br />
Source: Census of commercial agriculture, Statistics South Africa, 2007; KPMG Analysis<br />
131
Figure 86: Number of poultry and ostrich sold per province<br />
250 000<br />
200 000<br />
Number sold ('000)<br />
150 000<br />
100 000<br />
50 000<br />
0<br />
Source: Census of commercial agriculture, Statistics South Africa, 2007<br />
Sheep and cattle<br />
Figure 87 (below) indicates the number of sheep and cattle sold (dairy cattle, beef cattle, sheep<br />
(wool) and sheep (non-wool)) per province. The Northern Cape had the highest number of sheep and<br />
cattle sold, in 2007, closely followed by Free State and the Western Cape. Table 35 is a numerical<br />
representation of Figure 87 and depicts the type and number of sheep and cattle sold.<br />
Table 35: Number of sheep and cattle sold<br />
Sheep and cattle sold<br />
Province Dairy cattle Beef cattle Sheep (wool)<br />
Sheep (nonwool)<br />
Provincial Total<br />
Eastern Cape 27 966 230 708 617 566 354 823 1 231 063<br />
Free State 28 341 938 925 607 807 513 997 2 089 070<br />
Gauteng 4 853 472 815 13 464 12 929 504 061<br />
Kwa-Zulu Natal 24 193 311 677 57 679 36 999 430 548<br />
Limpopo 3 322 254 061 1 753 48 815 307 951<br />
Mpumalanga 9 638 370 537 85 357 49 550 515 082<br />
North West 17 302 685 261 27 839 103 353 833 755<br />
Northern Cape 4 464 229 692 442 656 2 052 334 2 729 146<br />
Western Cape 32 484 129 461 609 903 489 501 1 261 349<br />
National Total 152 563 3 623 137 2 464 024 3 662 301<br />
Source: Census of commercial agriculture, Statistics South Africa, 2007; KPMG Analysis<br />
132
Figure 87: Number of sheep and cattle sold per province<br />
3 000<br />
2 500<br />
Number sold ('000)<br />
2 000<br />
1 500<br />
1 000<br />
500<br />
0<br />
Source: Census of commercial agriculture, Statistics South Africa, 2007<br />
Aquaculture<br />
Figure 88 (below) indicates the number of aquaculture sold (trout, abalone, fresh water fish and other<br />
aquaculture) per province. The Western Cape had the highest number of aquaculture sold, in 2007,<br />
closely followed by Mpumalanga and the Eastern Cape. Table 36 is a numerical representation of<br />
Figure 88 and depicts the type and number of aquaculture sold.<br />
Table 36: Number of aquaculture sold<br />
Aquaculture sold<br />
Province Trout (kg) Abalone (kg)<br />
Fresh water fish<br />
(kg)<br />
Other<br />
aquaculture (kg)<br />
Provincial Total<br />
Eastern Cape 0 67 063 400 20 914 88 377<br />
Free State 0 0 0 500 500<br />
Gauteng 0 0 0 0 0<br />
Kwa-Zulu Natal 20 992 0 0 0 20 992<br />
Limpopo 0 0 0 0 0<br />
Mpumalanga 15 322 0 25 631 49 306 90 259<br />
North West 0 0 0 0 0<br />
Northern Cape 0 0 957 0 957<br />
Western Cape 74 960 124 767 0 872 200 599<br />
National Total 111 274 191 830 26 988 71 592<br />
Source: Census of commercial agriculture, Statistics South Africa, 2007; KPMG Analysis<br />
133
Figure 88: Number of aquaculture sold per province<br />
250<br />
200<br />
Metric tonnes<br />
150<br />
100<br />
50<br />
0<br />
Source: Census of commercial agriculture, Statistics South Africa, 2007<br />
Other<br />
Figure 88 (below) indicates the other products sold (beehives, honey and other) per province.<br />
Gauteng is a leader in terms of honey sold with 2007 statistics indicating that approximately 736 360<br />
kilograms were sold in that year. The next biggest contributor in this area is the Western Cape with<br />
192 208 kilograms sold in 2007.<br />
Table 37: Number of aquaculture sold<br />
Other products sold<br />
Province Beehives (number) Honey (kg) Other (kg)<br />
Eastern Cape 7 27 288 194 401<br />
Free State 3 047 1 020 3 980 609<br />
Gauteng 0 736 360 1 304 948<br />
Kwa-Zulu Natal 0 19 755 7 525 998<br />
Limpopo 0 8 356 605 301<br />
Mpumalanga 0 1 000 35 312<br />
North West 8 548 16 010 287 725<br />
Northern Cape 9 051 25 287 171 940<br />
Western Cape 1 668 192 208 1 156 888<br />
National Total 22 321 1 027 284 2 257 166<br />
Source: Census of commercial agriculture, Statistics South Africa, 2007; KPMG Analysis<br />
134
5 Agricultural sector value chains<br />
The section that follows outlines the agricultural sector value chains for each of the industry’s subsectors.<br />
Legend: - Possible areas for intervention<br />
5.1 Field crops<br />
5.1.1 Cereal value chain<br />
Farm: seed,<br />
fertilizer,<br />
workers,<br />
management<br />
Grain: grown<br />
& harvested<br />
Processing<br />
plant<br />
Packaging Distributor CONSUMERS<br />
Legend: - Possible areas for intervention<br />
135
5.2 Horticultural products<br />
5.2.1 Citrus fruit value chain<br />
• Fruit tree<br />
cultivation<br />
•Planting, irrigating,<br />
weeding & pruning<br />
• Harvesting and<br />
collecting<br />
•Plucking, cutting,<br />
storage &<br />
transportation<br />
PRE-<br />
PROCESSING<br />
PROCESSING<br />
•Mechanical<br />
processing<br />
•Grading, washing<br />
& peeling.<br />
•Extraction<br />
•Pressing &<br />
preservation<br />
•Packaging<br />
•Filling/bottling<br />
•Marketing<br />
distribution<br />
•Promotion,<br />
advertising & sales.<br />
POST<br />
PROCESSING<br />
Legend: - Possible areas for intervention<br />
136
5.3 Animals and animal products<br />
5.3.1 Livestock value chain<br />
5.3.2 Red meat value chain<br />
Legend: - Possible areas for intervention<br />
137
5.3.3 Dairy farming value chain<br />
5.3.4 Beef market value chain<br />
5.4 Backward and forward economic linkages in the South<br />
African agricultural sector<br />
138
Forward and backward linkages occur between consecutive steps of a production value chain. A<br />
forward linkage exists where the products of a particular firm or industry is used as an input or raw<br />
material by another firm or industry. Conversely, a backward linkage occurs where a particular firm or<br />
industry uses the product of another firm or industry as raw materials or inputs.<br />
The figure below is a graphical representation of the linkages in a value chain.<br />
Source: Trade and Industrial Policy Standards (TIPS), EIA slides.<br />
The benefits of having an increased number of such backward linkages within an economy are that it<br />
creates local demand for raw materials and reduces dependence on imports as local suppliers can be<br />
relied upon for the supply of raw materials.<br />
Through understanding the backward and forward linkages in the agricultural sectors in South Africa,<br />
it is possible to obtain a better understanding of how investment and expenditure in this sector might<br />
influence other related sectors. Therefore, by providing an overview of the agricultural production and<br />
demand in South Africa, the inputs into the sector, the output of the sector as well as the<br />
employment structure of the sector. This analysis is based on the 2008 Social Accounting Matrix<br />
(SAM) for South Africa.<br />
Other than the agricultural, fishing and forestry sector itself, agriculture constitutes an input into<br />
several sectors. These sectors include the food, beverages and tobacco, wood and wood products,<br />
paper and paper products and building and construction sectors.<br />
The pie chart below represents, as a percentage, the inputs into the agricultural sector as per the<br />
2008 SAM.<br />
Please note “other” includes all inputs that represent inputs of less than 1% of the total inputs.<br />
Basic chemicals, food and coke & refined petroleum represent the largest share of inputs into the<br />
agricultural sector at 21.89%, 17.37% and 11.71% respectively. The agricultural sector itself provides<br />
7.56%of the inputs to the agricultural, fishing and forestry sector.<br />
139
Agriculture, forestry & fishing<br />
Other mining<br />
Food<br />
9.68%<br />
3.67%<br />
6.47%<br />
7.56%<br />
2.42%<br />
Textiles<br />
Coke & refined petroleum<br />
products<br />
Basic chemicals<br />
2.34%<br />
0.67%<br />
0.69%<br />
1.21%<br />
3.60%<br />
5.06%<br />
1.16%<br />
3.18%<br />
17.37%<br />
1.32%<br />
11.71%<br />
Other chemicals & manmade<br />
fibres<br />
Metal products excluding<br />
machinery<br />
Machinery & equipment<br />
Motor vehicles, parts &<br />
accessories<br />
Electricity, gas & steam<br />
Water supply<br />
Building construction<br />
21.89%<br />
Wholesale & retail trade<br />
Transport & storage<br />
Medical, dental & other<br />
health & veterinary services<br />
Other<br />
Source: KPMG calculation, 2008 SAM<br />
The size of the additional economic activity generated, is measured by means of the multiplier effect.<br />
The different rounds of the multiplier effect, from the initial spending in a sector, through to the<br />
worker spending his/her salary on buying goods and services (and its resultant effects), is then<br />
estimated as the direct, indirect and induced impacts of the project.<br />
According to Keynesian economic theory any injection into the economy via investment capital,<br />
government spending or the like will result in a proportional increase in overall income (measured<br />
through GDP) at a national level.<br />
The table below is a summary of the multiplier effects associated with the agricultural, fishing and<br />
forestry sector in South Africa according to the 2008 SAM.<br />
Indicator (economy wide impact)<br />
Multiplier<br />
GDP 1.5061<br />
Employment (man years) Total 12.4055<br />
Informal 2.1601<br />
Highly-skilled 0.6509<br />
140
Skilled 0.2801<br />
Non-skilled 6.3144<br />
Taxes Indirect 0.1791<br />
Source: 2008 National SAM<br />
Company 0.1586<br />
Personal 0.1081<br />
• The GDP multiplier effect implies that for every R1 extra spent or invested in the agricultural<br />
sector, GDP will increase by R0.51c.<br />
• The indirect tax multiplier effect implies that for every R1 extra spent or invested in the<br />
agricultural sector, indirect tax income will increase by R0.18c.<br />
• Agriculture is one of the sectors that employ the largest number of people in the South African<br />
economy. Within the SAM, the effect on employment is measured in man-years. A man-year is<br />
the amount of work done by an individual throughout the year. It takes into account the amount<br />
of hours worked by the individual during the week. The employment multiplier effect implies that<br />
for every R1m extra spent or invested in the agricultural sector, the total number of man-years<br />
created increases by an estimated 12.41 years.<br />
141
6 PESTEL and SWOT analysis of the<br />
agricultural sector<br />
6.1 Agricultural sector PESTEL analysis<br />
Political<br />
•National focus on agrarian transformation, rural development,<br />
sustainable rural communities<br />
•IPAP2 policy focus on agro-processing, biofuels, forestry, paper<br />
and furniture<br />
•Backlogs in land restitution and lack of support to new land-owners<br />
•Focus on agriculture and rural development in the Provincial<br />
Growth nd <strong>Development</strong> Strategies<br />
•Nationally food-secure but 14% of South Africa's population is<br />
vulnerable to food insecurity<br />
Economic<br />
•Rising input costs particularly with seeds, animal feed, fertilisers<br />
and farming equipment<br />
•Increasing cost of electricity and inconsistent supply to remote<br />
rural areas<br />
•Seasonal nature of employment<br />
•Volatility in exchange rates<br />
•IPAP2 financial support to high-priority sectors<br />
•Lack of transport infrastructure in rural areas<br />
•Increased demand for food<br />
•Food inflation<br />
•Marginalisation of poor rural communities<br />
•Farming debt and lack of access to credit for small farmers<br />
Social<br />
•Migration out of rural areas reducing the agricultural workforce<br />
•Perception of agriculture as an unattractive sector<br />
•Consumption and buying paterns, e.g. the increased demand for<br />
organically grown foods<br />
•Levels of development in rural areas<br />
•Crime<br />
•HIV/AIDS<br />
•Availability of basic services such as health, education<br />
•Low levels of skill and skills development in the agricultural sector<br />
•Growing demand for holidays on game farms and lodges<br />
•Limited earning potential in rural areas<br />
Technological<br />
•Commercial farms opting for more high-tech equipment that is less<br />
labour intensive<br />
•Equipment hire is prohibitively high for small-scale farmers<br />
Environmental<br />
•Limited water supply in South Africa<br />
•Semi-arid conditions and effects of climate change increase<br />
vulnerability of agriculture<br />
•Historically unsustainable farming practices have casused<br />
environmental degradation<br />
•Interest in ecologically sustainable farming methods and use of<br />
alternative energy sources<br />
Legal<br />
•Stringent phyto-sanitary regulations imposed by the United States<br />
and European Union on imports of agricultural products<br />
142
6.2 Sub-sector SWOT analysis<br />
6.2.1 Field crops<br />
Figure 89: SWOT analysis of field crop sub-sector<br />
Strengths<br />
•Maize is the primary food source for 80%<br />
of the country’s population and will<br />
maintain strong growth in future demand<br />
•We are one of a few countries that<br />
produces white maize with significant<br />
potential for export<br />
•Significant maize yield improvements due<br />
to stable production on irrigated land<br />
•Demand for maize is linked to rising<br />
demand in livestock as yellow maize is the<br />
main commodity in feed stock<br />
•Tobacco industry receives considerable<br />
interest from international countries due to<br />
the tobacco leaves we produce<br />
Weaknesses<br />
•Steady decline in planted area of maize<br />
•Farmers are financially constrained<br />
between planting and harvesting<br />
•Rising input costs for farmers<br />
•Volatile maize prices<br />
•Farmers are not cost competitive when<br />
compared to other sugar producing<br />
countries<br />
•Preferential trade agreements and high<br />
export tariffs for sugar farmers<br />
•Declining cotton prices and the perception<br />
that the industry is not profitable<br />
•Increased smoking laws, high tax rates<br />
and high input costs continues to deter<br />
demand for tobacco<br />
Opportunities<br />
•Creation of biodiesels will improve<br />
demand for oil seeds<br />
•Biodiesels has the potential to lower<br />
farmer’s input costs by using it to meet<br />
their energy requirements<br />
•Sugarcane-based renewable energy could<br />
assist Eskom with cogeneration of power<br />
•Cotton farming can create numerous jobs<br />
due to the labour intensive nature of the<br />
product<br />
•South African cotton is one of the world’s<br />
finest, in terms of impurities, and gives<br />
the country a distinct advantage<br />
•Tobacco sector and government<br />
partnership to help improve crop<br />
production levels and assist emerging<br />
farmers to enter the commercial space<br />
Threats<br />
•Rising prices of yellow maize places added<br />
pressure on the animal feed sector<br />
•Maize exports need to be monitored to<br />
ensure that domestic demand is met<br />
•Reducing profit margins for farmers may<br />
result in a reduction in production to<br />
remain profitable<br />
•Competition from cheaper imports may<br />
hurt the domestic production market<br />
•Major sugar producing nations subsidise<br />
the production of sugar with the<br />
overproduction eroding the global price of<br />
sugar<br />
•Crop diseases can severely affect farmer’s<br />
production levels and profitability<br />
6.2.2 Horticultural products<br />
Figure 90: SWOT analysis of horticulture sub-sector<br />
143
Strengths<br />
•The climatic diversity of the country is<br />
suitable for the cultivation of a wide<br />
variety of fruits and vegetables<br />
•Citrus industry is export-orientated and SA<br />
is firmly established as one of the leading<br />
citrus producers in the world.<br />
Infrastructure and climate is suited to<br />
maintaining this position<br />
•Off-season production suites the<br />
European market and ensures demand for<br />
South African fruit<br />
Weaknesses<br />
•<strong>Small</strong>-scale fruit and vegetable farmers do<br />
not have sufficient access to credit,<br />
transport and storage infrastructure and<br />
markets - difficult to participate in<br />
commercial agriculture<br />
•<strong>Small</strong>-scale farmers lack access to<br />
advance farming technologies thus<br />
reducing their global competitiveness<br />
•The subtropical fruit industry is costintensive<br />
and requires high levels of<br />
investment required during non-bearing<br />
seasons<br />
Opportunities<br />
•Asia and the Middle East are forecast to<br />
become major market sfor South African<br />
table grapes<br />
•Niche markets for rooibos and honeybush<br />
tea as well as for essential oils set to<br />
increase especially as people get more<br />
health -conscious<br />
•Increasing demand for organic ally grown<br />
fruits and vegetables<br />
•Growing market for ornamental and cut<br />
flowers<br />
•Rising input costs<br />
Threats<br />
•Fruit and vegetable farmers are particularly<br />
prone to pests and diseases<br />
•The citrus industry does face serious<br />
international compeition and farmers will<br />
need to become increasingly costcompetitive<br />
144
6.2.3 Animals and animal products<br />
Figure 91: Swot analysis of livestock and animal product sub-sector<br />
Strengths<br />
•Livestock farming comprises 40% of<br />
the country’s agricultural output and<br />
is a major component of the sector<br />
•Approximately 80% of agricultural<br />
farm land can be used for the farming<br />
of livestock and as such farmers<br />
combine livestock and crop farming<br />
•Poultry is fast growing convenience<br />
food and has healthy future demand<br />
•MAFISA and Kula <strong>Enterprise</strong> Finance<br />
are currently assisting small-scale<br />
farmers with financing issues<br />
Weaknesses<br />
•Weak demand at present due to the<br />
effects of the global financial crisis<br />
•Net importer of red meat and with<br />
potential rise in demand<br />
•<strong>Small</strong>-scale farmers do not possess<br />
the relevant research and market<br />
information necessary to<br />
commercialise their products<br />
•Backlogs of financing through<br />
financing institutions<br />
•Financing options provided to smallscale<br />
farmers are not viable with high<br />
interest rates and repayments<br />
deterring growth<br />
Opportunities<br />
•Communal farming has the potential<br />
to assist local producers in satisfying<br />
domestic demand<br />
•Training of emerging and communal<br />
farmers to combat diseases<br />
•Access to viable and affordable<br />
financing options<br />
•Providing small-scale farmers with<br />
the technical skills and information to<br />
tap into the commercial markets<br />
Threats<br />
•Influx of cheap poultry will reduce<br />
production levels for local producers<br />
•Rising feed prices are likely to affect<br />
local producer costs<br />
•Avian flu could deter growth in the<br />
industry and would affect both poultry<br />
and ostriches<br />
•Foot and mouth disease is a major<br />
hindrance to small-scale farmers<br />
145
7 Feedback from potential client surveys<br />
The KPMG team conducted a survey of agriculture sector stakeholders in order to elicit information<br />
on where SEDA can intervene and what services and products it can develop to assist small and<br />
medium enterprises. A concise survey questionnaire was developed and submitted to the SEDA<br />
project management team for final approval. The questionnaire was designed so as to be conducted<br />
either over the phone or via email to elicit clear and concise responses while not requiring too much<br />
time.<br />
Eighty-seven institutions were indentified during the preparatory phase of the project through<br />
research and internal KPMG networks. The next step in the process was to identify respondents in<br />
these organisations. In some instances, more than one contact was identified per organisation.<br />
Potential respondents were first called by the KPMG survey team in December 2011. The team<br />
explained the project and the goal of the survey. If the respondents were able to, the survey was<br />
conducted over the phone. In certain instances, the respondents required the questionnaire to be<br />
mailed to them or to be contacted at a later stage. Follow-up calls were also made to outstanding<br />
respondents.<br />
At the end of the survey process, the team received 18 responses. Given the time of year and the<br />
voluntary nature of the survey, we believe this to be a positive response rate.<br />
7.1 Composition of respondents<br />
7.1.1 Composition based on type of respondent<br />
5.6%<br />
11.1%<br />
22.2%<br />
University/Training College<br />
Co-operative<br />
Financial Institution<br />
11.1%<br />
Industry association,<br />
unions or body's<br />
Farm Owner<br />
44.4%<br />
5.6%<br />
Industry communication<br />
The highest number of responses was received from industry associations, unions and/or body’s<br />
(44.4%) and University’s and/or training colleges (22.2%).<br />
7.1.2 Composition based on service offering<br />
The pie chart below is a graphical representation of the highest number of responses based on the<br />
service offering of the potential clients.<br />
146
11.1%<br />
5.6%<br />
16.7%<br />
Agri-business<br />
Education, Research or<br />
Training<br />
Supply (inputs/raw materials)<br />
5.6%<br />
Financial services<br />
16.7%<br />
22.2%<br />
Media<br />
Storage and handling<br />
Agricutural union<br />
Advocacy body<br />
Farming<br />
5.6%<br />
5.6%<br />
5.6%<br />
5.6%<br />
Trade association<br />
7.2 Are you aware of the role SEDA can play in the agricultural<br />
sector?<br />
70%<br />
60%<br />
57.9%<br />
50%<br />
40%<br />
42.1%<br />
30%<br />
20%<br />
10%<br />
0%<br />
No<br />
Yes<br />
Of the responses received from potential clients, only 38.9% are aware of the role that SEDA can<br />
play in the agricultural sector.<br />
Some respondents felt that SEDA could do more to employ agricultural specialists who would be<br />
able to understand the dynamics of agri-business better. They also felt that SEDA should help provide<br />
financial assistance to farmers.<br />
147
7.3 To the best of your knowledge, do you know of existing<br />
incentives that farmers utilise?<br />
60%<br />
50%<br />
50.0%<br />
44.4%<br />
40%<br />
30%<br />
20%<br />
10%<br />
5.6%<br />
0%<br />
NO YES Other<br />
Only 44.4% of the respondents are aware of existing incentives that farmers are able to utilise within<br />
the agricultural sector.<br />
These incentives include:<br />
■ The Department of Agriculture, Rural development and Land reform who help farmers with the<br />
leasing of state farms, the buying of farms and the re-capitalisation of farms;<br />
■ Chemical fertilizer incentives;<br />
■ Machinery incentives;<br />
■ Depreciation allowances to stimulate investments in agriculture;<br />
■ The Department of Trade and Industry grants for the establishment of co-operatives; and<br />
■ ABET training and tractor driving.<br />
148
7.4 What, in your opinion, are the current challenges faced by<br />
small enterprises in the agricultural sector?<br />
120%<br />
100%<br />
80%<br />
100.0%<br />
83.3%<br />
77.8%<br />
72.2%<br />
60%<br />
40%<br />
44.4%<br />
38.9% 38.9%<br />
20%<br />
0%<br />
Availability of skills<br />
Access to finance<br />
Availability of infrastructure<br />
Other<br />
The impact of changes in tenure<br />
legislation<br />
The impact of climate change<br />
The impact of crime<br />
The bar graph above is a graphical representation, in descending order, of the challenges faced by<br />
small enterprises. All the respondents believe that the main challenge faced by small enterprises in<br />
the agricultural sector is availability of skills, followed by access to finance and the availability of<br />
infrastructure.<br />
Of the challenges identified, 72.2% of the respondents felt that there were other challenges faced by<br />
small enterprises over and above those listed. These included:<br />
Please note that the items listed in italics are challenges that were mentioned by more than one<br />
potential client.<br />
■ Funding for training and development;<br />
■ Access to markets;<br />
■ Access to land (for grazing and planting);<br />
■ Economies of scale;<br />
■ The Government’s ability to implement policy;<br />
■ Exchange rate volatility;<br />
■ Lack of collateral for loans;<br />
■ High import costs;<br />
■ Red tape associated with various compliance programmes;<br />
149
■ Lack of support from government;<br />
■ HIV/AIDS pandemic;<br />
■ High cost of doing business;<br />
■ Poor extension services to distribute research and technology; and<br />
■ Non-tariff market barriers and little support for equity partners seeking to empower their<br />
employees to become owners of the land.<br />
7.5 In light of the challenges identified how do you think SEDA<br />
could become involved in dealing with these challenge?<br />
Below is a list of the various ways in which potential clients feel that SEDA can become involved in<br />
dealing with the challenges identified.<br />
Please note that the items listed in italics are challenges that were mentioned by more than one<br />
potential client.<br />
■ By providing business advice relating to current modern agribusiness;<br />
■ By providing advice on precision agriculture (at the bare minimum);<br />
■ By providing technical reports in the event of disaster (e.g. fire, floods, hale etc);<br />
■ By forming partnerships with agricultural institutions;<br />
■ By providing effective training, skills development and mentorship programmes;<br />
■ Through increased and improved communication with small scale farmers;<br />
■ Through improved communication of offerings;<br />
■ Increased “on the ground’ interaction between staff and farmers;<br />
■ Through the promotion of agriculture as a career option;<br />
■ By reducing the corruption within the tender process;<br />
■ Through the promotion of less strict labour laws;<br />
■ By providing assistance or facilitating access to credit;<br />
■ By assisting in business development; and<br />
■ Through the development of small to medium research and development laboratories.<br />
7.6 How could SEDA provide assistance in dealing with the<br />
challenges highlighted?<br />
The list below is a summary of the ways in which potential client feel SEDA could assist with the<br />
challenges identified:<br />
Please note that the items listed in italics are challenges that were mentioned by more than one<br />
potential client.<br />
■ By hiring agricultural economists who have an understanding of both agriculture and business;<br />
■ By forming partnerships with agricultural education institutions;<br />
■ Through the facilitation of communication between small s cale farmers and large scale<br />
farmers;<br />
■ By assisting with key risk management;<br />
■ By assisting with investment in new technology;<br />
150
■ By providing training to farmers on how to market their products;<br />
■ By helping provide the links to the relevant financial institutions;<br />
■ By acting as a link between the farmers and government departments;<br />
■ By assisting government to partner with the correct agricultural institutions;<br />
■ By assisting farmers to secure financing; and<br />
■ By potentially building training centres and assist with the rebuilding of existing infrastructure.<br />
7.7 In your opinion, what opportunities exist within the<br />
agricultural sector?<br />
Below is a list of the opportunities identified by potential clients within the agricultural sector:<br />
■ Job creation in rural areas through social upliftment;<br />
■ Commercial farmers could get involved in BEE projects;<br />
■ Capitalisation of the impending food scarcity;<br />
■ Investment opportunities that could create jobs and alleviate poverty;<br />
■ The opportunity to sell products before they are produced- opened by the free market system;<br />
■ Elevated price levels that could potentially lead to windfalls;<br />
■ The exportation of goods to foreign countries could bring in foreign exchange; and<br />
■ Within value-adding activities on small scale farming level.<br />
7.8 How do you think SEDA can take advantage of these<br />
opportunities?<br />
The summary below is a list of the potential ways in which the potential clients think SEDA can take<br />
advantage of the opportunities identified within agricultural sector:<br />
Please note that the items listed in italics are challenges that were mentioned by more than one<br />
potential client.<br />
■ By hiring agricultural economists as business advisors;<br />
■ By reviewing the list of services offered to farmers and agribusinesses;<br />
■ By partnering with institutions to expedite training;<br />
■ By providing like skills, schooling and educational incentives;<br />
■ By becoming more visible, local and on site;<br />
■ By assisting farmers with the administrative aspects;<br />
■ By being or providing the link for farmers to access financing;<br />
■ By developing tailor made skills training programmes in collaboration with institutions that have<br />
experience in dealing with emerging farmers;<br />
■ By using existing programmes to develop programmes or incentives;<br />
■ Through sharing what SEDA can and will be able to do in a better manner;<br />
■ By engaging with the CGA Transformation managers;<br />
■ By facilitating better cooperation all round; and<br />
■ By assisting with market linkage.<br />
151
8 Feedback from practitioner surveys<br />
8.1 Composition of respondents<br />
8.1.1 Composition by province<br />
8%<br />
8%<br />
8%<br />
8%<br />
7%<br />
38%<br />
Eastern Cape<br />
Free State<br />
Gauteng<br />
Limpopo<br />
Kwa-Zulu Natal<br />
Mpumalanga<br />
Northern Cape<br />
North West<br />
Western Cape<br />
23%<br />
8.1.2 Composition by key focus area<br />
7.7%<br />
15.4%<br />
SMME <strong>Development</strong><br />
30.8%<br />
7.7%<br />
<strong>Development</strong> of<br />
Cooperatives<br />
Manufacturing and<br />
services<br />
Business development<br />
7.7%<br />
Technical support<br />
7.7%<br />
23.1%<br />
Business advisory/branch<br />
management and other<br />
mangement functions<br />
Information<br />
dissemination<br />
152
8.2 What are the biggest day-to-day challenges faced by you as<br />
a SEDA practitioner?<br />
Below is a summary of the challenges faced by the SEDA practitioners:<br />
Please note that the items listed in italics are challenges that were mentioned by more than one<br />
practitioner.<br />
■ Ineffective and unsustainable collaborations between Government Departments, Agencies,<br />
Banks, the Private Sector and Academia;<br />
■ The lack of- and inaccessibility to markets;<br />
■ Cumbersome paperwork and time consuming administrative processes;<br />
■ Unsuitable and unattainable targets;<br />
■ CRM system inefficiencies and duplication of duties;<br />
■ Lack of skills across the board (management, technical and training skills etc.);<br />
■ Assisting existing clients with access to finance;<br />
■ Internal red tape;<br />
■ Not being able to get the right co-operatives; and<br />
■ Low literacy and levels of understanding due to lack of training.<br />
8.3 In what areas could SEDA assist the practitioner to improve<br />
the ability and efficiency?<br />
Below is a summary of the ways in which the practitioners think SEDA could assist them to become<br />
more efficient and improve their ability.<br />
■ By lobbying for policies that would force integration amongst all role-players;<br />
■ Through the revision of targets;<br />
■ By providing more sector specific research that can be made available to Provinces and branches<br />
on a regular basis;<br />
■ By improving and aligning the system;<br />
■ By improving the training both internally and externally;<br />
■ By helping to improve the visibility of stakeholders; and<br />
■ By providing the relevant business tools that respond positively to the needs of various business<br />
sectors.<br />
8.4 What are the biggest challenges faced the SEDA<br />
practitioner’s clients?<br />
The pie chart below is a graphical representation of the biggest challenges faced by the SEDA<br />
practitioner’s clients.<br />
153
46.2% Availability of infrastructure<br />
61.5%<br />
Access to finance<br />
7.7%<br />
Availability of skills<br />
The impact of climate chage<br />
The impact of crime<br />
69.2%<br />
84.6%<br />
the impact of the change in<br />
legislation<br />
Other<br />
Other challenges that were highlighted included:<br />
■ Access to markets;<br />
■ Availability of markets;<br />
■ Lack of collateral;<br />
■ Emerging farmer support;<br />
■ Marketing;<br />
■ Business management; and<br />
■ EIA’s.<br />
8.5 Where can SEDA become involved when trying to deal with<br />
the challenges identified?<br />
The list below is a summary of where the practitioners feel SEDA can become more involved in<br />
trying to deal with the challenges identified:<br />
■ By facilitating training for SEDA practitioners;<br />
■ By improving access to finance and markets;<br />
■ By providing mentorship and business advisory;<br />
■ By Lobbying of local municipalities and government;<br />
■ By involving the established practitioners to impart skills;<br />
■ Involve academia in training programmes;<br />
■ By having a memorandum of understanding between the Department of Land Affairs, the<br />
Department of Agriculture and other relevant stakeholders;<br />
■ By ensuring that the MOU’s are operational to assist clients;<br />
■ By working to improve stakeholder relations; and<br />
■ By providing training programs to SEDA clients.<br />
154
9 Identification of potential<br />
opportunities and focus areas for<br />
interventions<br />
The section, which follows, outlines the potential opportunities and focus areas for SEDA to assist<br />
both small and medium scale farmers. The possible intervention areas are also classified in terms of<br />
achievability i.e. short, medium or long term interventions.<br />
Availability of supporting infrastructure<br />
Opportunities/Challenges<br />
<strong>Small</strong>-scale farmers in remote locations may not have access to markets to sell their products. This may be due<br />
to their distance from retail markets, inadequate logistical infrastructure linking these farms to commercial hubs<br />
or dilapidated road infrastructure inhibiting access to these farms.<br />
<strong>Small</strong>/Medium <strong>Enterprise</strong>s<br />
This applies to small scale farmers<br />
Areas for intervention<br />
Timeframe<br />
• SEDA could facilitate interactions with small-scale logistic businesses to assist these<br />
farmers in getting their produce to local markets.<br />
• SEDA could facilitate agreements with medium and large-scale commercial farmers<br />
to assist small farmers in the logistical distribution of their products.<br />
• Retail chain stores (such as SPAR) may be able to source their products locally and<br />
assist with the distribution and collection of these products. SEDA could intervene<br />
by facilitating agreements between these chain stores and local small-scale farmers.<br />
Short term<br />
Medium term<br />
Medium term<br />
Financial constraints<br />
Opportunities/Challenges<br />
Due to the capital outlay required between the planting and harvesting seasons, small and medium farmers<br />
generally require loans to financially sustain the farm during these periods however; financial institutions offer<br />
loans with high interest rates and lengthy repayment periods which many farmers are unable to afford and as<br />
such this affects their revenue and profitability.<br />
<strong>Small</strong>/Medium <strong>Enterprise</strong>s<br />
This applies to both small and medium scale farmers<br />
Areas for intervention<br />
Timeframe<br />
155
• SEDA could facilitate interactions between financial institutions and small and<br />
medium scale farmers to negotiate affordable loan agreements.<br />
• SEDA could facilitate workshops between financial institutions and small and<br />
medium scale farmers to develop their financial management skills and learn to<br />
better manage their financial cash flow<br />
Short term<br />
Short term<br />
Availability of arable land<br />
Opportunities/Challenges<br />
Only 12% of South Africa’s land is arable and suitable for crop farming and can be attributed to the declining<br />
levels of water availability. In most cases, irrigation is required in order to utilise the land however, this is a costly<br />
venture for small and medium scale farmers and is generally only viable for large-scale commercial farmers.<br />
<strong>Small</strong>/Medium <strong>Enterprise</strong>s<br />
This applies to both small and medium scale farmers<br />
Areas for intervention<br />
• Although some areas may not be used for crop farming, the land could be used to<br />
rear animals. This presents an area of opportunity for SEDA to facilitate training for<br />
these farmers to be able to diversify their products and enter the animal and animal<br />
products sector.<br />
• SEDA could facilitate interactions between commercial farmers and small and<br />
medium scale farmers to collaborate and irrigate unused land for the mutual benefit<br />
of both parties.<br />
Timeframe<br />
Short term<br />
Short term<br />
Availability of water<br />
Opportunities/Challenges<br />
South Africa is classified as a water-stressed country and this is underlined by the low percentage of arable land<br />
available for crop farming. The availability of water is essential for farming and the inadequate supply of water<br />
due to ageing infrastructure could be detrimental to crop yields.<br />
<strong>Small</strong>/Medium <strong>Enterprise</strong>s<br />
This applies to both small and medium scale farmers<br />
Areas for intervention<br />
• SEDA could facilitate interactions between businesses specialising in water storage<br />
facilities and small and medium scale farmers. This would allow farmers to sustain<br />
their water requirements in the event that there is an inadequate supply to their<br />
farms.<br />
Timeframe<br />
Short term<br />
156
Electricity cost and supply<br />
Opportunities/Challenges<br />
Eskom are in the process of implementing 2 new power stations and exploring renewable energy alternatives in<br />
order to meet the rising demand for electricity over the next few years. Financing these projects has seen<br />
Eskom move towards cost reflective tariff pricing, resulting in the price of electricity rising by 25% per annum<br />
between 2010 and 2012. The increased demand for electricity could put significant strain on electrical supply to<br />
small and medium scale farmers who do not have preferential agreements with Eskom.<br />
<strong>Small</strong>/Medium <strong>Enterprise</strong>s<br />
This applies to both small and medium scale farmers<br />
Areas for intervention<br />
Timeframe<br />
• SEDA could assist small and medium scale farmers in researching methods for<br />
generating alternative energy through their agricultural products i.e. creating<br />
biodiesel from oil seed or sugar cane production for both personal and commercial<br />
use.<br />
• Eskom’s future capacity plans incorporate the shift towards renewable energy with<br />
the by-products of sugar cane production being touted as a possible means of<br />
generating electricity. SEDA could play a role in facilitating negotiations between<br />
Eskom and small to medium scale farmers in the sugar cane sub-sector to generate<br />
electricity for both personal and commercial use.<br />
• As the demand for electricity rises, Eskom may not be able to sustain a steady flow<br />
of supply and as such farmers may need to consider other sources of electricity<br />
such as back-up generators, renewable energy etc. An area of opportunity exists for<br />
SEDA to partner with the Department of Trade and Industry (Dti) and facilitate<br />
interactions between small and medium scale farmers and companies involved in<br />
providing alternative energy sources such as solar panels and wind turbines. SEDA<br />
could assist these farmers in negotiating purchase agreements and affordable<br />
payment plans to meet the requirements of small to medium farmers.<br />
Short term<br />
Long term<br />
Long term<br />
Export opportunities<br />
Opportunities/Challenges<br />
South Africa is currently a net exporter of yellow maize and the growing demand for maize presents significant<br />
opportunities for small to medium farmers to contribute to the export of yellow maize. Export demand forecasts<br />
also indicate a potential rise in demand for white maize, honey bush, rooibos tea, tobacco, table grapes, nuts and<br />
citrus fruit. Despite the evident opportunities for small and medium scale farmers, these export markets are<br />
limited to large-scale commercial farmers due to preferential trade agreements and additional costs associated<br />
with duties, levies and compliance with international health and safety standards.<br />
<strong>Small</strong>/Medium <strong>Enterprise</strong>s<br />
This applies to both small and medium scale farmers<br />
Areas for intervention<br />
Timeframe<br />
157
• SEDA could aid in facilitating partnership agreements with large-scale commercial<br />
farmers or academic institutions to assist small and medium farmers in<br />
understanding the requirements of complying with international standards.<br />
• SEDA could assist small and medium scale farmers to attend trade fairs and<br />
agricultural expo’s to market their produce to both local and international markets.<br />
• <strong>Small</strong> and medium scale farmers are not equipped to handle the additional costs<br />
required to enter the export market. As a result, SEDA could collaborate with<br />
financial institutions to assist these farmers in procuring affordable loan agreements<br />
to manage these additional costs. Furthermore, these institutions could further<br />
assist farmers in better managing their cash flow, which in turn could provide<br />
additional revenue for farmers to offset the additional costs required.<br />
Short term<br />
Short term<br />
Medium term<br />
Consumer shift towards organic products<br />
Opportunities/Challenges<br />
Over the past few years, there has been a growing market for health conscious consumers resulting in a shift<br />
towards organically grown and reared agricultural produce. This represents an area of significant opportunity for<br />
farmers however; this market segment is limited to large-scale commercial farmers due to the capital intensive<br />
nature of organic farming.<br />
<strong>Small</strong>/Medium <strong>Enterprise</strong>s<br />
This applies to small scale farmers<br />
Areas for intervention<br />
• SEDA could facilitate partnerships between academic institutions and small-scale<br />
farmers to share knowledge on organic farming methods and the relevant costs and<br />
benefits associated with entering this market segment.<br />
• <strong>Small</strong>-scale farmers may not be equipped to handle the additional costs required to<br />
enter the organic farming market. As a result, SEDA could collaborate with financial<br />
institutions to assist these farmers in procuring affordable loan agreements to<br />
manage the additional costs. Furthermore, these institutions could further assist<br />
these farmers in better managing their cash flow, which in turn could provide<br />
additional revenue to enter the organic farming market.<br />
Timeframe<br />
Short term<br />
Medium term<br />
Knowledge and information sharing<br />
Opportunities/Challenges<br />
Crop and animal diseases are one of the major obstacles for small farmers due to the adverse impact it has on<br />
their revenue and ultimately profit margins. Sharing industry knowledge on the prevention of diseases is thus a<br />
major area of opportunity in which SEDA can assist these farmers.<br />
<strong>Small</strong>/Medium <strong>Enterprise</strong>s<br />
This applies to small farmers<br />
158
Areas for intervention<br />
• SEDA could facilitate partnerships between academic institutions and small farmers<br />
to share knowledge on crop diseases and methods of prevention.<br />
Timeframe<br />
Short term<br />
Decreased reliance on imported products<br />
Opportunities/Challenges<br />
South Africa is currently a net importer of agricultural products such as wheat and red meat, to name a few. This<br />
creates a significant opportunity for small and medium scale farmers to supplement the country’s current<br />
production, in turn may reducing the country’s reliance on imported commodities.<br />
<strong>Small</strong>/Medium <strong>Enterprise</strong>s<br />
This applies to small and medium scale farmers<br />
Areas for intervention<br />
• SEDA could facilitate partnerships between academic institutions and small and<br />
medium scale farmers to share knowledge on wheat and animal farming methods.<br />
• An opportunity exists for SEDA to assist rural farmers in servicing the commercial<br />
market. These farmers would require technical knowledge about the commercial<br />
markets and would need to invest in appropriate infrastructure to service the<br />
commercial market.<br />
Timeframe<br />
Short term<br />
Long term<br />
159
10 Concluding remarks<br />
The KPMG team conducted an extensive desktop research study of the agriculture sector in South<br />
Africa with the main objective being the identification of economic potential, and, in turn,<br />
opportunities for small and medium enterprises and job-creation. The study analysed the current and<br />
future state of the agricultural sector. This enabled an assessment of possible opportunities in which<br />
SEDA can assist small and medium enterprises to enhance their businesses, in turn, improving the<br />
overall sector performance.<br />
The analysis comprised a desktop analysis, survey of potential SEDA clients and a survey of SEDA<br />
practitioners. The desktop research provided insight into the current and future trends within the<br />
agricultural sector as well as potential challenges faced by small and medium enterprises. The survey<br />
of SEDA’s potential clients provided information on where SEDA can intervene and what services<br />
and products it can develop to assist small and medium enterprises.<br />
Respondents for the survey were drawn from a wide variety of institutions covering industry<br />
associations, farmers, academic institutions and financial bodies. In terms of awareness, just under<br />
two-thirds of respondents were away of the role that SEDA can play in the agricultural sector with<br />
44% of respondents aware of existing incentives that farmers can utilise in the sector. Respondents<br />
perceived the most serious challenges for small and medium enterprises to be lack of access to<br />
finance, lack of access to land, the high cost of doing business and the lack of research and<br />
technology information networks. When asked about what SEDA can do to assist in dealing with<br />
these challenges, the overwhelming response was for SEDA to form strategic partnerships with<br />
finance institutions and academic and scientific bodies to broker access to SEDA clients.<br />
As an additional value-add to the project, the KPMG team spoke to SEDA practitioners operating<br />
around the country. The objective of the survey was to gain an understanding of the challenges<br />
facing potential SEDA clients, as observed by SEDA practitioners. The practitioners were also<br />
questioned about challenges they encountered during the course of their work, In addition, they were<br />
asked about what they would require to perform their jobs more effectively.<br />
The respondents were located across South Africa and covered a wide range of service areas<br />
including, SMME development, business development, cooperatives and technical support. When<br />
asked about the major challenges faced while as SEDA practitioners, the most common responses<br />
were excessive administrative processes, lack of skills and difficulties in assisting clients gain access<br />
to finance and markets. When questioned about the challenges facing SEDA clients, their responses<br />
mirrored those of the potential clients and the main issues highlighted were access to finance and<br />
lack of skills.<br />
The results of all 3 segments of the engagement enabled an assessment of possible opportunities in<br />
which SEDA can assist small and medium enterprises in the agricultural sector. The possible areas of<br />
intervention, which the KPMG team identified, were within the following broad categories:<br />
■ Assistance due to lack of transport infrastructure<br />
■ Provision of affordable loan agreements<br />
■ Low percentage of arable land<br />
■ Inadequate supply of water<br />
■ Rising electricity cost and supply<br />
■ Assistance to enter the export market<br />
■ Shift towards organic products<br />
■ Sharing technical and practical knowledge on farming methods<br />
160
■ Decreasing the reliance on imported products<br />
161
Appendix 1 Linkages with relevant stakeholders<br />
Relevant stakeholders contacted<br />
The table below is a list of relevant stakeholders contacted for the <strong>Small</strong> <strong>Enterprise</strong> survey.<br />
Stakeholder<br />
Contact<br />
Response<br />
Received<br />
Contact Details<br />
Reminder<br />
email/phone<br />
call<br />
Agri SETA<br />
National<br />
Department of<br />
Agriculture<br />
Omnia Agriculture<br />
Standard Bank<br />
agribusiness<br />
No contact - Email<br />
and telephone call<br />
Mr S Galane – Email<br />
and telephone call<br />
No contact – Email<br />
(2 addresses)<br />
No contact - Email<br />
none<br />
none<br />
info@agirseta.co.za<br />
DAIS@daff.gov.za<br />
yes<br />
yes<br />
none fertilizer@omnia.co.za yes<br />
specialities@omnia.co.za<br />
none<br />
agriculture@standardbank.co.za<br />
FNB agribusiness No contact - Email none yes<br />
agric@fnb.co.za<br />
Agriculture<br />
Business<br />
Jennifer, Lindie &<br />
John – Email and<br />
telephone call<br />
none<br />
jennifer@agribiz.co.za<br />
lindie@agribiz.co.za<br />
john@agribz.co.za<br />
Agri operations No contact - email none yes<br />
afgri@afgri.co.za<br />
Agrinet Ltd<br />
BKB Ltd<br />
Land Bank<br />
Mutual and Federal<br />
agri<br />
Santam agri<br />
Landbou weekblad<br />
Farmers weekly<br />
Agri South Africa<br />
Humansdorp<br />
kooperasie Beperk<br />
No contact – email<br />
and telephone call<br />
No contact – email<br />
and telephone call<br />
P Hadebe & M<br />
Mchunu - email<br />
No contact – email<br />
(2 addresses)<br />
T Doyer, J Louw, H<br />
Du Plessis, S<br />
Schultz - email<br />
No contact –<br />
telephone call<br />
Annelie Groenwald<br />
– telephone call<br />
No contact- email<br />
Frans Odendaal –<br />
telephone call<br />
none<br />
none<br />
yes –<br />
questionnaire<br />
returned<br />
none<br />
yes – feel it is<br />
not relevant to<br />
their business<br />
none<br />
yes –<br />
questionnaire<br />
returned<br />
none- email<br />
failed<br />
yesquestionnaire<br />
returned<br />
mail@agrinet.co.za<br />
bkb@bkb.co.za<br />
yes<br />
yes<br />
yes<br />
yes<br />
info@landbank.co.za<br />
phadebe@landbank.co.za -<br />
mmchunu@landbank.co.za<br />
agri@mf.co.za<br />
cropinfo@mf.co.za<br />
tobias.doyer@santam.co.za<br />
jan.louw@santam.co.za<br />
hannesduplessis@santam.co.za<br />
schalk.schultz@santam.co.za<br />
landbou@media24.co.za<br />
telephonic response<br />
agrisa@agriinfo.co.za<br />
042 295 1082 -<br />
yes<br />
yes<br />
yes<br />
-<br />
-<br />
Agri Eastern Cape<br />
Sharlene Matthews<br />
– email & telephone<br />
call<br />
none<br />
sharlene.matthews@agricec.co.za<br />
agriec@mweb.co.za<br />
041 363 1890<br />
yes<br />
ARC-SGI<br />
E Burger – email &<br />
telephone call<br />
none – email<br />
failed<br />
burgere@arc.agri.za<br />
yes<br />
162
OVK Operations<br />
C Jooste - email<br />
none<br />
chrisj@ovk.co.za<br />
yes<br />
Agri Free State<br />
P Moller – email &<br />
telephone call<br />
none –<br />
unroutable<br />
address<br />
vsl@mweb.co.za -<br />
Agricultural<br />
Economics<br />
Department of the<br />
Free State<br />
P Mokhatla, Prof BJ<br />
Willense & Ms Van<br />
der Merwe - email<br />
yesquestionnaire<br />
returned<br />
WillemseBJ@ufs.ac.za<br />
mokhatlapp@ufs.ac.za<br />
vdmerwe@ufs.ac.za<br />
-<br />
University of<br />
Pretoria<br />
J Kirsten – email &<br />
telephone call<br />
yesquestionnaire<br />
not relevant to<br />
them as they<br />
are an<br />
educational<br />
insitution<br />
johann.kirsten@up.ac.za<br />
yes<br />
Kwazulu Natal Agri<br />
union<br />
Agri Mpumalanga<br />
No contact – email<br />
& telephone call<br />
N Bosman- email &<br />
telephone call<br />
none director@kwanalu.co.za yes<br />
none mlunie@mweb.co.za yes<br />
Senwes Pty Ltd<br />
C. Segotla –<br />
telephone call<br />
yes –<br />
questionnaire<br />
retuened<br />
018 464 7800 -<br />
NWK Ltd<br />
No contact – email<br />
& telephone call<br />
none sekr@nwk.co.za yes<br />
Agri Northern Cape<br />
P P van Rensburg –<br />
email & telephone<br />
call<br />
none<br />
ncagric@worlonline.co.za<br />
053 839 7833<br />
yes<br />
Sentraal Suidkus<br />
Kooperasie<br />
H De Beer –<br />
telephone call<br />
yes –<br />
questionnaire<br />
returned<br />
028 514 8609 -<br />
Overberg Agri<br />
No contact – email<br />
& telephone call<br />
none info@overbergagri.co.za yes<br />
Agri Western Cape J Bothma – email<br />
none -<br />
undeliverable<br />
botesm@wpk.co.za -<br />
Agri North West<br />
P Auret – email<br />
none -<br />
undeliverable<br />
nwlu@isdnet.co.za<br />
yes<br />
National Africna<br />
Farmers<br />
Union(NAFU)<br />
No contact - email none nafuoffice@nafuwesterncape.co.za yes<br />
Maswela Farm &<br />
De Oude voor<br />
Farm - NW<br />
G van der Merwe -<br />
email<br />
yes –<br />
questionnaire<br />
returned<br />
maswela@absamail.co.za<br />
deoudevoor@gmail.com<br />
-<br />
Owen Sithole E Adup – email &<br />
Agricultural College telephone call<br />
none emmaueladup@gmail.com yes<br />
UNISA<br />
Western Cape<br />
Department of<br />
Agriculture<br />
Prof DM Modise &<br />
other – email &<br />
telephone call<br />
Theresa – email &<br />
telephone call<br />
none mphurts@unisa.ac.za yes<br />
none theresam@elsenberg.com yes<br />
163
Grain SA Debbie - email none debbie@grainsa.co.za yes<br />
SA cane growers<br />
Mpumalanga<br />
Agricultural<br />
Sciences<br />
Food and<br />
Agricultural<br />
Organisation<br />
J Ferguson – email<br />
and telephone call<br />
R Koroma – email &<br />
telephone call<br />
l.Mlati – email &<br />
telephone call<br />
none jferguson@sacanegrowers.co.za yes<br />
none rashidkoroma@gmail.com yes<br />
none Lot.mlati@fao.org yes<br />
Lowveld<br />
Agricutural College<br />
N Sminisi – email &<br />
telephone call<br />
none nsminisi@mpg.gov.za yes<br />
North West<br />
University<br />
L Van der Walt -<br />
email<br />
yes –<br />
questionnaire<br />
returned<br />
LouwVanDerWalt@nwu.co.za -<br />
South African<br />
National Suagr<br />
Organisation<br />
AG Reitsma –<br />
telephone call<br />
yes –<br />
questionnaire<br />
returned<br />
genman@sansor.co.za -<br />
Elsenberg<br />
Debbie –email &<br />
telephone call<br />
none debbieb@elsenberg.co.za yes<br />
Madzivhandila<br />
College of<br />
Agriculture<br />
Phillip – telephone<br />
call<br />
yes –<br />
questionnaire<br />
returned<br />
015 962 7200 -<br />
Grootfontein<br />
College<br />
Scoonraad –<br />
telephone call<br />
yes –<br />
questionnaire<br />
returned<br />
049 842 1113 -<br />
KZN Cotton<br />
Producers<br />
P Gumede –<br />
telephone call<br />
yes –<br />
questionnaire<br />
returned<br />
033 342 9393 -<br />
AFASA chairperson E Matthews none office@afasa.org.za yes<br />
Horticulture -<br />
UNISA Dept of<br />
Environmental<br />
Sciences<br />
No contact – email<br />
& telephone call<br />
none 011 471 2984 yes<br />
Owen Sithole E Adup –email &<br />
Agricultural College telephone call<br />
none 035 795 1345 yes<br />
Pietermaritzburg<br />
Science and<br />
Agricultural Faculty<br />
B Bose – email &<br />
telephone call<br />
none<br />
yes<br />
Cedar College of<br />
Agriculture<br />
M Mkize –<br />
telephone call<br />
none 033 355 9304 yes<br />
Fort Cox College of<br />
Agriculture &<br />
Forestry<br />
No contact –<br />
telephone call<br />
none 040 653 8033 yes<br />
Glen College of<br />
Agriculture<br />
Madzivhandila<br />
College of<br />
Agriculture<br />
Dry Bean<br />
Producers<br />
No contact –<br />
telephone call<br />
Mkize – telephone<br />
call<br />
No contact –<br />
telephone call<br />
none 051 861 1217 yes<br />
none 015 962 7200 yes<br />
none 018 2996100 yes<br />
164
Organisation<br />
Forestry SA<br />
SA Cotton<br />
Producers<br />
Organisation<br />
No contact –<br />
telephone call<br />
No contact –<br />
telephone call<br />
none 011 803 3403/4 yes<br />
none 012 804 1464 yes<br />
South African<br />
Sugar Organisation<br />
No contact –<br />
telephone call<br />
none 031 508 7700 yes<br />
National<br />
Department of<br />
Education<br />
Mpumalanga<br />
Agricultural<br />
Sciences<br />
Northern Cape<br />
Agricultural<br />
Sciences<br />
North West<br />
Agricultural<br />
Sciences<br />
Limpopo<br />
Agricultural<br />
Sciences<br />
Food and<br />
Agricultural<br />
Organisation<br />
K Naidoo –<br />
telephone call<br />
Gobella – telephone<br />
call<br />
M Dwarika –<br />
telephone call<br />
Tshanabung/Mukozi<br />
– telephone call<br />
D letrula –<br />
telephone call<br />
Mlati – telephone<br />
call<br />
none 012 357 3000 yes<br />
none 013 753 3064 yes<br />
none 053 465 0424 yes<br />
none 018 299 6556 yes<br />
none 013 268 9300 yes<br />
none 012 351 1000 yes<br />
Lowveld<br />
Nomsa – telephone<br />
Agricultural College call<br />
Agricultural No contact –<br />
renaissance project telephone call<br />
none 013 753 3064 yes<br />
none 021 888-5808 yes<br />
Agrinet Ltd<br />
South African<br />
Confederation of<br />
Agricultural<br />
Unions(SACAU)<br />
Rupert – telephone<br />
call<br />
No contact – email<br />
& telephone call<br />
none 021 959 5420 yes<br />
none info@sacau.org yes<br />
Agri SA<br />
D Maree - email<br />
yes –<br />
questionnaire<br />
returned<br />
agrisa@agrisa.co.za -<br />
Citrus Growers<br />
Association<br />
JB Chadwick, J<br />
Edmonds, P<br />
Hardman – email<br />
yes –<br />
questionnaire<br />
returned<br />
justchad@iafrica.com<br />
johne@cga.co.za<br />
ph@cga.co.za<br />
-<br />
Agricultural<br />
Research Council<br />
Grain crop institute,<br />
industrial crop<br />
institute and tropical<br />
& sub tropical<br />
institute - email<br />
yes –<br />
questionnaire<br />
not applicable<br />
jamesm@arc.agric.za<br />
infoic@arc.agric.za<br />
antooncor@arc.agric.za<br />
infoitsc@arc.agric.za<br />
-<br />
Kwanalu KZN<br />
Landbou unie<br />
Sandy & Lyn - email<br />
none<br />
sandy@kwanalu.co.za<br />
lyn@kwanalu.co.za<br />
-<br />
National Wool<br />
Growers<br />
H Prinsloo – email none jhprinsloo@lantic.net -<br />
165
Association<br />
ChrisaVH@nda.agri.za<br />
Vrystaat Landbou<br />
Unie<br />
H Vermuelen & C<br />
van heerden - email<br />
none<br />
henk@vslandbou.co.za<br />
sulene@vslandbou.co.za<br />
-<br />
Milk Producers<br />
Organisation<br />
No contact - email none info@mpo.co.za -<br />
AgriExpo J Ehlers - email none johan@agriexpo.co.za -<br />
Agrifica<br />
No contact email (2<br />
addresses)<br />
none<br />
agrifica@agrifica.co.za<br />
agrifica1@agrifica.co.za<br />
-<br />
AgriMega No contact - email none agrimega@telkomsa.net -<br />
Red Meat<br />
Producers<br />
No contact - email<br />
yes –<br />
questionnaire<br />
not relevant<br />
rpo@lantic.net -<br />
SA Table Grape<br />
Industry<br />
P Bowes, E<br />
Alexander & R<br />
Gounden - email<br />
yesquestionnaire<br />
returned<br />
elanie@satgi.co.za<br />
rhomona@satgi.co.za<br />
-<br />
Vinpro<br />
J Gilliomee, J le<br />
Roux, J Loots, G<br />
van Wyk - email<br />
yesquestionnaire<br />
returned<br />
lerouxj@vinpro.co.za<br />
jana@vinpro.co.za<br />
vanwyk@vinpro.co.za<br />
johanq@vinpro.co.za<br />
-<br />
Hortgro Christoff - email none christoff@hortgro.co.za -<br />
Cendel<br />
N Schutte - email<br />
yesquestionnaire<br />
returned<br />
012 843 5745 -<br />
166
Contact us<br />
Lullu Krugel<br />
Financial Risk Management<br />
T +27 (0)11 647-8516<br />
E lullu.krugel@kpmg.co.za<br />
Prashant Karuthasen<br />
Financial Risk Management<br />
T +27 (0)11 674-8744<br />
E prashant.karuthasen@kpmg.co.za<br />
www.kpmg.com<br />
©2012, KPMG Services (Pty) Ltd, a South African company and a member firm of the<br />
KPMG network of independent member firms affiliated with KPMG International<br />
Cooperative (“KPMG International”), a Swiss entity. All rights reserved.<br />
The information contained herein is of a general nature and is not intended to address the<br />
circumstances of any particular individual or entity. Although we endeavour to provide<br />
accurate and timely information, there can be no guarantee that such information is<br />
accurate as of the date it is received or that it will continue to be accurate in the future. No<br />
one should act on such information without appropriate professional advice after a thorough<br />
examination of the particular situation.<br />
The KPMG name, logo and “cutting through complexity” are registered trademarks or<br />
trademarks of KPMG International.