Assessment of Cooperatives in the Poultry Industry - 2013.pdf - Seda
Assessment of Cooperatives in the Poultry Industry - 2013.pdf - Seda
Assessment of Cooperatives in the Poultry Industry - 2013.pdf - Seda

You also want an ePaper? Increase the reach of your titles
YUMPU automatically turns print PDFs into web optimized ePapers that Google loves.
2013<br />
Research Report: Address<strong>in</strong>g <strong>the</strong> Needs, Opportunities and Challenges <strong>of</strong> <strong>Cooperatives</strong><br />
and Collectively Owned Enterprises <strong>in</strong> <strong>the</strong> <strong>Poultry</strong> and Related Industries<br />
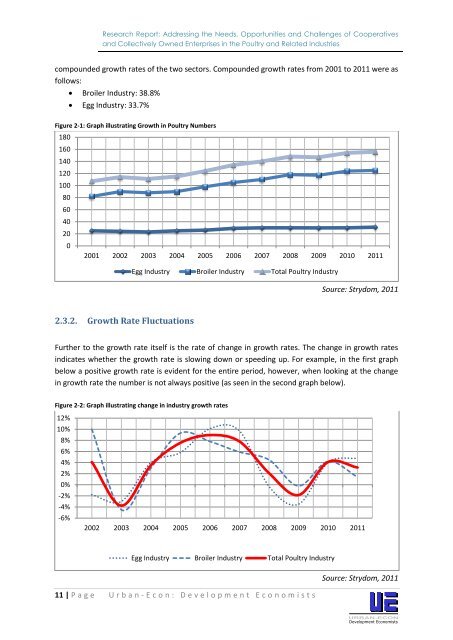
compounded growth rates <strong>of</strong> <strong>the</strong> two sectors. Compounded growth rates from 2001 to 2011 were as<br />
follows:<br />
Broiler <strong>Industry</strong>: 38.8%<br />
Egg <strong>Industry</strong>: 33.7%<br />
Figure 2-1: Graph illustrat<strong>in</strong>g Growth <strong>in</strong> <strong>Poultry</strong> Numbers<br />
180<br />
160<br />
140<br />
120<br />
100<br />
80<br />
60<br />
40<br />
20<br />
0<br />
2001 2002 2003 2004 2005 2006 2007 2008 2009 2010 2011<br />
Egg <strong>Industry</strong> Broiler <strong>Industry</strong> Total <strong>Poultry</strong> <strong>Industry</strong><br />
Source: Strydom, 2011<br />
2.3.2.<br />
Growth Rate Fluctuations<br />
Fur<strong>the</strong>r to <strong>the</strong> growth rate itself is <strong>the</strong> rate <strong>of</strong> change <strong>in</strong> growth rates. The change <strong>in</strong> growth rates<br />
<strong>in</strong>dicates whe<strong>the</strong>r <strong>the</strong> growth rate is slow<strong>in</strong>g down or speed<strong>in</strong>g up. For example, <strong>in</strong> <strong>the</strong> first graph<br />
below a positive growth rate is evident for <strong>the</strong> entire period, however, when look<strong>in</strong>g at <strong>the</strong> change<br />
<strong>in</strong> growth rate <strong>the</strong> number is not always positive (as seen <strong>in</strong> <strong>the</strong> second graph below).<br />
Figure 2-2: Graph illustrat<strong>in</strong>g change <strong>in</strong> <strong>in</strong>dustry growth rates<br />
12%<br />
10%<br />
8%<br />
6%<br />
4%<br />
2%<br />
0%<br />
-2%<br />
-4%<br />
-6%<br />
2002 2003 2004 2005 2006 2007 2008 2009 2010 2011<br />
Egg <strong>Industry</strong> Broiler <strong>Industry</strong> Total <strong>Poultry</strong> <strong>Industry</strong><br />
11 | P a g e U r b a n - E c o n : D e v e l o p m e n t E c o n o m i s t s<br />
Source: Strydom, 2011