Bibliometric Analysis Asia-Pacific Research Area ... - JuSER
Bibliometric Analysis Asia-Pacific Research Area ... - JuSER
Bibliometric Analysis Asia-Pacific Research Area ... - JuSER
- No tags were found...

You also want an ePaper? Increase the reach of your titles
YUMPU automatically turns print PDFs into web optimized ePapers that Google loves.
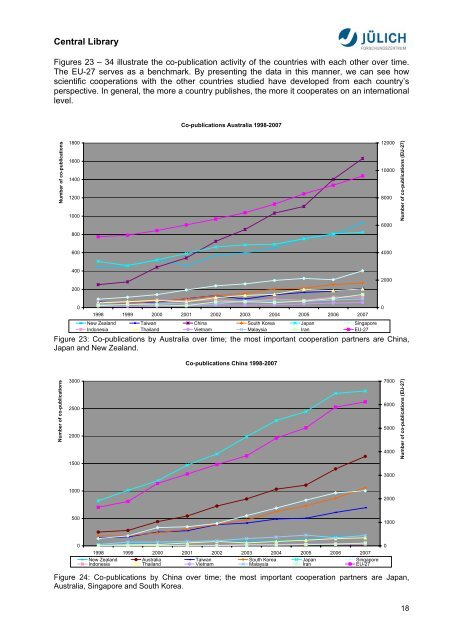
Central Library<br />
Figures 23 – 34 illustrate the co-publication activity of the countries with each other over time.<br />
The EU-27 serves as a benchmark. By presenting the data in this manner, we can see how<br />
scientific cooperations with the other countries studied have developed from each country’s<br />
perspective. In general, the more a country publishes, the more it cooperates on an international<br />
level.<br />
Co-publications Australia 1998-2007<br />
Number of co-publications<br />
1800<br />
1600<br />
1400<br />
1200<br />
1000<br />
800<br />
12000<br />
10000<br />
8000<br />
6000<br />
Number of co-publications (EU-27)<br />
600<br />
4000<br />
400<br />
200<br />
2000<br />
0<br />
1998 1999 2000 2001 2002 2003 2004 2005 2006 2007<br />
New Zealand Taiwan China South Korea Japan Singapore<br />
Indonesia Thailand Vietnam Malaysia Iran EU-27<br />
Figure 23: Co-publications by Australia over time; the most important cooperation partners are China,<br />
Japan and New Zealand.<br />
Co-publications China 1998-2007<br />
0<br />
Number of co-publications<br />
3000<br />
2500<br />
2000<br />
1500<br />
7000<br />
6000<br />
5000<br />
4000<br />
3000<br />
Number of co-publications (EU-27)<br />
1000<br />
2000<br />
500<br />
1000<br />
0<br />
1998 1999 2000 2001 2002 2003 2004 2005 2006 2007<br />
New Zealand Australia Taiwan South Korea Japan Singapore<br />
Indonesia Thailand Vietnam Malaysia Iran EU-27<br />
0<br />
Figure 24: Co-publications by China over time; the most important cooperation partners are Japan,<br />
Australia, Singapore and South Korea.<br />
18