- Page 1 and 2: Bibliometric Analysis Asia-Pacific
- Page 3 and 4: Central Library Management Summary
- Page 5 and 6: Central Library Pacific research ar
- Page 7 and 8: Data
- Page 9 and 10: Central Library A high production o
- Page 11 and 12: Central Library 1992 1993 1994 1995
- Page 13 and 14: Central Library Figures 6 to 8 show
- Page 15 and 16: Central Library Figure 9 reveals th
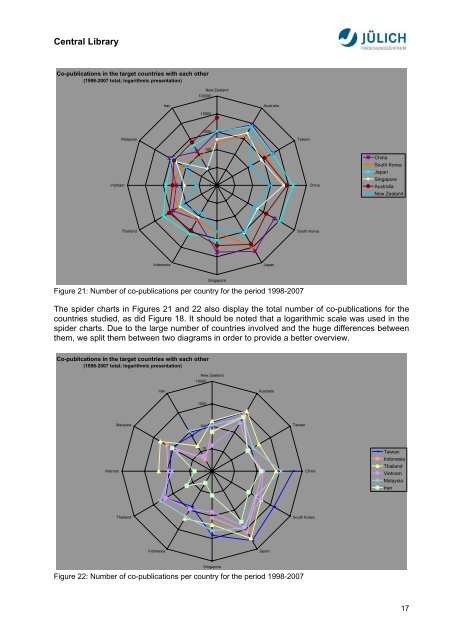
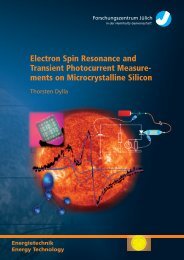
- Page 17 and 18: Central Library Figure 12 shows tha
- Page 19 and 20: Central Library Development of co-p
- Page 21 and 22: Central Library Co-publications by
- Page 23: Central Library Co-publications per
- Page 27 and 28: Central Library Co-publications Tai
- Page 29 and 30: Central Library Co-publications Vie
- Page 31 and 32: Central Library Co-publications by
- Page 33 and 34: Central Library Publications by cou
- Page 35 and 36: Central Library Number of publicati
- Page 37 and 38: Central Library publications in bio
- Page 39 and 40: Central Library 2.2 Growth Rates fo
- Page 41 and 42: Central Library Growth rates per di
- Page 43 and 44: Central Library Growth rates per di
- Page 45 and 46: Central Library Growth rates per di
- Page 47 and 48: Central Library Growth rates New Ze
- Page 49 and 50: Central Library Growth rates Singap
- Page 51 and 52: Central Library Growth rates Malays
- Page 53 and 54: Central Library Chemistry 1998-2007
- Page 55 and 56: Central Library Materials Science 1
- Page 57 and 58: Central Library Biology and Biotech
- Page 59 and 60: Central Library Materials Science 1
- Page 61 and 62: Central Library Singapore Agricultu
- Page 63 and 64: Central Library Information Science
- Page 65 and 66: Central Library Nanotechnology 1998
- Page 67 and 68: Central Library Energy 1998-2007 19
- Page 69 and 70: Central Library Mathematics 1998-20
- Page 71 and 72: Central Library Biology and Biotech
- Page 73 and 74: Central Library Materials Science 1
- Page 75 and 76:
Central Library Ranking of key coun
- Page 77 and 78:
Central Library Engineering Science
- Page 79 and 80:
Central Library Physics 1998-2007 1
- Page 81 and 82:
Central Library Information Science
- Page 83 and 84:
Central Library Nanotechnology 1998
- Page 85 and 86:
Central Library Geoscience 1998-200
- Page 87 and 88:
Central Library Multidisciplinary J
- Page 89 and 90:
Central Library Energy 1998-2007 19
- Page 91 and 92:
Central Library Medicine 1998-2007
- Page 93 and 94:
Central Library Chemistry 1998-2007
- Page 95 and 96:
Central Library Mathematics 1998-20
- Page 97 and 98:
Central Library Biology and Biotech
- Page 99 and 100:
Central Library Materials Science 1
- Page 101 and 102:
Central Library Taiwan Agricultural
- Page 103 and 104:
Central Library Geoscience 1998-200
- Page 105 and 106:
Central Library Multidisciplinary J
- Page 107 and 108:
Central Library Average citation ra
- Page 109 and 110:
Central Library Average citation ra
- Page 111 and 112:
Central Library Citation rates for
- Page 113 and 114:
Central Library Citation rates for
- Page 115 and 116:
Central Library Citation rates for
- Page 117 and 118:
Central Library Citation rates Germ
- Page 119 and 120:
Central Library Citation rates Aust
- Page 121 and 122:
Central Library Citation rates Indo
- Page 123 and 124:
Central Library Citation rates Iran
- Page 125 and 126:
Central Library Number of publicati
- Page 127 and 128:
Central Library Number of publicati
- Page 129 and 130:
Central Library Number of publicati
- Page 131 and 132:
Central Library Number of publicati
- Page 133 and 134:
Central Library Number of publicati
- Page 135 and 136:
Central Library Number of publicati
- Page 137 and 138:
Central Library 3.4 Discipline-Spec
- Page 139 and 140:
Central Library Discipline‐specif
- Page 141 and 142:
Central Library Field‐normalised
- Page 143 and 144:
Central Library 4. Network Analysis
- Page 145 and 146:
Central Library of all Indonesian p
- Page 147 and 148:
Central Library Figure 114: Co-publ
- Page 149 and 150:
Central Library Figure 116: Interna
- Page 151 and 152:
Central Library With the aid of a n
- Page 153 and 154:
Central Library Share of total outp
- Page 155 and 156:
Central Library Figure 121: Co-publ