Bibliometric Analysis Asia-Pacific Research Area ... - JuSER
Bibliometric Analysis Asia-Pacific Research Area ... - JuSER
Bibliometric Analysis Asia-Pacific Research Area ... - JuSER
- No tags were found...

Create successful ePaper yourself
Turn your PDF publications into a flip-book with our unique Google optimized e-Paper software.
<strong>Bibliometric</strong> <strong>Analysis</strong><br />
<strong>Asia</strong>-<strong>Pacific</strong> <strong>Research</strong> <strong>Area</strong><br />
commissioned by the International Bureau of BMBF at DLR<br />
<strong>Bibliometric</strong> <strong>Analysis</strong><br />
<strong>Asia</strong>-<strong>Pacific</strong> <strong>Research</strong> <strong>Area</strong>
Central Library<br />
Table of Contents<br />
Management Summary........................................................................................................................... III<br />
Data .......................................................................................................................................................VII<br />
1. Publication <strong>Analysis</strong> on a Country Basis ...........................................................................................1<br />
1.1 An International Comparison of Publication Activity.................................................................... 1<br />
1.2 Co-Publications on a Country Basis.......................................................................................... 11<br />
1.3 Co-Publications on a Country Basis between the Countries Studied........................................ 15<br />
2. Publication <strong>Analysis</strong> Based on <strong>Research</strong> Disciplines ......................................................................25<br />
2.1 Publication Activity of Selected Countries ................................................................................. 25<br />
2.2 Growth Rates for Publication Activity ........................................................................................ 32<br />
2.3 Co-Publications ......................................................................................................................... 45<br />
3. Citation <strong>Analysis</strong> ..............................................................................................................................99<br />
3.1 Citation Rates for the Countries Studied over the Entire Period ............................................... 99<br />
3.2 Citation Rates for the Countries Studied over Time ................................................................ 103<br />
3.3 Publication Output and Perception of Countries Compared to Germany ................................ 117<br />
3.4 Discipline-Specific Profiles of the Publication Output and its Perception ................................ 130<br />
4. Network Analyses..........................................................................................................................136<br />
This report was prepared by:<br />
Stefanie Haustein, Dr. Bernhard Mittermaier and Dr. Dirk Tunger<br />
It was updated in 2009 by:<br />
Stefanie Haustein and Dr. Dirk Tunger<br />
Translation:<br />
Hazel Rochford<br />
Responsible for the content:<br />
Dr. Bernhard Mittermaier, Forschungszentrum Jülich GmbH, 52425 Jülich, Germany<br />
Preparation period:<br />
July – October 2008<br />
Contact:<br />
Email: zb-bibliometrie@fz-juelich.de<br />
Tel.: +49 2461 61 6198<br />
Further information on bibliometrics in the Central Library is available at:<br />
http://www.fz-juelich.de/zb/<strong>Bibliometric</strong>s<br />
Data Sources<br />
• Thomson Scientific (ISI) databases Science Citation Index Expanded (SCI),<br />
Social Sciences Citation Index (SSCI) and Arts & Humanities Citation Index (A&HCI), accessed<br />
via the Web of Science in July 2008<br />
• Science Citation Index Expanded, accessed via STN in August 2008<br />
• “Discipline-specific profiles” update: Thomson Scientific (ISI) databases Science Citation Index<br />
Expanded (SCI),<br />
Social Sciences Citation Index (SSCI) and Arts & Humanities Citation Index (A&HCI), accessed<br />
via the Web of Science in August 2009<br />
• “Network analysis” update: Thomson Scientific (ISI) databases Science Citation Index<br />
Expanded (SCI),<br />
Social Sciences Citation Index (SSCI) and Arts & Humanities Citation Index (A&HCI), accessed<br />
via the Web of Science in April 2009<br />
II
Central Library<br />
Management Summary<br />
<strong>Bibliometric</strong> analyses provide information on publication performance (quantitative), the<br />
perception and impact of publications in the specialist community (qualitative), and<br />
international scientific cooperations (co-publication analysis).<br />
Of all of the various types of scientific publications (e.g. books, conference papers and<br />
essays), bibliometric analyses focus predominantly on publications in journals. A database,<br />
known to scientists as the Web of Science, evaluates approximately 9,300 international<br />
scientific journals on a regular basis. The Web of Science consists of the Science Citation<br />
Index (SCI), the Social Sciences Citation Index (SSCI) and the Arts & Humanities Citation<br />
Index (A&HCI). The indexed journals are referred to as the “core journals” and they publish the<br />
majority of scientific research results.<br />
This study<br />
Publications 1992 - 2007<br />
focuses on the<br />
following countries<br />
from the 140000<br />
500000<br />
<strong>Asia</strong>-<strong>Pacific</strong> research<br />
area:<br />
120000<br />
400000<br />
Australia, China,<br />
100000<br />
Indonesia, Iran,<br />
Japan, Malaysia,<br />
80000<br />
300000<br />
New Zealand,<br />
Singapore,<br />
60000<br />
200000<br />
South Korea,<br />
Taiwan, Thailand<br />
and Viet-<br />
100000<br />
40000<br />
20000<br />
nam. The first<br />
aspect we look<br />
0<br />
0<br />
at is an output<br />
1992 1993 1994 1995 1996 1997 1998 1999 2000 2001 2002 2003 2004 2005 2006 2007<br />
analysis of<br />
Germany Japan China Australia South Korea Taiwan New Zealand Singapore<br />
Iran Thailand Malaysia Indonesia Vietnam USA EU-27<br />
these and other<br />
selected countries.<br />
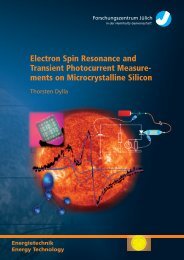
The development of the publication frequency in the Web of Science database will be<br />
investigated for the period 1992 to 2007. The figure above shows the number of publications<br />
by each country studied during the period under investigation. The almost exponential<br />
increase in publications by China can be clearly seen. This aspect will be taken up and<br />
discussed again in all of the following chapters of this analysis. Furthermore, this development<br />
of publication activity reveals that Japan is on a similar course to Germany in terms of the<br />
number of published scientific articles, and also that Japan is well ahead of the other countries<br />
studied. The increase in publications in the period under review from 1992 to 2007 in Japan,<br />
however, is much smaller than in China. Iran, in contrast, experienced a forty-fold increase in<br />
its output. However, it should be noted that Iran has a very low total number of publications.<br />
Number of publications<br />
Number of publications (USA and EU-27)<br />
III
Central Library<br />
Another focal point<br />
of this bibliometric<br />
analysis is the copublication<br />
activity<br />
for the individual<br />
countries with Germany,<br />
the USA and<br />
with each other. The<br />
figure opposite very<br />
clearly shows that<br />
Japan is the country<br />
with the most copublications<br />
with<br />
Germany, followed<br />
by Australia and<br />
China. Despite the<br />
rapid increase in the<br />
total number of its<br />
Number of co-publications<br />
1000<br />
900<br />
800<br />
700<br />
600<br />
500<br />
400<br />
300<br />
200<br />
100<br />
0<br />
Co-publications Germany 1998-2007<br />
1998 1999 2000 2001 2002 2003 2004 2005 2006 2007<br />
New Zealand Taiwan South Korea Singapore Indonesia Thailand Vietnam<br />
Malaysia Iran Australia China Japan<br />
publications, China remains the country with the third largest number of co-publications with<br />
Germany (8,242 articles) throughout the period under review. With 10,417 articles, Australia is<br />
in second place, while Japan is in first place with 16,514 publications.<br />
2000<br />
1500<br />
1000<br />
500<br />
0<br />
Number of co-publications (Australia, China and Japan)<br />
These co-publications represent<br />
1.9 % of the total number of<br />
publications for both Japan and<br />
Germany. From Germany’s<br />
perspective, Japan is followed by<br />
Australia and China in second and<br />
third place with 1.2 % and 0.9 %,<br />
respectively. Co-publications with<br />
Germany represent 6.6 % and 6.4 %,<br />
respectively, of Indonesia’s and<br />
Vietnam’s total output, making<br />
Germany the most important<br />
cooperation partner among the 12<br />
nations studied for Indonesia and<br />
Vietnam.<br />
Number of copublications<br />
with<br />
Germany<br />
Weighting from<br />
the country's<br />
perspective<br />
Weighting<br />
from<br />
Germany's<br />
perspective<br />
Japan 16514 1.9% 1.9%<br />
Australia 10417 3.3% 1.2%<br />
China 8248 1.5% 0.9%<br />
South Korea 3366 1.5% 0.4%<br />
New Zealand 1910 3.1% 0.2%<br />
Taiwan 1820 1.3% 0.2%<br />
Singapore 996 1.8% 0.1%<br />
Iran 656 1.7% 0.1%<br />
Thailand 598 2.5% 0.1%<br />
Indonesia 396 6.6% 0.04%<br />
Vietnam 315 6.4% 0.04%<br />
Malaysia 269 1.9% 0.03%<br />
At the level of research disciplines, a ranking provides information on the co-publication<br />
partners for each country studied. Such ranking lists allow us to demonstrate changes in<br />
publication behaviour and scientific cooperations for two periods of five years and the total<br />
period under review as a whole. For example, China published the third-highest number of<br />
joint publications in the field of physics with Germany in the period 1998 to 2007 (4,197<br />
publications). Ahead of China are Japan (4,562 publications) and the USA with 9,932 articles.<br />
To summarise, Germany holds one of the top ranks very often and is included in almost every<br />
top-ten list. In around 15 % of all cases, Germany is among the top three countries analysed.<br />
This allows us to conclude that in addition to countries such as the USA, Japan, and the<br />
United Kingdom, Germany is extremely important for the countries studied here from the <strong>Asia</strong>-<br />
IV
Central Library<br />
<strong>Pacific</strong> research area. Germany did not experience any significant shifts over the course of the<br />
survey conducted here in either of the two periods analysed.<br />
China, Physics<br />
1998-2007<br />
The next step involves breaking down the output into<br />
scientific disciplines in order to provide an exact outline of<br />
the development of scientific publications at this level. This<br />
allowed us to determine that of all of the publications by the<br />
12 countries studied in the field of biology and biotechnology,<br />
30 % were contributed by Japan, while China contributed<br />
30 % in the mathematical and chemistry publications that<br />
were evaluated (see Figures 39 and 40 for more on this).<br />
In the third chapter of this study, a citation analysis is<br />
performed in order to determine the citation rates for all of the<br />
countries studied in the scientific disciplines. The perception<br />
of each of the countries in the individual disciplines is then<br />
compared in a variety of constellations for the entire period under review and over time<br />
between the countries. In order to include another benchmark in addition to the comparison of<br />
countries, the perception of the countries in the individual disciplines is compared to that of<br />
Germany in the same subject. If we take Australia as an example, as shown in the adjacent<br />
figure, we<br />
can see how<br />
high the<br />
percentage<br />
deviation of<br />
the citation<br />
rate is in<br />
comparison<br />
to Germany.<br />
For example,<br />
the<br />
perception<br />
Physics<br />
Nanotechnology<br />
Medicine<br />
Mathematics<br />
Materials science<br />
Engineering<br />
Information and computer science<br />
Geosciences<br />
Citation rates for Australia compared to Germany<br />
-18.25%<br />
-18.38%<br />
Co-<br />
Publications<br />
# Country<br />
1 USA 9932<br />
2 Japan 4562<br />
3 Germany 4197<br />
4 UK 2744<br />
5 France 2168<br />
6 Russia 1798<br />
7 South Korea 1657<br />
8 Canada 1656<br />
9 Italy 1587<br />
10 Singapore 1541<br />
Energy<br />
11.49%<br />
for Australia<br />
Chemistry<br />
-6.85%<br />
as a country<br />
-19.30%<br />
Biology and biotechnology<br />
in the<br />
Agricultural science<br />
14.34%<br />
discipline of<br />
Multidisciplinary journals -24.29%<br />
“agricultural<br />
science” is<br />
-30% -20% -10% 0% 10% 20%<br />
Benchmark Germany<br />
14 % higher<br />
than for<br />
Germany. In mathematics, Australia’s perception is 6 % lower than Germany’s. The perception<br />
of Australia is as good as or better than that of Germany in four disciplines. It therefore counts<br />
as one of the countries with the highest citation rates in this study.<br />
Comparisons were not just performed with Germany, but also in relation to an international<br />
benchmark, whereby the publication behaviour of the countries studied together with their<br />
discipline-specific citation rates were compared to an appropriate global reference.<br />
-11.77%<br />
-6.55%<br />
-5.89%<br />
-3.43%<br />
5.93%<br />
7.34%<br />
V
Central Library<br />
Disziplinspezifische Publikationsprofile für China, Japan und Deutschland<br />
("<strong>Research</strong> Articles" & "Reviews", Publikationsjahr 2007)<br />
Physik<br />
Agrarwissenschaften<br />
30%<br />
25%<br />
Biologie und Biotechnologie<br />
Nanotechnologie<br />
20%<br />
15%<br />
Chemie<br />
10%<br />
Multidisziplinäre Zeitschriften<br />
5%<br />
0%<br />
Energie<br />
China<br />
Japan<br />
Deutschland<br />
Medizin<br />
Ingenieurwissenschaften<br />
Mathematik<br />
Geowissenschaften<br />
Materialwissenschaften<br />
Informationswissenschaft und<br />
Informatik<br />
For this comparison, we determined the share of research articles and reviews published by<br />
each country in 2007 in a specific discipline in the databases included in the Web of Science.<br />
Distortions were therefore excluded from the comparisons. The graphic above, for example,<br />
shows that China was involved in almost 30 % of all publications in the category “materials<br />
science” in the Web of Science. The citation rates were also compared with a global reference<br />
for each discipline in order to compare the performance of all countries under optimal<br />
conditions.<br />
The last chapter of the study looks at the issue of networking between the countries studied in<br />
the form of a network analysis using bibliometric methods. A network analysis for the <strong>Asia</strong>n<br />
countries is compared to a corresponding analysis for a comparable number of countries as a<br />
test. The results allow us to conclude that scientific cooperations in South-East <strong>Asia</strong> have<br />
intensified more than the average, which in turn allows us to speak of the development of a<br />
research area from a bibliometric perspective.<br />
VI
Data
Central Library<br />
1. Publication <strong>Analysis</strong> on a Country Basis<br />
1.1 An International Comparison of Publication Activity<br />
The first chapter of this analysis focuses on the publication activity of all of the countries. We will<br />
try to provide an answer to the question of which of the countries analysed from the <strong>Asia</strong>-<strong>Pacific</strong><br />
research area 1 has undergone an above-average development over the past number of years.<br />
For this purpose, the charts and graphs that follow will take a look at the total publication output<br />
of these countries (without breaking the results down according to discipline), as will the<br />
development of cooperations in these countries as represented by the number of copublications.<br />
Publications 1992 - 2007<br />
Total 15 439 935<br />
(co-publications are counted more than once)<br />
Japan<br />
8.15%<br />
China<br />
3.99%<br />
South Korea<br />
1.69%<br />
New Zealand<br />
0.56%<br />
Australia<br />
2.90%<br />
Taiwan<br />
1.19%<br />
Singapore<br />
0.44%<br />
Iran<br />
0.27%<br />
Thailand<br />
0.18%<br />
Malaysia<br />
0.11%<br />
Indonesia<br />
0.05%<br />
Vietnam<br />
0.04%<br />
USA<br />
41.01%<br />
EU-27<br />
39.41%<br />
Figure 1: Proportion of publications in selected countries for the period 1992-2007<br />
As an introduction, the publication output of the 12 countries analysed is shown in relation to the<br />
output of the 27 EU member states 2 (EU-27) and the USA over the same period. Figure 1<br />
shows a pie chart, where the output of each country (or groups of countries in the case of the<br />
EU-27) is shown as a percentage of the total output of all 14 units detailed above. As expected,<br />
the majority of publications come from the EU-27 and the USA (39.4 % and 41.0 %,<br />
respectively). Of the countries studied, the largest proportion come from Japan (8.2 %), China<br />
(4.0 %) and Australia (2.9 %).<br />
While Figure 1 provides an overall impression of the publication activity in the different<br />
countries, the figures that follow take a look at the production of articles over time. China is<br />
characterised by a high increase in the production of articles. Its growth is almost exponential<br />
and leaves all of the other research nations shown trailing behind. In 1992, China started off<br />
with around 9,300 publications, which was far less than Australia. In 2007, China boasted<br />
almost 100,000 publications, which saw it pass out research nations such as Japan (around<br />
90,000 articles) and almost catch up with Germany (approximately 105,000 publications).<br />
1 This study focuses on the following countries: Australia, China, Indonesia, Iran, Japan, Malaysia, New<br />
Zealand, Singapore, South Korea, Taiwan, Thailand and Vietnam.<br />
2 EU-27 is defined for the entire period under review as the EU member states as of January 2007.<br />
1
Central Library<br />
A high production of articles only describes the basis of visibility not the perception. Previous<br />
studies 3 have already shown that China lies well below expectations, which predicted a higher<br />
perception due to the high growth in the production of articles. The situation was found to be the<br />
same in this study (see Chapter 3). However, the production of articles in China also shows that<br />
China is becoming a more important partner in research alliances. Its dynamics should not be<br />
underestimated, even if it did experience a slight decrease in 2007.<br />
Figure 2 shows that the majority of countries analysed produce a level of publications that<br />
currently ranges between a few hundred to around 10,000 per annum. Some of these countries<br />
have high citation rates when taken as percentages, but in terms of absolute numbers, they<br />
remain on a relatively low level. Five countries in this group distinguish themselves from the<br />
others in that they partially exhibit significantly higher outputs. These include: Taiwan, currently<br />
with approximately 20,000 publications per annum, South Korea (approx. 33,000), Australia<br />
(approx. 40,000), Japan (approx. 90,000) and China (approx. 100,000). Out of all of the<br />
countries studied, China is the only country that has sustained a high relative increase together<br />
with a comparably high output over the entire period of this analysis.<br />
Publications 1992 - 2007<br />
Number of publications<br />
140000<br />
120000<br />
100000<br />
80000<br />
60000<br />
500000<br />
400000<br />
300000<br />
200000<br />
Number of publications (USA and EU-27)<br />
40000<br />
100000<br />
20000<br />
0<br />
1992 1993 1994 1995 1996 1997 1998 1999 2000 2001 2002 2003 2004 2005 2006 2007<br />
0<br />
Germany Japan China Australia South Korea Taiwan New Zealand Singapore<br />
Iran Thailand Malaysia Indonesia Vietnam USA EU-27<br />
Figure 2: Absolute number of publications over time<br />
In Figure 3, data from 1992 are taken as 100 %. This allows us to measure the relative<br />
development of publications in the years that followed in relation to the first year of the analysis.<br />
Due to the fact that other countries began with a lower initial value, the growth of almost all of<br />
the countries was found to be higher than the growth of Germany. The exceptions to this are the<br />
USA and Japan, who generally exhibit a low publication development in terms of percent. The<br />
leading country with regard to relative publication growth is Iran: between 1992 (253<br />
publications) and 2007 (10,346 publications), Iran experienced a forty-fold growth.<br />
3 For example, see Mittermaier et al. 2006/2007: WissdeX – Das bdw-Wissenschaftsranking (Bild der<br />
Wissenschaft 03/2006 – 05/2007), http://epaper.konradin-relations.de/wissdex/<br />
2
Central Library<br />
High growth also characterises the relative development of the publication output in South<br />
Korea (thirteen-fold), and as mentioned above, China (around ten-fold).<br />
Percentage development of publications 1992 - 2007<br />
10000%<br />
1000%<br />
100%<br />
10%<br />
1992 1993 1994 1995 1996 1997 1998 1999 2000 2001 2002 2003 2004 2005 2006 2007<br />
USA EU-27 Germany Japan China Australia South Korea Taiwan<br />
New Zealand Singapore Iran Thailand Malaysia Indonesia Vietnam<br />
Figure 3: Relative number of publications over time (logarithmic scale)<br />
The table on the next page contains the absolute number of publications for each of the<br />
countries in the analysis.<br />
3
Central Library<br />
1992 1993 1994 1995 1996 1997 1998 1999 2000 2001 2002 2003 2004 2005 2006 2007 1992-2007<br />
Country Total<br />
USA 330980 353451 363715 378599 380672 381900 378514 385240 393702 387418 401149 416123 435187 444115 451429 449767 6331961<br />
EU-27 263716 281338 300717 328415 342591 362742 375829 381830 390277 382773 399391 408434 433758 452236 479751 501636 6085434<br />
Germany 53378 56281 59287 64792 69261 77389 80901 82041 83027 82584 85207 85769 91273 95113 99128 104068 1269499<br />
Japan 55533 59120 63322 67157 72172 75736 78514 80631 83762 82005 86393 90220 91295 90007 93450 89773 1259090<br />
China 9309 9811 10576 13611 15343 17418 20832 24969 31966 37438 42283 51833 63996 74959 91915 99270 615529<br />
Australia 18277 20035 21175 23032 24028 25308 26236 26758 27884 28363 29192 31370 33223 35137 38272 39758 448048<br />
South Korea 2613 3496 4441 6595 8124 10249 11898 13979 15327 17804 19728 23118 27289 29724 32699 33792 260876<br />
Taiwan 4493 5297 6466 7278 8283 8913 9622 10065 10713 11896 12691 14048 15794 17516 20072 21245 184392<br />
New Zealand 3666 3781 4123 4417 4600 4976 5271 5521 5469 5507 5570 5705 6259 6765 7196 7491 86317<br />
Singapore 1251 1541 1774 2194 2203 2686 2991 3616 4243 4614 5020 5721 6556 7237 7790 7756 67193<br />
Iran 253 335 390 488 611 733 1041 1181 1464 1794 2448 3283 4238 5573 7309 10346 41487<br />
Thailand 573 625 728 759 831 948 1179 1215 1420 1614 1957 2399 2520 3031 3811 4319 27929<br />
Malaysia 408 493 595 698 679 718 850 1012 953 1046 1085 1367 1509 1765 2085 2417 17680<br />
Indonesia 187 251 301 330 362 454 399 443 515 548 548 575 608 687 843 827 7878<br />
Vietnam 164 148 151 224 236 260 253 290 357 392 410 543 492 638 706 857 6121<br />
Total 691423 739722 778474 833797 860735 893041 913429 936750 968052 963212 1007865 1054739 1122724 1169390 1237328 1269254 15439935<br />
Table 1: Absolute number of publications for the countries studied<br />
4
Central Library<br />
Figures 4 – 8 present the previous results on publication activity in different forms. Figures 4<br />
and 5 present this information in terms of time: blocks of years are taken as the basis to show<br />
the development. This displays the development of the key countries and makes clear that the<br />
growth in publications in Europe and the USA is quite low in comparison.<br />
Number of total publications<br />
(logarithmic presentation)<br />
Number of publications per country<br />
10000000<br />
1000000<br />
100000<br />
10000<br />
1000<br />
100<br />
10<br />
1<br />
1992-1995 1996-1999 2000-2003 2004-2007<br />
USA EU-27 Germany Japan China Australia South Korea Taiwan<br />
New Zealand Singapore Iran Thailand Malaysia Indonesia Vietnam<br />
Figure 4: Number of total publications for the countries studied in the form of four-year blocks (logarithmic<br />
scale)<br />
Number of total publications 1992-2007<br />
(logarithmic presentation)<br />
Number of publications per country<br />
10000000<br />
1000000<br />
100000<br />
10000<br />
1000<br />
2953071<br />
2637178<br />
543330<br />
552185<br />
121869<br />
184849<br />
61395<br />
60417<br />
36355<br />
18256<br />
5032<br />
6858<br />
5453<br />
2727<br />
1726<br />
3378890<br />
3448256<br />
726169<br />
706905<br />
493660<br />
263199<br />
199481<br />
123975<br />
49962<br />
48937<br />
36455<br />
21071<br />
12227<br />
5151<br />
4395<br />
100<br />
10<br />
1<br />
1992-1999 2000-2007<br />
USA EU-27 Germany Japan China Australia South Korea Taiwan<br />
New Zealand Singapore Iran Thailand Malaysia Indonesia Vietnam<br />
Figure 5: Number of total publications for the countries studied in the form of eight-year blocks<br />
(logarithmic scale)<br />
5
Central Library<br />
Figures 6 to 8 show graphs of different combinations of the countries, and illustrate the<br />
development described from different perspectives. Figure 6 focuses on the smaller research<br />
nations, Figure 7 shows the most dynamic countries, and Figure 8 depicts all of the countries in<br />
comparison with Germany.<br />
Publications: <strong>Asia</strong>-<strong>Pacific</strong> research area excluding China, Japan and Australia<br />
Number of publications<br />
35000<br />
30000<br />
25000<br />
20000<br />
15000<br />
10000<br />
5000<br />
0<br />
1992 1993 1994 1995 1996 1997 1998 1999 2000 2001 2002 2003 2004 2005 2006 2007<br />
South Korea Taiwan New Zealand Singapore Iran Thailand Malaysia Indonesia Vietnam<br />
Figure 6: Number of publications over time (excluding China, Japan and Australia)<br />
Publications: A comparison of China, South Korea and Iran<br />
100000<br />
Number of publications Iran<br />
10000<br />
8000<br />
6000<br />
4000<br />
90000<br />
80000<br />
70000<br />
60000<br />
50000<br />
40000<br />
Number of publications China and South Korea<br />
30000<br />
2000<br />
20000<br />
10000<br />
0<br />
1992 1993 1994 1995 1996 1997 1998 1999 2000 2001 2002 2003 2004 2005 2006 2007<br />
Iran China South Korea<br />
0<br />
Figure 7: Number of publications over time (Iran, China and South Korea only)<br />
6
Central Library<br />
Publications <strong>Asia</strong>-<strong>Pacific</strong> research area compared to Germany<br />
Number of publications<br />
100000<br />
80000<br />
60000<br />
40000<br />
20000<br />
0<br />
1992 1993 1994 1995 1996 1997 1998 1999 2000 2001 2002 2003 2004 2005 2006 2007<br />
Germany Japan China Australia South Korea Taiwan New Zealand<br />
Singapore Iran Thailand Malaysia Indonesia Vietnam<br />
Figure 8: Number of publications over time (excluding EU-27 and USA)<br />
Figures 9 and 10 differentiate between all of the publications listed in the Web of Science (total<br />
publications) and what are known as research articles 4 . The distinction is only made for these<br />
two figures. All of the other graphs and charts, both before and after Figures 9 and 10, analyse<br />
the total number of publications.<br />
Total publications and research articles 1992-2007<br />
(logarithmic presentation)<br />
10,000,000<br />
Number of publications<br />
1,000,000<br />
100,000<br />
USA EU-27 Germany Australia China Japan <strong>Asia</strong>-<strong>Pacific</strong><br />
research area<br />
(excluding<br />
Australia, China<br />
and Japan)<br />
Total publications<br />
<strong>Research</strong> articles<br />
Figure 9: Number of total publications and research articles (logarithmic scale)<br />
4 <strong>Research</strong> articles represent the “pure form” of scientific publications: articles that are written for a<br />
scientific purpose only, with the aim of disseminating scientific findings. This term does not include<br />
editorials, letters, other forms of short communication or review articles.<br />
7
Central Library<br />
Figure 9 reveals that a significant proportion of the total publications in some countries consists<br />
of documents other than research articles – for example the USA, Australia and the EU-27. In<br />
the USA, this proportion of other document types amounts to more than one third. This quota is<br />
significantly lower for China and the countries of the <strong>Asia</strong>-<strong>Pacific</strong> research area. This difference<br />
can be explained by the fact that the editors and publishers of the majority of refereed journals<br />
in the Web of Science come from the countries within the EU-27 and, above all, from the USA.<br />
This also explains the higher proportion of editorial material.<br />
<strong>Research</strong> articles 1992-2007<br />
Number of reseach articles<br />
100000<br />
90000<br />
80000<br />
70000<br />
60000<br />
50000<br />
40000<br />
30000<br />
20000<br />
10000<br />
400000<br />
350000<br />
300000<br />
250000<br />
200000<br />
150000<br />
100000<br />
50000<br />
Number of reseach articles (USA and EU-27)<br />
0<br />
1992 1993 1994 1995 1996 1997 1998 1999 2000 2001 2002 2003 2004 2005 2006 2007<br />
0<br />
Germany Japan China Australia South Korea Taiwan New Zealand Singapore<br />
Iran Thailand Malaysia Indonesia Vietnam USA EU-27<br />
Figure 10: Number of research articles published over time<br />
The development over time of publication activity in the category of “research articles” is<br />
extremely similar to the development of the absolute number of publications (Figure 2) in that<br />
research articles also account for the largest proportion of total publications. A detailed<br />
comparison with Figure 2, however, reveals that the EU-27 had overtaken the USA in terms of<br />
the total number of articles 10 years earlier, in other words in 1995, when the assessment basis<br />
is research articles. This can be explained by a smaller proportion of research articles in terms<br />
of total publications in the USA than in the EU-27. It should also be noted that China overtook<br />
Germany in 2006 in terms of the total number of research articles for the very same reason.<br />
Figure 11 illustrates the development of the total number of records in the Science Citation<br />
Index (SCI) and how it underlies the evaluations that follow on the relative proportion of<br />
publications by a country in terms of the database as a whole. It should be noted that the data<br />
shown in Figures 11 – 13 only refer to SCI, the science edition of the Web of Science, in<br />
contrast to the other graphs and charts in Chapter 1 of this study.<br />
8
Central Library<br />
Total number of records in SCI 1992-2007<br />
SCI database 1992-2007: 15 951 504 publications<br />
Number of publications<br />
1400000<br />
1200000<br />
1000000<br />
800000<br />
600000<br />
400000<br />
200000<br />
0<br />
1992 1993 1994 1995 1996 1997 1998 1999 2000 2001 2002 2003 2004 2005 2006 2007<br />
Figure 11: Total number of records in the Science Citation Index (STM sector 5 ) over time 6<br />
Percentages in relation to total records in SCI database 1992-2007<br />
SCI database 1992-2007: 15 951 504 publications<br />
USA; 32.68%<br />
EU-27; 34.67%<br />
Japan; 7.79%<br />
Germany; 7.46%<br />
China; 3.78%<br />
Australia; 2.39%<br />
South Korea; 1.61%<br />
Taiwan; 1.12%<br />
New Zealand; 0.45%<br />
Singapore; 0.39%<br />
Iran; 0.26%<br />
Thailand; 0.17%<br />
Malaysia; 0.11%<br />
Indonesia; 0.05%<br />
Vietnam; 0.04%<br />
Figure 12: Percentages of publications by individual countries in the SCI database<br />
5 The term “STM sector” refers to publications in the scientific and technical disciplines as well as those in<br />
medicine.<br />
6 In contrast to the other evaluations, these data were not determined using the Web of Science accessed<br />
via SCI but rather using database access provided by STN International. The database and its contents<br />
can be considered identical; access was simply gained using a different technical route.<br />
9
Central Library<br />
Figure 12 shows that within the period under review 1992 – 2007 the proportion of publications<br />
by the EU-27 (34.5 %) and the USA (33.0 %) in the Science Citation Index are of a comparable<br />
level 7 . The same is true of Japan (7.8 %) and Germany (7.5 %). China is one of the five<br />
countries in the world with the highest proportion of publications in the Science Citation Index<br />
with approx. 3.8 % publications. However, compared to the EU-27 or the USA, this represents<br />
only one tenth.<br />
Proportion of publications in SCI by countries in relation to total records in SCI<br />
SCI database 1992-2007: 15 951 504 publications<br />
Percentage of SCI publications<br />
12%<br />
10%<br />
8%<br />
6%<br />
4%<br />
42%<br />
35%<br />
28%<br />
21%<br />
14%<br />
Percentage of SCI publications (USA and EU-27)<br />
2%<br />
7%<br />
0%<br />
1992 1993 1994 1995 1996 1997 1998 1999 2000 2001 2002 2003 2004 2005 2006 2007<br />
0%<br />
Germany Japan China Australia South Korea Taiwan New Zealand Singapore<br />
Iran Thailand Malaysia Indonesia Vietnam USA EU-27<br />
Figure 13: Proportion of countries in relation to total records in SCI<br />
Figure 13 illustrates the proportion of countries in relation to the total records in SCI over time. It<br />
is clear that the proportion from the USA is decreasing. In 1992, the USA contributed to more<br />
than 35 % of all of the documents listed in SCI, whereas in 2007, this figure had fallen to barely<br />
30 %. The EU-27 proportion remains very stable over the entire period. Remarkable gains were<br />
recorded for China: the proportion rose from around 1.5 % in 1992 to around 7.5 % in 2007. The<br />
other key countries in this study underwent almost no change in their total share in SCI with the<br />
exception of South Korea and Taiwan with small increases. Japan experienced a loss of 1.5 %<br />
in its share of publications in SCI.<br />
7 The values shown in Figure 12 include co-authorship of scientific publications for each country involved<br />
in a publication. This means that the summation of all of the values for each country represented in SCI<br />
will always be more than 100 %.<br />
10
Central Library<br />
1.2 Co-Publications on a Country Basis<br />
Figures 14 to 18 provide information on scientific co-publications between Germany or the USA<br />
and the other countries studied. A co-publication is defined as a scientific publication which<br />
includes address information (affiliation) for both Germany (or the USA) and the corresponding<br />
country (or countries). The corresponding publication is then counted once for each of the<br />
countries involved in the analyses that follow.<br />
If we take the absolute values into consideration, most of the co-publications from Germany’s<br />
perspective are written together with the USA. In 2007, they totalled more than 13,000. The<br />
relative increase in relation to the reference year of 1998 is fairly low at 66 %. In contrast to this,<br />
co-publications between Germany and China or South Korea tripled (see Figure 15(a)). Some of<br />
the other countries achieved significantly higher growth rates, but in all of these cases, the<br />
reference data from 1998 were relatively small. For example, co-publications between Germany<br />
and Malaysia increased eighteen-fold, but they began with a mere four joint publications in 1998<br />
(Figure 15(b)).<br />
Co-publications Germany 1998-2007<br />
Number of co-publications<br />
1000<br />
900<br />
800<br />
700<br />
600<br />
500<br />
400<br />
300<br />
200<br />
2000<br />
1500<br />
1000<br />
500<br />
Number of co-publications (Australia, China and Japan)<br />
100<br />
0<br />
1998 1999 2000 2001 2002 2003 2004 2005 2006 2007<br />
New Zealand Taiwan South Korea Singapore Indonesia Thailand Vietnam<br />
Malaysia Iran Australia China Japan<br />
0<br />
Figure 14: Development of co-publications from Germany’s perspective (excluding USA)<br />
Figures 16 and 17 present the same aspect from the USA’s perspective. We can see that over<br />
time, China pushes back other important co-publication partners, such as Japan, Australia and<br />
South Korea. This is the only significant change revealed by Figure 16. This development is<br />
closely related to the almost exponential publication development in China in general.<br />
From Figure 17, we can see that the number of co-publications in the period 1998 to 2007 has<br />
increased fivefold. It real terms, this represents an increase on a high level from 1,754 to 8,971<br />
publications. The often high growth rates for co-publications with Vietnam or Iran are once again<br />
based on relatively low reference data in 1998.<br />
11
Central Library<br />
Development of co-publications by Germany with …<br />
1998 = 100 %<br />
500%<br />
400%<br />
300%<br />
200%<br />
100%<br />
0%<br />
1998 1999 2000 2001 2002 2003 2004 2005 2006 2007<br />
New Zealand Australia Taiwan China South Korea Japan Indonesia Thailand Vietnam USA<br />
Figure 15(a): Relative development of co-publications from Germany’s perspective with respect to 1998<br />
(all of the key countries except Singapore, Malaysia and Iran)<br />
Development of co-publications by Germany with …<br />
1998 = 100 %<br />
2000%<br />
1800%<br />
1600%<br />
1400%<br />
1200%<br />
1000%<br />
800%<br />
600%<br />
400%<br />
200%<br />
0%<br />
1998 1999 2000 2001 2002 2003 2004 2005 2006 2007<br />
Singapore Malaysia Iran<br />
Figure 15(b): Relative development of co-publications from Germany’s perspective with respect to 1998<br />
(Singapore, Malaysia and Iran)<br />
12
Central Library<br />
Co-publications USA 1998-2007<br />
Number of co-publications<br />
6000<br />
5000<br />
4000<br />
3000<br />
9000<br />
7500<br />
6000<br />
4500<br />
Number of co-publications<br />
(Australia, China, South Korea, Japan)<br />
2000<br />
3000<br />
1000<br />
1500<br />
0<br />
1998 1999 2000 2001 2002 2003 2004 2005 2006 2007<br />
New Zealand Taiwan Singapore Indonesia Thailand Vietnam Malaysia<br />
Iran Australia China South Korea Japan<br />
0<br />
Figure 16: Development of co-publications with the key countries from the USA’s perspective<br />
700%<br />
Development of co-publications by USA with ...<br />
1998 = 100 %<br />
600%<br />
500%<br />
400%<br />
300%<br />
200%<br />
100%<br />
0%<br />
1998 1999 2000 2001 2002 2003 2004 2005 2006 2007<br />
New Zealand Australia Taiwan China South Korea Japan Singapore<br />
Indonesia Thailand Vietnam Malaysia Iran<br />
Figure 17: Relative development of co-publications with the key countries from the USA’s perspective<br />
with respect to 1998<br />
13
Central Library<br />
Co-publications by Germany with…<br />
New Zealand Australia Taiwan China South Korea Japan Singapore Indonesia Thailand Vietnam Malaysia Iran USA<br />
1998 125 669 122 453 197 1314 25 34 28 20 4 17 7991<br />
1999 134 671 109 483 185 1376 46 25 29 33 16 15 8729<br />
2000 154 768 135 584 232 1481 54 31 29 26 10 21 9076<br />
2001 141 852 154 690 241 1477 60 30 30 21 14 29 9553<br />
2002 145 905 182 754 337 1635 60 38 43 20 24 35 10461<br />
2003 160 997 144 877 317 1677 96 45 48 33 16 55 10628<br />
2004 226 1212 199 960 350 1832 118 48 71 29 40 74 11556<br />
2005 244 1276 245 1015 435 1777 159 52 90 36 36 110 12241<br />
2006 286 1450 254 1167 487 1936 168 45 88 52 40 131 12769<br />
2007 295 1617 276 1265 585 2009 210 48 142 45 69 169 13302<br />
Total 1910 10417 1820 8248 3366 16514 996 396 598 315 269 656 106306<br />
Table 2: Number of co-publications by Germany with the target countries and the USA<br />
Co-publications by the USA with…<br />
New Zealand Australia Taiwan China South Korea Japan Singapore Indonesia Thailand Vietnam Malaysia Iran<br />
1998 614 2715 1048 1754 1735 6062 278 87 215 22 54 76<br />
1999 634 2847 1119 1963 1913 6155 384 81 221 33 59 74<br />
2000 664 3077 1247 2826 2130 6800 402 107 269 38 64 75<br />
2001 693 3438 1335 3339 2443 6963 492 115 326 49 64 125<br />
2002 780 3738 1432 3852 2693 7359 584 101 408 56 77 148<br />
2003 856 3840 1485 4660 3250 7813 756 103 505 67 86 207<br />
2004 913 4325 1673 5550 3511 7896 831 109 570 73 99 209<br />
2005 977 4498 1935 6551 4066 7799 949 125 675 90 100 243<br />
2006 1057 4975 2013 7842 4350 8127 1121 159 779 113 135 300<br />
2007 1167 5215 2311 8971 4599 8151 1185 148 870 100 178 470<br />
Total 8355 38668 15598 47308 30690 73125 6982 1135 4838 641 916 1927<br />
Table 3: Number of co-publications by the USA with the target countries<br />
14
Central Library<br />
1.3 Co-Publications on a Country Basis between the Countries Studied<br />
Figures 18 to 34 deal with the co-publication output between the countries studied. Similar to<br />
the total publication output, the tendency towards international cooperation also experiences a<br />
general increase. Figure 18 illustrates the number of co-publications between the countries<br />
studied for the entire period 1998 – 2007. Countries with a high volume of publications in<br />
absolute terms also tend to have a high absolute number of co-publications.<br />
Co-publications per country 1998-2007<br />
20000<br />
18000<br />
Australia<br />
Taiwan<br />
16000<br />
14000<br />
China<br />
South Korea<br />
Japan<br />
12000<br />
10000<br />
Singapore<br />
Indonesia<br />
Thailand<br />
Vietnam<br />
Malaysia<br />
Iran<br />
8000<br />
6000<br />
4000<br />
2000<br />
0<br />
New Zealand<br />
Australia<br />
Taiwan<br />
China<br />
South Korea<br />
Japan<br />
Singapore<br />
Indonesia<br />
Thailand<br />
Vietnam<br />
Malaysia<br />
Iran<br />
New Zealand<br />
Australia<br />
Taiwan<br />
China<br />
South Korea<br />
Japan<br />
Singapore<br />
Indonesia<br />
Thailand<br />
Vietnam<br />
Malaysia<br />
Iran<br />
Figure 18: Number of co-publications per country for the period 1998-2007<br />
In Figures 19 and 20, the data shown in Figure 18 for the entire period under review are split<br />
into two equally long periods of five years each in order to make the development over time<br />
clearer. For example, this allows us to determine an above-average increase in the number of<br />
co-publications between Singapore and China and between Australia and Japan.<br />
15
Central Library<br />
Co-publications per country 1998-2002<br />
14000<br />
12000<br />
Australia<br />
Taiwan<br />
10000<br />
China<br />
South Korea<br />
8000<br />
Japan<br />
Singapore<br />
6000<br />
Indonesia<br />
Thailand<br />
Vietnam<br />
Malaysia<br />
Iran<br />
4000<br />
2000<br />
0<br />
New Zealand<br />
Australia<br />
Taiwan<br />
China<br />
South Korea<br />
Japan<br />
Singapore<br />
Indonesia<br />
Thailand<br />
Vietnam<br />
Malaysia<br />
Iran<br />
New Zealand<br />
Australia<br />
Taiwan<br />
China<br />
South Korea<br />
Japan<br />
Singapore<br />
Indonesia<br />
Thailand<br />
Vietnam<br />
Malaysia<br />
Iran<br />
Figure 19: Number of co-publications per country for the period 1998-2002<br />
Co-publications per country 2003-2007<br />
14000<br />
12000<br />
Australia<br />
Taiwan<br />
10000<br />
China<br />
South Korea<br />
8000<br />
Japan<br />
Singapore<br />
6000<br />
Indonesia<br />
Thailand<br />
Vietnam<br />
Malaysia<br />
Iran<br />
4000<br />
2000<br />
0<br />
New Zealand<br />
Australia<br />
Taiwan<br />
China<br />
South Korea<br />
Japan<br />
Singapore<br />
Indonesia<br />
Thailand<br />
Vietnam<br />
Malaysia<br />
Iran<br />
New Zealand<br />
Australia<br />
Taiwan<br />
China<br />
South Korea<br />
Japan<br />
Singapore<br />
Indonesia<br />
Thailand<br />
Vietnam<br />
Malaysia<br />
Iran<br />
Figure 20: Number of co-publications per country for the period 2003-2007<br />
16
Central Library<br />
Co-publications in the target countries with each other<br />
(1998-2007 total; logarithmic presentation)<br />
100000<br />
New Zealand<br />
Iran<br />
Australia<br />
10000<br />
1000<br />
Malaysia<br />
Taiwan<br />
100<br />
Vietnam<br />
10<br />
1<br />
China<br />
China<br />
South Korea<br />
Japan<br />
Singapore<br />
Australia<br />
New Zealand<br />
Thailand<br />
South Korea<br />
Indonesia<br />
Japan<br />
Singapore<br />
Figure 21: Number of co-publications per country for the period 1998-2007<br />
The spider charts in Figures 21 and 22 also display the total number of co-publications for the<br />
countries studied, as did Figure 18. It should be noted that a logarithmic scale was used in the<br />
spider charts. Due to the large number of countries involved and the huge differences between<br />
them, we split them between two diagrams in order to provide a better overview.<br />
Co-publications in the target countries with each other<br />
(1998-2007 total; logarithmic presentation)<br />
New Zealand<br />
10000<br />
Iran<br />
Australia<br />
1000<br />
Malaysia<br />
100<br />
Taiwan<br />
Vietnam<br />
10<br />
1<br />
China<br />
Taiwan<br />
Indonesia<br />
Thailand<br />
Vietnam<br />
Malaysia<br />
Iran<br />
Thailand<br />
South Korea<br />
Indonesia<br />
Japan<br />
Singapore<br />
Figure 22: Number of co-publications per country for the period 1998-2007<br />
17
Central Library<br />
Figures 23 – 34 illustrate the co-publication activity of the countries with each other over time.<br />
The EU-27 serves as a benchmark. By presenting the data in this manner, we can see how<br />
scientific cooperations with the other countries studied have developed from each country’s<br />
perspective. In general, the more a country publishes, the more it cooperates on an international<br />
level.<br />
Co-publications Australia 1998-2007<br />
Number of co-publications<br />
1800<br />
1600<br />
1400<br />
1200<br />
1000<br />
800<br />
12000<br />
10000<br />
8000<br />
6000<br />
Number of co-publications (EU-27)<br />
600<br />
4000<br />
400<br />
200<br />
2000<br />
0<br />
1998 1999 2000 2001 2002 2003 2004 2005 2006 2007<br />
New Zealand Taiwan China South Korea Japan Singapore<br />
Indonesia Thailand Vietnam Malaysia Iran EU-27<br />
Figure 23: Co-publications by Australia over time; the most important cooperation partners are China,<br />
Japan and New Zealand.<br />
Co-publications China 1998-2007<br />
0<br />
Number of co-publications<br />
3000<br />
2500<br />
2000<br />
1500<br />
7000<br />
6000<br />
5000<br />
4000<br />
3000<br />
Number of co-publications (EU-27)<br />
1000<br />
2000<br />
500<br />
1000<br />
0<br />
1998 1999 2000 2001 2002 2003 2004 2005 2006 2007<br />
New Zealand Australia Taiwan South Korea Japan Singapore<br />
Indonesia Thailand Vietnam Malaysia Iran EU-27<br />
0<br />
Figure 24: Co-publications by China over time; the most important cooperation partners are Japan,<br />
Australia, Singapore and South Korea.<br />
18
Central Library<br />
Co-publications South Korea 1998-2007<br />
Number of co-publications<br />
800<br />
700<br />
600<br />
500<br />
400<br />
300<br />
200<br />
1600<br />
1400<br />
1200<br />
1000<br />
800<br />
600<br />
400<br />
Number of co-publications (Japan, China and EU-27)<br />
100<br />
200<br />
0<br />
1998 1999 2000 2001 2002 2003 2004 2005 2006 2007<br />
New Zealand Australia Taiwan Singapore Indonesia Thailand<br />
Vietnam Malaysia Iran China Japan EU-27<br />
Figure 25: Co-publications by South Korea over time; the most important cooperation partners are Japan<br />
and China.<br />
0<br />
Co-publications Japan 1998-2007<br />
Number of co-publications<br />
3500<br />
3000<br />
2500<br />
2000<br />
7000<br />
6000<br />
5000<br />
4000<br />
Number of co-publications (EU-27)<br />
1500<br />
3000<br />
1000<br />
2000<br />
500<br />
1000<br />
0<br />
1998 1999 2000 2001 2002 2003 2004 2005 2006 2007<br />
New Zealand Australia Taiwan China South Korea Singapore<br />
Indonesia Thailand Vietnam Malaysia Iran EU-27<br />
Figure 26: Co-publications by Japan over time; the most important cooperation partners are China, South<br />
Korea and Australia.<br />
0<br />
19
Central Library<br />
Co-publications Taiwan 1998-2007<br />
Number of co-publications<br />
350<br />
300<br />
250<br />
200<br />
150<br />
100<br />
900<br />
800<br />
700<br />
600<br />
500<br />
400<br />
300<br />
Number of co-publications (China, Japan and EU-27)<br />
200<br />
50<br />
100<br />
0<br />
1998 1999 2000 2001 2002 2003 2004 2005 2006 2007<br />
New Zealand Australia South Korea Singapore Indonesia Thailand<br />
Vietnam Malaysia Iran China Japan EU-27<br />
Figure 27: Co-publications by Taiwan over time; the most important cooperation partners are China and<br />
Japan.<br />
0<br />
Co-publications Singapore 1998-2007<br />
Number of co-publications<br />
600<br />
550<br />
500<br />
450<br />
400<br />
350<br />
300<br />
250<br />
200<br />
150<br />
100<br />
50<br />
1000<br />
900<br />
800<br />
700<br />
600<br />
500<br />
400<br />
300<br />
200<br />
100<br />
Number of co-publications (China and EU-27)<br />
0<br />
1998 1999 2000 2001 2002 2003 2004 2005 2006 2007<br />
New Zealand Australia Taiwan South Korea Japan Indonesia<br />
Thailand Vietnam Malaysia Iran China EU-27<br />
Figure 28: Co-publications by Singapore over time; the most important cooperation partner is China.<br />
0<br />
20
Central Library<br />
Co-publications Indonesia 1998-2007<br />
Number of co-publications<br />
300<br />
250<br />
200<br />
150<br />
100<br />
50<br />
0<br />
1998 1999 2000 2001 2002 2003 2004 2005 2006 2007<br />
New Zealand Australia Taiwan China South Korea Japan<br />
Singapore Thailand Vietnam Malaysia Iran EU-27<br />
Figure 29: Co-publications by Indonesia over time; the most important cooperation partners are Japan<br />
and Australia.<br />
Co-publications Thailand 1998-2007<br />
Number of co-publications<br />
300<br />
250<br />
200<br />
150<br />
750<br />
500<br />
Number of co-publications (Japan and EU-27)<br />
100<br />
250<br />
50<br />
0<br />
1998 1999 2000 2001 2002 2003 2004 2005 2006 2007<br />
New Zealand Australia Taiwan China South Korea Singapore<br />
Indonesia Vietnam Malaysia Iran Japan EU-27<br />
Figure 30: Co-publications by Thailand over time; the most important cooperation partners are Japan,<br />
Australia and China.<br />
0<br />
21
Central Library<br />
Co-publications Vietnam 1998-2007<br />
Number of co-publications<br />
120<br />
100<br />
80<br />
60<br />
300<br />
250<br />
200<br />
150<br />
Number of co-publications (EU-27)<br />
40<br />
100<br />
20<br />
50<br />
0<br />
1998 1999 2000 2001 2002 2003 2004 2005 2006 2007<br />
New Zealand Australia Taiwan China South Korea Japan<br />
Singapore Indonesia Thailand Malaysia Iran EU-27<br />
Figure 31: Co-publications by Vietnam over time; the most important cooperation partners are Japan,<br />
Australia, Thailand and China. South Korea has experienced a strong increase over the last five years.<br />
0<br />
Co-publications Malaysia 1998-2007<br />
Number of co-publications<br />
200<br />
160<br />
120<br />
350<br />
300<br />
250<br />
200<br />
Number of co-publications (EU-27)<br />
80<br />
150<br />
100<br />
40<br />
50<br />
0<br />
1998 1999 2000 2001 2002 2003 2004 2005 2006 2007<br />
New Zealand Australia Taiwan China South Korea Japan<br />
Singapore Indonesia Thailand Vietnam Iran EU-27<br />
Figure 32: Co-publications by Malaysia over time; the most important cooperation partners are China,<br />
Japan, Australia, Thailand and Singapore.<br />
0<br />
22
Central Library<br />
Co-publications Iran 1998-2007<br />
Number of co-publications<br />
150<br />
125<br />
100<br />
75<br />
1000<br />
900<br />
800<br />
700<br />
600<br />
500<br />
Number of co-publications (EU-27)<br />
50<br />
400<br />
300<br />
25<br />
200<br />
100<br />
0<br />
1998 1999 2000 2001 2002 2003 2004 2005 2006 2007<br />
0<br />
New Zealand Australia Taiwan China South Korea Japan<br />
Singapore Indonesia Thailand Vietnam Malaysia EU-27<br />
Figure 33: Co-publications by Iran over time; the most important cooperation partners are Australia and<br />
Japan.<br />
Co-publications New Zealand 1998-2007<br />
Number of co-publications<br />
250<br />
200<br />
150<br />
100<br />
1800<br />
1600<br />
1400<br />
1200<br />
1000<br />
800<br />
600<br />
Number of co-publications (Australia and EU-27)<br />
50<br />
400<br />
200<br />
0<br />
1998 1999 2000 2001 2002 2003 2004 2005 2006 2007<br />
Taiwan China South Korea Japan Singapore Indonesia<br />
Thailand Vietnam Malaysia Iran Australia EU-27<br />
Figure 34: Co-publications by New Zealand over time; the most important cooperation partner is<br />
Australia.<br />
0<br />
23
Central Library<br />
Co-publications by the countries studied with each other<br />
New Zealand<br />
Australia<br />
Taiwan<br />
China<br />
South Korea<br />
Japan<br />
Singapore<br />
Indonesia<br />
Thailand<br />
Vietnam<br />
Malaysia<br />
Iran<br />
New<br />
Zealand<br />
2451<br />
48<br />
289<br />
61<br />
482<br />
122<br />
23<br />
34<br />
22<br />
11<br />
2<br />
Australia<br />
2451<br />
395<br />
2242<br />
402<br />
2739<br />
778<br />
357<br />
366<br />
99<br />
200<br />
168<br />
Taiwan<br />
48<br />
395<br />
1219<br />
484<br />
1168<br />
217<br />
17<br />
59<br />
21<br />
26<br />
24<br />
China<br />
289<br />
2242<br />
1219<br />
1302<br />
6163<br />
1402<br />
39<br />
183<br />
37<br />
332<br />
17<br />
South Korea<br />
61<br />
402<br />
484<br />
1302<br />
3786<br />
90<br />
15<br />
61<br />
36<br />
37<br />
8<br />
Japan<br />
482<br />
2739<br />
1168<br />
6163<br />
3786<br />
420<br />
457<br />
902<br />
195<br />
263<br />
85<br />
Singapore<br />
122<br />
778<br />
217<br />
1402<br />
90<br />
420<br />
43<br />
57<br />
17<br />
130<br />
4<br />
Indonesia<br />
23<br />
357<br />
17<br />
39<br />
15<br />
457<br />
43<br />
66<br />
32<br />
64<br />
1<br />
Thailand<br />
34<br />
366<br />
59<br />
183<br />
61<br />
902<br />
57<br />
66<br />
69<br />
158<br />
2<br />
Vietnam<br />
99<br />
21<br />
37<br />
36<br />
195<br />
17<br />
32<br />
69<br />
12<br />
1<br />
2<br />
Malaysia<br />
22<br />
200<br />
26<br />
332<br />
37<br />
263<br />
130<br />
64<br />
158<br />
12<br />
16<br />
Iran<br />
11<br />
168<br />
24<br />
17<br />
85<br />
16<br />
2<br />
1<br />
4<br />
1<br />
8<br />
Table 4: Total co-publications 1998-2002. In each column, the largest number is written in blue. Japan is most<br />
frequently the most important cooperation partner (for six countries), followed by China (four times) and Australia<br />
(twice).<br />
New Zealand<br />
Australia<br />
Taiwan<br />
China<br />
South Korea<br />
Japan<br />
Singapore<br />
Indonesia<br />
Thailand<br />
Vietnam<br />
Malaysia<br />
Iran<br />
New<br />
Zealand<br />
3734<br />
102<br />
659<br />
207<br />
586<br />
253<br />
38<br />
136<br />
12<br />
86<br />
45<br />
Australia<br />
3734<br />
790<br />
6025<br />
1092<br />
3759<br />
1583<br />
465<br />
867<br />
205<br />
390<br />
434<br />
Taiwan<br />
102<br />
790<br />
2709<br />
998<br />
2529<br />
499<br />
47<br />
191<br />
54<br />
98<br />
43<br />
China<br />
659<br />
6025<br />
2709<br />
3756<br />
12316<br />
4039<br />
127<br />
514<br />
149<br />
825<br />
136<br />
South Korea<br />
207<br />
1092<br />
998<br />
3756<br />
6941<br />
324<br />
169<br />
272<br />
268<br />
136<br />
66<br />
Japan<br />
586<br />
3759<br />
2529<br />
12316<br />
6941<br />
752<br />
880<br />
1931<br />
505<br />
551<br />
311<br />
Singapore<br />
253<br />
1583<br />
499<br />
4039<br />
324<br />
752<br />
76<br />
185<br />
48<br />
316<br />
8<br />
Indonesia<br />
38<br />
465<br />
47<br />
127<br />
169<br />
880<br />
76<br />
205<br />
59<br />
151<br />
3<br />
Thailand<br />
136<br />
867<br />
191<br />
514<br />
272<br />
1931<br />
185<br />
205<br />
166<br />
292<br />
18<br />
Vietnam<br />
12<br />
205<br />
54<br />
149<br />
268<br />
505<br />
48<br />
59<br />
166<br />
50<br />
5<br />
Malaysia<br />
86<br />
390<br />
98<br />
825<br />
136<br />
551<br />
316<br />
151<br />
292<br />
50<br />
94<br />
Iran<br />
45<br />
434<br />
43<br />
136<br />
66<br />
311<br />
18<br />
94<br />
8<br />
3<br />
5<br />
Table 5: Total co-publications 2003-2007. In each column, the largest number is written in red and – where it is<br />
different – the largest value from Table 4 is written in blue. The priorities of the cooperations are generally the<br />
same. The only difference is that China is now the most important cooperation partner for Australia in this table of<br />
countries (1998 to 2002: Japan).<br />
24
Central Library<br />
2. Publication <strong>Analysis</strong> Based on <strong>Research</strong> Disciplines<br />
2.1 Publication Activity of Selected Countries<br />
In Chapter 2, we will no longer look at the nations as whole entities as we did in the previous<br />
chapter. Instead, we will split the scientific publication output into individual disciplines 8 . The<br />
disciplines are based on the classification of journals in the Science Citation Index on the basis<br />
of what it has termed “subject categories”. Therefore, classification does not occur on the basis<br />
of the content of each article, but rather on the basis of the publishing journal. A journal does<br />
not have to be assigned to one single subject category; it can be assigned multiple categories.<br />
The approximately 6,400 scientific journals in the Science Citation Index are assigned to around<br />
170 subject categories.<br />
The following evaluations use the disciplines as a basis and assume that thematically similar<br />
categories are covered by the one discipline. Figures 35 to 38 illustrate the absolute number of<br />
articles per discipline for the period 1998 to 2007. It is not possible to add the values of<br />
individual disciplines for each country in the charts or tables that follow. As a result of multiple<br />
classifications, there are overlaps between the disciplines that disallow a summation. For<br />
example, publications in the journal “Chemical Physics – Physical Chemistry” are assigned to<br />
both chemistry and physics, and would therefore be counted twice in a summation. From the<br />
charts, we can see the key disciplines in which each country publishes, taking into account the<br />
fact that the Science Citation Index has a different focus in terms of disciplines covered.<br />
Publications by country according to research discipline 1998-2007<br />
Multidisciplinary journals<br />
350000<br />
Physics<br />
300000<br />
Agricultural science<br />
250000<br />
Nanotechnology<br />
200000<br />
Biology and biotechnology<br />
150000<br />
100000<br />
Medicine<br />
50000<br />
0<br />
Chemistry<br />
Japan<br />
China<br />
Mathematics<br />
Energy<br />
Materials science<br />
Geosciences<br />
Engineering<br />
Information and computer science<br />
Figure 35: Publications by the countries studied 1998 – 2007 according to research discipline<br />
8 The disciplines are: agricultural science, biology and biotechnology, chemistry, energy, geosciences,<br />
information and computer science, engineering, materials science, mathematics, medicine,<br />
nanotechnology, physics and multidisciplinary journals. Multidisciplinary journals include journals such as<br />
Science and Nature.<br />
25
Central Library<br />
Publications by country according to research discipline 1998-2007<br />
Multidisciplinary journals<br />
140000<br />
Physics<br />
120000<br />
Agricultural science<br />
100000<br />
Nanotechnology<br />
80000<br />
Biology and biotechnology<br />
60000<br />
40000<br />
Medicine<br />
20000<br />
0<br />
Chemistry<br />
Australia<br />
South Korea<br />
Taiwan<br />
Mathematics<br />
Energy<br />
Materials science<br />
Geosciences<br />
Engineering<br />
Information and computer science<br />
Figure 36: Publications by the countries studied 1998 – 2007 according to research discipline<br />
Nanotechnology<br />
Medicine<br />
Publications by country according to research discipline 1998-2007<br />
Physics<br />
Multidisciplinary journals<br />
22000<br />
20000<br />
18000<br />
16000<br />
14000<br />
12000<br />
10000<br />
8000<br />
6000<br />
4000<br />
2000<br />
0<br />
Agricultural science<br />
Biology and biotechnology<br />
Chemistry<br />
New Zealand<br />
Iran<br />
Singapore<br />
Mathematics<br />
Energy<br />
Materials science<br />
Geosciences<br />
Engineering<br />
Information and computer science<br />
Figure 37: Publications by the countries studied 1998 – 2007 according to research discipline<br />
26
Central Library<br />
Publications by country according to research discipline 1998-2007<br />
Multidisciplinary journals<br />
11000<br />
Physics<br />
10000<br />
9000<br />
8000<br />
Agricultural science<br />
Nanotechnology<br />
7000<br />
6000<br />
Biology and biotechnology<br />
5000<br />
4000<br />
3000<br />
Medicine<br />
2000<br />
1000<br />
0<br />
Chemistry<br />
Thailand<br />
Malaysia<br />
Vietnam<br />
Indonesia<br />
Mathematics<br />
Energy<br />
Materials science<br />
Geosciences<br />
Engineering<br />
Information and computer science<br />
Figure 38: Publications by the countries studied 1998 – 2007 according to research discipline<br />
Approximately one third of all articles in the Science Citation Index come from medicine. This is<br />
the reason why medicine is the field with the highest number of publications in many but not all<br />
of the countries, as shown in Figures 35 to 38. In China, for example, physics and chemistry<br />
represent a significantly higher proportion of the total number of publications compared to<br />
medicine. The same is true of engineering in Singapore, which is much more strongly<br />
pronounced than medicine, and of chemistry in Iran.<br />
The next page provides a summary of the absolute number of publications by each country per<br />
discipline for the entire period under review here.<br />
27
Central Library<br />
Number of publications according to<br />
discipline<br />
Multidisciplinary journals<br />
Agricultural science<br />
Biology and biotechnology<br />
Chemistry<br />
Energy<br />
Geosciences<br />
Information and computer science<br />
Engineering<br />
Materials science<br />
Mathematics<br />
Medicine<br />
Nanotechnology<br />
Physics<br />
Total<br />
Germany<br />
8242<br />
19571<br />
134364<br />
105552<br />
13914<br />
45389<br />
26745<br />
61664<br />
48258<br />
25529<br />
370187<br />
6110<br />
149494<br />
1015019<br />
China<br />
9178<br />
9418<br />
57819<br />
138332<br />
7432<br />
33861<br />
25954<br />
83193<br />
77351<br />
33460<br />
79567<br />
7107<br />
118574<br />
681246<br />
Japan<br />
5755<br />
30932<br />
146100<br />
138083<br />
16745<br />
32526<br />
19669<br />
94708<br />
71677<br />
15467<br />
334060<br />
7320<br />
152617<br />
1065659<br />
New Zealand<br />
689<br />
5648<br />
12901<br />
3720<br />
392<br />
7668<br />
1889<br />
3381<br />
1591<br />
1636<br />
21388<br />
151<br />
3049<br />
64103<br />
Australia<br />
2923<br />
15919<br />
57112<br />
19494<br />
2616<br />
28960<br />
10284<br />
22855<br />
9445<br />
8070<br />
130479<br />
995<br />
24623<br />
333775<br />
Taiwan<br />
548<br />
4045<br />
14949<br />
20199<br />
1657<br />
8077<br />
10679<br />
33501<br />
13183<br />
5646<br />
42717<br />
2285<br />
27219<br />
184705<br />
South Korea<br />
688<br />
6367<br />
30763<br />
38858<br />
3772<br />
8513<br />
14285<br />
41908<br />
27507<br />
6205<br />
60263<br />
3631<br />
44921<br />
287681<br />
Singapore<br />
268<br />
442<br />
6124<br />
6596<br />
525<br />
2432<br />
5360<br />
15265<br />
6640<br />
2439<br />
13307<br />
1322<br />
11048<br />
71768<br />
Indonesia<br />
71<br />
811<br />
1599<br />
579<br />
119<br />
944<br />
78<br />
469<br />
260<br />
72<br />
1831<br />
417<br />
7258<br />
8<br />
Thailand<br />
118<br />
2089<br />
5367<br />
3470<br />
489<br />
1591<br />
679<br />
2722<br />
1312<br />
287<br />
10388<br />
92<br />
1410<br />
30014<br />
Vietnam<br />
41<br />
490<br />
934<br />
493<br />
63<br />
416<br />
124<br />
261<br />
268<br />
565<br />
1589<br />
10<br />
833<br />
6087<br />
Malaysia<br />
89<br />
1260<br />
2192<br />
2430<br />
372<br />
964<br />
584<br />
2257<br />
2612<br />
321<br />
3423<br />
64<br />
1270<br />
17838<br />
Iran<br />
558<br />
2029<br />
3874<br />
10987<br />
713<br />
1875<br />
1234<br />
5939<br />
2366<br />
2345<br />
10677<br />
237<br />
4877<br />
47711<br />
Table 6: Number of publications by a country in a discipline. The largest number in a column is written in blue; the second-highest in red. This<br />
colour-code makes it clear in which discipline a country is most active. It also reveals that medicine is not the main field of scientific publication in<br />
China, Singapore and Iran as it is in the other countries studied.<br />
28
Central Library<br />
Publications by country according to research discipline 1998-2007<br />
(each discipline = 100 %)<br />
35%<br />
China<br />
Iran<br />
30%<br />
Japan<br />
25%<br />
Multidisciplinary journals<br />
Malaysia<br />
20%<br />
15%<br />
New Zealand<br />
Agricultural science<br />
10%<br />
5%<br />
Energy<br />
Vietnam<br />
0%<br />
Australia<br />
Materials science<br />
Mathematics<br />
Thailand<br />
Taiwan<br />
Medicine<br />
Indonesia<br />
South Korea<br />
Singapore<br />
Figure 39: Publications by the countries studied in the disciplines of agricultural science, energy,<br />
materials science, mathematics, medicine and the multidisciplinary journals<br />
Publications by country according to research discipline 1998-2007<br />
(each discipline = 100 %)<br />
China<br />
35%<br />
Iran<br />
30%<br />
Japan<br />
25%<br />
Biology and<br />
biotechnology<br />
Malaysia<br />
20%<br />
New Zealand<br />
Chemistry<br />
15%<br />
10%<br />
Geosciences<br />
Vietnam<br />
5%<br />
0%<br />
Australia<br />
Information and<br />
computer science<br />
Engineering<br />
Nanotechnology<br />
Thailand<br />
Taiwan<br />
Physics<br />
Indonesia<br />
South Korea<br />
Singapore<br />
Figure 40: Publications by the countries studied in the disciplines of biology and biotechnology, chemistry,<br />
geosciences, information and computer science, engineering, nanotechnology and physics<br />
Figures 39 and 40 reveal those countries that attain a certain level of activity in the individual<br />
disciplines. The output of all of the countries analysed in each discipline is taken here as 100 %.<br />
This allows us to determine, for example, that Japan is responsible for around 30 % of the<br />
29
Central Library<br />
publications in biology and biotechnology, while China produces around 30 % of the<br />
publications evaluated for chemistry and mathematics.<br />
Publications by country according to research discipline 1998-2007<br />
(each country = 100 %)<br />
Multidisciplinary journals<br />
40%<br />
Physics<br />
35%<br />
Agricultural science<br />
30%<br />
Nanotechnology<br />
25%<br />
Biology and biotechnology<br />
20%<br />
15%<br />
10%<br />
Medicine<br />
5%<br />
0%<br />
Chemistry<br />
Germany<br />
Japan<br />
Vietnam<br />
Indonesia<br />
Mathematics<br />
Energy<br />
Materials science<br />
Geosciences<br />
Engineering<br />
Information and computer science<br />
Figure 41: Publications by Germany, Japan, Vietnam and Indonesia according to research discipline<br />
Publications by country according to research discipline 1998-2007<br />
(each country = 100 %)<br />
Multidisciplinary journals<br />
40%<br />
Physics<br />
35%<br />
Agricultural science<br />
30%<br />
Nanotechnology<br />
25%<br />
Biology and biotechnology<br />
20%<br />
15%<br />
10%<br />
Medicine<br />
5%<br />
0%<br />
Chemistry<br />
Australia<br />
Thailand<br />
New Zealand<br />
Singapore<br />
Mathematics<br />
Energy<br />
Materials science<br />
Geosciences<br />
Engineering<br />
Information and computer science<br />
Figure 42: Publications by Australia, Thailand, New Zealand and Singapore according to research<br />
discipline<br />
30
Central Library<br />
Publications by country according to research discipline 1998-2007<br />
(each country = 100 %)<br />
Multidisciplinary journals<br />
25%<br />
Physics<br />
Agricultural science<br />
20%<br />
Nanotechnology<br />
15%<br />
Biology and biotechnology<br />
10%<br />
Medicine<br />
5%<br />
0%<br />
Chemistry<br />
Iran<br />
China<br />
Taiwan<br />
South Korea<br />
Malaysia<br />
Mathematics<br />
Energy<br />
Materials science<br />
Geosciences<br />
Engineering<br />
Information and computer science<br />
Figure 43: Publications by China, Taiwan, South Korea, Malaysia and Iran according to research<br />
discipline<br />
Figures 41 to 43 are also concerned with the output of the countries in the disciplines. However,<br />
the output of each individual country is taken as 100 % for these analyses. This makes it<br />
possible to localise the particular priorities of individual and multiple countries. Since the primary<br />
emphasis of the database is the field of medicine, it is not surprising that a high proportion of the<br />
output of the majority of the countries studied here is also in this field. On the other hand, it is<br />
interesting to note that in Indonesia, for example, biology and biochemistry continue to be a<br />
priority, as does chemistry in Iran.<br />
31
Central Library<br />
2.2 Growth Rates for Publication Activity<br />
The growth rates for the production of articles in the individual disciplines provide information on<br />
the disciplines that experienced an increase or decrease in the number of articles produced<br />
between the two periods of 1998 to 2002 and 2003 to 2007. It should be noted that disciplines<br />
which produce a small number of articles will generate higher growth rates (e.g. in information<br />
and computer science). For this reason, the discipline of “nanotechnology” is not included in the<br />
following bar charts. The corresponding data, however, can be found in the tables that follow the<br />
bar charts.<br />
Growth rates per discipline in Germany<br />
Physics<br />
Medicine<br />
Mathematics<br />
Materials science<br />
Engineering<br />
Information and computer science<br />
Geosciences<br />
Energy<br />
Chemistry<br />
Biology and biotechnology<br />
Agricultural science<br />
Multidisciplinary journals<br />
-45% -30% -15% 0% 15% 30% 45%<br />
Growth rates<br />
from 1998 to 2002 from 2003 to 2007<br />
Figure 44: Growth rates of the output in individual disciplines (Germany)<br />
Growth rates pers discipline in China<br />
Physics<br />
Medicine<br />
Mathematics<br />
Materials science<br />
Engineering<br />
Information and computer science<br />
Geosciences<br />
Energy<br />
Chemistry<br />
Biology and biotechnology<br />
Agricultural science<br />
Multidisciplinary journals<br />
-20% 0% 20% 40% 60% 80% 100% 120% 140% 160% 180% 200% 220% 240% 260% 280%<br />
Growth rates<br />
from 1998 to 2002 from 2003 to 2007<br />
Figure 45: Growth rates of the output in individual disciplines (China)<br />
32
Central Library<br />
Growth rates per discipline in Japan<br />
Physics<br />
Medicine<br />
Mathematics<br />
Materials science<br />
Engineering<br />
Information and computer science<br />
Geosciences<br />
Energy<br />
Chemistry<br />
Biology and biotechnology<br />
Agricultural science<br />
Multidisciplinary journals<br />
-40% -30% -20% -10% 0% 10% 20% 30% 40%<br />
Growth rates<br />
from 1998 to 2002 from 2003 to 2007<br />
Figure 46: Growth rates of the output in individual disciplines (Japan)<br />
Growth rates per discipline in New Zealand<br />
Physics<br />
Medicine<br />
Mathematics<br />
Materials science<br />
Engineering<br />
Information and computer science<br />
Geosciences<br />
Energy<br />
Chemistry<br />
Biology and biotechnology<br />
Agricultural science<br />
Multidisciplinary journals<br />
-40% -20% 0% 20% 40% 60% 80% 100%<br />
Growth rates<br />
from 1998 to 2002 from 2003 to 2007<br />
Figure 47: Growth rates of the output in individual disciplines (New Zealand)<br />
33
Central Library<br />
Growth rates per discipline in Australia<br />
Physics<br />
Medicine<br />
Mathematics<br />
Materials science<br />
Engineering<br />
Information and computer science<br />
Geosciences<br />
Energy<br />
Chemistry<br />
Biology and biotechnology<br />
Agricultural science<br />
Multidisciplinary journals<br />
-20% -10% 0% 10% 20% 30% 40% 50% 60%<br />
Growth rates<br />
from 1998 to 2002 from 2003 to 2007<br />
Figure 48: Growth rates of the output in individual disciplines (Australia)<br />
Growth rates per discipline in Taiwan<br />
Physics<br />
Medicine<br />
Mathematics<br />
Materials science<br />
Engineering<br />
Information and computer science<br />
Geosciences<br />
Energy<br />
Chemistry<br />
Biology and biotechnology<br />
Agricultural science<br />
Multidisciplinary journals<br />
0% 20% 40% 60% 80% 100% 120% 140%<br />
Growth rates<br />
from 1998 to 2002 from 2003 to 2007<br />
Figure 49: Growth rates of the output in individual disciplines (Taiwan)<br />
34
Central Library<br />
Growth rates per discipline in South Korea<br />
Physics<br />
Medicine<br />
Mathematics<br />
Materials science<br />
Engineering<br />
Information and computer science<br />
Geosciences<br />
Energy<br />
Chemistry<br />
Biology and biotechnology<br />
Agricultural science<br />
Multidisciplinary journals<br />
-40% -20% 0% 20% 40% 60% 80% 100% 120% 140% 160% 180%<br />
Growth rates<br />
from 1998 to 2002 from 2003 to 2007<br />
Figure 50: Growth rates of the output in individual disciplines (South Korea)<br />
Growth rates per discipline in Singapore<br />
Physics<br />
Medicine<br />
Mathematics<br />
Materials science<br />
Engineering<br />
Information and computer science<br />
Geosciences<br />
Energy<br />
Chemistry<br />
Biology and biotechnology<br />
Agricultural science<br />
Multidisciplinary journals<br />
0% 50% 100% 150% 200% 250%<br />
Growth rates<br />
from 1998 to 2002 from 2003 to 2007<br />
Figure 51: Growth rates of the output in individual disciplines (Singapore)<br />
35
Central Library<br />
Growth rates per discipline in Indonesia<br />
Physics<br />
Medicine<br />
Mathematics<br />
Materials science<br />
Engineering<br />
Information and computer science<br />
Geosciences<br />
Energy<br />
Chemistry<br />
Biology and biotechnology<br />
Agricultural science<br />
Multidisciplinary journals<br />
-75% -50% -25% 0% 25% 50% 75% 100% 125% 150%<br />
Growth rates<br />
from 1998 to 2002 from 2003 to 2007<br />
Figure 52: Growth rates of the output in individual disciplines (Indonesia)<br />
Growth rates per discipline in Thailand<br />
Physics<br />
Medicine<br />
Mathematics<br />
Materials science<br />
Engineering<br />
Information and computer science<br />
Geosciences<br />
Energy<br />
Chemistry<br />
Biology and biotechnology<br />
Agricultural science<br />
Multidisciplinary journals<br />
-50% 0% 50% 100% 150% 200% 250% 300%<br />
Growth rates<br />
from 1998 to 2002 from 2003 to 2007<br />
Figure 53: Growth rates of the output in individual disciplines (Thailand)<br />
36
Central Library<br />
Growth rates per discipline in Vietnam<br />
Physics<br />
Medicine<br />
Mathematics<br />
Materials science<br />
Engineering<br />
Information and computer science<br />
Geosciences<br />
Energy<br />
Chemistry<br />
Biology and biotechnology<br />
Agricultural science<br />
Multidisciplinary journals<br />
-100% -50% 0% 50% 100% 150% 200% 250% 300% 350% 400%<br />
Growth rates<br />
from 1998 to 2002 from 2003 to 2007<br />
Figure 54: Growth rates of the output in individual disciplines (Vietnam)<br />
Growth rates per discipline in Malaysia<br />
Physics<br />
Medicine<br />
Mathematics<br />
Materials science<br />
Engineering<br />
Information and computer science<br />
Geosciences<br />
Energy<br />
Chemistry<br />
Biology and biotechnology<br />
Agricultural science<br />
Multidisciplinary journals<br />
-20% 0% 20% 40% 60% 80% 100% 120% 140% 160% 180% 200%<br />
Growth rates<br />
from 1998 to 2002 from 2003 to 2007<br />
Figure 55: Growth rates of the output in individual disciplines (Malaysia)<br />
37
Central Library<br />
Growth rates per discipline in Iran<br />
Physics<br />
Medicine<br />
Mathematics<br />
Materials science<br />
Engineering<br />
Information and computer science<br />
Geosciences<br />
Energy<br />
Chemistry<br />
Biology and biotechnology<br />
Agricultural science<br />
Multidisciplinary journals<br />
-40% 0% 40% 80% 120% 160% 200% 240% 280% 320% 360%<br />
Growth rates<br />
from 1998 to 2002 from 2003 to 2007<br />
Figure 56: Growth rates of the output in individual disciplines (Iran)<br />
Table 7: Growth rates of the output in individual disciplines<br />
Growth rates Germany<br />
Discipline<br />
from 1998 to<br />
2002<br />
from 2003 to<br />
2007<br />
Multidisciplinary journals 8.45% 17.88%<br />
Agricultural science 3.39% 33.56%<br />
Biology and biotechnology 4.42% 27.10%<br />
Chemistry -4.21% 5.22%<br />
Energy 0.23% 1.41%<br />
Geosciences 33.25% 40.46%<br />
Information and computer science 20.08% -39.74%<br />
Engineering 1.88% 6.35%<br />
Materials science -1.29% 23.37%<br />
Mathematics -1.48% 9.67%<br />
Medicine 8.10% 32.30%<br />
Physics 5.68% 4.04%<br />
38
Central Library<br />
Growth rates China<br />
Discipline<br />
from 1998 to<br />
2002<br />
from 2003 to<br />
2007<br />
Multidisciplinary journals -3.52% 48.94%<br />
Agricultural science 126.00% 269.75%<br />
Biology and biotechnology 101.31% 119.94%<br />
Chemistry 107.33% 80.48%<br />
Energy 51.14% 157.89%<br />
Geosciences 138.86% 103.13%<br />
Information and computer science 210.58% 55.88%<br />
Engineering 124.18% 97.56%<br />
Materials science 104.31% 115.41%<br />
Mathematics 69.66% 83.79%<br />
Medicine 130.79% 86.37%<br />
Physics 77.57% 89.48%<br />
Growth rates Japan<br />
Discipline<br />
from 1998 to<br />
2002<br />
from 2003 to<br />
2007<br />
Multidisciplinary journals -1.00% 9.35%<br />
Agricultural science 8.27% 11.80%<br />
Biology and biotechnology 14.22% 5.82%<br />
Chemistry 1.82% -7.54%<br />
Energy -2.16% -6.52%<br />
Geosciences 37.36% 3.96%<br />
Information and computer science 14.43% -33.97%<br />
Engineering 3.84% -2.40%<br />
Materials science 18.79% 1.80%<br />
Mathematics 17.44% 1.93%<br />
Medicine 6.71% 3.38%<br />
Physics 13.29% -6.25%<br />
39
Central Library<br />
Growth rates New Zealand<br />
Discipline<br />
from 1998 to<br />
2002<br />
from 2003 to<br />
2007<br />
Multidisciplinary journals 11.29% -2.74%<br />
Agricultural science 0.19% 21.56%<br />
Biology and biotechnology 7.80% 33.03%<br />
Chemistry -18.32% 19.35%<br />
Energy -34.04% 57.14%<br />
Geosciences 9.98% 23.30%<br />
Information and computer science 75.53% -20.18%<br />
Engineering 11.41% 34.34%<br />
Materials science 3.76% 98.18%<br />
Mathematics 21.09% 18.71%<br />
Medicine 2.76% 36.68%<br />
Physics -2.56% 41.15%<br />
Growth rates Australia<br />
Discipline<br />
from 1998 to<br />
2002<br />
from 2003 to<br />
2007<br />
Multidisciplinary journals -5.90% 36.54%<br />
Agricultural science 18.73% 29.26%<br />
Biology and biotechnology 8.74% 30.48%<br />
Chemistry 0.23% 17.08%<br />
Energy 10.13% 60.37%<br />
Geosciences 14.55% 33.68%<br />
Information and computer science 7.88% -19.09%<br />
Engineering 8.60% 30.95%<br />
Materials science 0.70% 42.36%<br />
Mathematics -4.56% 18.79%<br />
Medicine 14.88% 38.30%<br />
Physics -1.49% 24.47%<br />
40
Central Library<br />
Growth rates Taiwan<br />
Discipline<br />
from 1998 to<br />
2002<br />
from 2003 to<br />
2007<br />
Multidisciplinary journals 19.51% 105.56%<br />
Agricultural science 73.13% 84.47%<br />
Biology and biotechnology 28.10% 51.93%<br />
Chemistry 34.51% 38.19%<br />
Energy 51.22% 129.08%<br />
Geosciences 42.29% 50.37%<br />
Information and computer science 36.13% 37.25%<br />
Engineering 18.60% 58.63%<br />
Materials science 66.12% 60.91%<br />
Mathematics 22.41% 68.23%<br />
Medicine 35.31% 47.72%<br />
Physics 32.21% 67.27%<br />
Growth rates South Korea<br />
Discipline<br />
from 1998 to<br />
2002<br />
from 2003 to<br />
2007<br />
Multidisciplinary journals 87.80% 92.86%<br />
Agricultural science 152.94% 108.12%<br />
Biology and biotechnology 49.26% 59.51%<br />
Chemistry 52.16% 26.32%<br />
Energy 93.01% 61.04%<br />
Geosciences 160.88% 51.56%<br />
Information and computer science 90.14% -35.73%<br />
Engineering 62.75% 34.07%<br />
Materials science 111.62% 47.45%<br />
Mathematics 40.30% 39.38%<br />
Medicine 72.98% 86.45%<br />
Physics 52.54% 33.22%<br />
41
Central Library<br />
Growth rates Singapore<br />
Discipline<br />
from 1998 to<br />
2002<br />
from 2003 to<br />
2007<br />
Multidisciplinary journals 227.27% 225.00%<br />
Agricultural science 60.61% 86.49%<br />
Biology and biotechnology 55.48% 94.41%<br />
Chemistry 58.74% 45.74%<br />
Energy 73.91% 78.00%<br />
Geosciences 38.65% 3.96%<br />
Information and computer science 47.56% 0.54%<br />
Engineering 65.86% 19.26%<br />
Materials science 125.42% 14.01%<br />
Mathematics 46.11% 2.95%<br />
Medicine 78.60% 48.50%<br />
Physics 110.22% 46.33%<br />
Growth rates Indonesia<br />
Discipline<br />
from 1998 to<br />
2002<br />
from 2003 to<br />
2007<br />
Multidisciplinary journals -33.33% 140.00%<br />
Agricultural science 8.54% 53.85%<br />
Biology and biotechnology 68.37% 30.52%<br />
Chemistry 75.86% 39.62%<br />
Energy 100.00% 116.67%<br />
Geosciences 35.48% 57.33%<br />
Information and computer science 75.00% -69.23%<br />
Engineering 60.71% 100.00%<br />
Materials science 53.33% -10.00%<br />
Mathematics 80.00% 87.50%<br />
Medicine 47.41% 32.50%<br />
Physics 25.00% 25.58%<br />
42
Central Library<br />
Growth rates Thailand<br />
Discipline<br />
from 1998 to<br />
2002<br />
from 2003 to<br />
2007<br />
Multidisciplinary journals -12.50% 110.00%<br />
Agricultural science 54.21% 118.84%<br />
Biology and biotechnology 65.45% 71.48%<br />
Chemistry 152.29% 82.64%<br />
Energy 8.33% 103.39%<br />
Geosciences 109.33% 68.13%<br />
Information and computer science 176.19% 14.94%<br />
Engineering 117.43% 79.00%<br />
Materials science 261.54% 217.14%<br />
Mathematics 225.00% 117.86%<br />
Medicine 41.17% 56.92%<br />
Physics 76.79% 149.61%<br />
Growth rates Vietnam<br />
Discipline<br />
from 1998 to<br />
2002<br />
from 2003 to<br />
2007<br />
Multidisciplinary journals -100.00% 400.00%<br />
Agricultural science 275.00% 68.00%<br />
Biology and biotechnology 54.17% 64.89%<br />
Chemistry 37.50% 42.55%<br />
Energy -66.67% 0.00%<br />
Geosciences 40.91% 148.65%<br />
Information and computer science -12.50% 54.55%<br />
Engineering 183.33% 89.29%<br />
Materials science 13.64% 20.00%<br />
Mathematics 48.65% 20.97%<br />
Medicine 82.67% 69.23%<br />
Physics 54.55% 2.27%<br />
43
Central Library<br />
Growth rates Malaysia<br />
Discipline<br />
from 1998 to<br />
2002<br />
from 2003 to<br />
2007<br />
Multidisciplinary journals -16.67% 66.67%<br />
Agricultural science 72.37% 52.42%<br />
Biology and biotechnology -3.77% 63.68%<br />
Chemistry 30.77% 38.91%<br />
Energy -17.24% 117.24%<br />
Geosciences 76.36% 105.88%<br />
Information and computer science 65.22% 6.58%<br />
Engineering 100.00% 120.19%<br />
Materials science 106.86% 115.13%<br />
Mathematics 9.09% 69.70%<br />
Medicine -10.20% 64.50%<br />
Physics 93.10% 189.00%<br />
Growth rates Iran<br />
Discipline<br />
from 1998 to<br />
2002<br />
from 2003 to<br />
2007<br />
Multidisciplinary journals 106.67% -35.06%<br />
Agricultural science 309.38% 357.46%<br />
Biology and biotechnology 217.95% 214.10%<br />
Chemistry 137.08% 123.30%<br />
Energy 116.67% 219.67%<br />
Geosciences 92.59% 206.71%<br />
Information and computer science 213.64% 144.64%<br />
Engineering 129.45% 191.75%<br />
Materials science 238.10% 236.41%<br />
Mathematics 80.00% 326.80%<br />
Medicine 100.32% 258.82%<br />
Physics 127.89% 190.41%<br />
44
Central Library<br />
2.3 Co-Publications<br />
The number of co-publications provides information on the main emphasis of joint scientific<br />
publications in the individual disciplines. The section that follows presents rankings for each of<br />
the countries studied within the framework of this analysis and shows which countries tend to<br />
work together in the various disciplines. Not only will cooperations between the countries of this<br />
analysis be investigated, but co-publications with other countries throughout the world will also<br />
be taken into account. For Indonesia, Malaysia, Singapore, Thailand and Vietnam copublications<br />
with the EU-27 are shown separately. Due to co-publications within the EU,<br />
publications of the 27 EU member states cannot be added up. This ranking will be performed for<br />
two periods, each five years in length, as well as for the period as a whole. This allows us to<br />
detect changes in co-publication practice. As was the case for co-publications according to<br />
country, no direct comparison is possible here between the individual disciplines due to the fact<br />
that each discipline has different communication habits.<br />
Ranking of selected key countries including EU-27 comparison<br />
Indonesia<br />
Agricultural Science<br />
1998-2007 1998-2002 2003-2007<br />
# Country<br />
Co-<br />
Publications # Country<br />
Co-<br />
Publications # Country<br />
Co-<br />
Publications<br />
- EU-27 226 - EU-27 118 - EU-27 108<br />
1 Japan 168 1 USA 84 1 Japan 104<br />
2 USA 152 2 Japan 64 2 USA 68<br />
3 Australia 101 3 Australia 41 3 Australia 60<br />
4 Netherlands 67 4 Netherlands 35 4 Germany 36<br />
5 Germany 65 5 UK 34 5 Netherlands 32<br />
6 UK 46 6 Germany 29 6 Thailand 18<br />
7 France 28 7 Vietnam 12 7 France 17<br />
8 Philippines 26 8 France 11 7 Philippines 17<br />
9 Vietnam 25 9 Malaysia 10 9 Malaysia 13<br />
10 Thailand 24 10 Philippines 9 9 Vietnam 13<br />
Biology and Biotechnology<br />
1998-2007 1998-2002 2003-2007<br />
# Country<br />
Co-<br />
Publications # Country<br />
Co-<br />
Publications # Country<br />
Co-<br />
Publications<br />
- EU-27 531 - EU-27 206 - EU-27 325<br />
1 USA 342 1 USA 136 1 Japan 208<br />
2 Japan 326 2 Australia 125 2 USA 206<br />
3 Australia 264 3 Japan 118 3 Australia 139<br />
4 Netherlands 148 4 UK 58 4 Netherlands 95<br />
5 UK 147 5 Netherlands 53 5 Germany 94<br />
6 Germany 140 6 Germany 46 6 UK 89<br />
7 France 86 7 France 41 7 France 45<br />
8 Thailand 59 8 Canada 23 8 Thailand 39<br />
9 Malaysia 55 9 Malaysia 22 9 Malaysia 33<br />
10 Canada 52 10 Thailand 20 10 Canada 29<br />
45
Central Library<br />
Chemistry<br />
1998-2007 1998-2002 2003-2007<br />
# Country<br />
Co-<br />
Publications # Country<br />
Co-<br />
Publications # Country<br />
Co-<br />
Publications<br />
1 Japan 197 1 Japan 71 1 Japan 126<br />
- EU-27 155 - EU-27 67 - EU-27 88<br />
2 Australia 117 2 Australia 44 2 Australia 73<br />
3 USA 45 3 Germany 18 3 USA 27<br />
4 Italy 38 4 USA 18 4 Italy 26<br />
5 Germany 36 5 France 15 5 Netherlands 25<br />
6 Netherlands 34 6 Italy 12 6 Malaysia 20<br />
7 Malaysia 25 7 Netherlands 9 7 Germany 18<br />
New<br />
8 France 22 7 Zealand 9 8 Canada 10<br />
South<br />
9 Canada 18 9 Canada 8 9 Korea 8<br />
10 New Zealand 16 10 Austria 6 9 China 8<br />
Energy<br />
1998-2007 1998-2002 2003-2007<br />
# Country<br />
Co-<br />
Publications # Country<br />
Co-<br />
Publications # Country<br />
Co-<br />
Publications<br />
- EU-27 29 - EU-27 24 1 Japan 15<br />
1 Japan 24 1 Japan 9 2 Malaysia 8<br />
2 USA 13 1 USA 9 - EU-27 5<br />
3 Australia 9 3 Australia 7 3 USA 4<br />
3 Malaysia 9 3 UK 7 4 Thailand 3<br />
5 UK 8 5 France 4 4 Philippines 3<br />
6 France 5 6 Canada 3 6 Australia 2<br />
7 Germany 4 6 Italy 3 6 Germany 2<br />
South<br />
7 Thailand 4 8 Poland 2 6 Korea 2<br />
9 Bangladesh 3 8 Belgium 2 6 China 2<br />
9 Canada 3 8 Bangladesh 2 6 Vietnam 2<br />
9 Italy 3 8 Hungary 2 6 Singapore 2<br />
9 Philippines 3 8 Bulgaria 2<br />
8 Libya 2<br />
8 Sudan 2<br />
8 Germany 2<br />
46
Central Library<br />
Geoscience<br />
1998-2007 1998-2002 2003-2007<br />
# Country<br />
Co-<br />
Publications # Country<br />
Co-<br />
Publications # Country<br />
Co-<br />
Publications<br />
- EU-27 319 - EU-27 148 - EU-27 171<br />
1 Japan 220 1 USA 95 1 Japan 141<br />
2 USA 212 2 Japan 79 2 USA 117<br />
3 Australia 136 3 Australia 69 3 Australia 67<br />
4 France 89 4 France 54 4 Germany 53<br />
5 UK 81 5 UK 41 5 UK 40<br />
6 Germany 71 6 Canada 27 6 Netherlands 37<br />
7 Netherlands 63 7 Netherlands 26 7 France 35<br />
8 Canada 44 8 Germany 18 8 Thailand 22<br />
9 Philippines 28 9 Philippines 10 9 Philippines 18<br />
10 Thailand 24 9 Belgium 10 10 Canada 17<br />
Information Science and Computer Science<br />
1998-2007 1998-2002 2003-2007<br />
# Country<br />
Co-<br />
Publications # Country<br />
Co-<br />
Publications # Country<br />
Co-<br />
Publications<br />
1 Japan 27 1 Japan 9 1 Japan 18<br />
2 Australia 14 - EU-27 7 2 Australia 7<br />
- EU-27 12 2 Australia 7 - EU-27 5<br />
3 Netherlands 7 3 Netherlands 3 3 USA 4<br />
4 USA 4 4 Germany 2 4 Netherlands 4<br />
5 France 2 4 France 2 5 Singapore 2<br />
5 Germany 2 5 Malaysia 2<br />
5 Malaysia 2<br />
5 Singapore 2<br />
Engineering Science<br />
1998-2007 1998-2002 2003-2007<br />
# Country<br />
Co-<br />
Publications # Country<br />
Co-<br />
Publications # Country<br />
Co-<br />
Publications<br />
1 Japan 131 1 Japan 57 1 Japan 74<br />
- EU-27 108 - EU-27 44 - EU-27 64<br />
2 USA 58 2 USA 33 2 Australia 26<br />
3 Australia 56 3 Australia 30 3 USA 25<br />
4 UK 34 4 UK 15 4 UK 19<br />
5 Canada 27 5 France 12 5 Malaysia 18<br />
6 Netherlands 23 6 Canada 10 6 Canada 17<br />
7 Malaysia 21 7 Netherlands 6 6 Netherlands 17<br />
8 France 18 7 Germany 6 8 Germany 10<br />
9 Germany 16 9 Singapore 4 9 Singapore 9<br />
10 Singapore 13 10 Malaysia 3 10 Sweden 7<br />
10 Belgium 3<br />
47
Central Library<br />
Materials<br />
Science<br />
1998-2007 1998-2002 2003-2007<br />
# Country<br />
Co-<br />
Publications # Country<br />
Co-<br />
Publications # Country<br />
Co-<br />
Publications<br />
1 Japan 104 1 Japan 39 1 Japan 65<br />
- EU-27 67 - EU-27 26 - EU-27 41<br />
2 Australia 31 2 Australia 14 2 Malaysia 17<br />
3 Germany 22 3 France 12 2 Germany 17<br />
3 Malaysia 22 4 UK 7 2 Australia 17<br />
5 France 17 5 USA 6 5 UK 6<br />
6 UK 13 6 Canada 5 6 Netherlands 5<br />
7 Canada 10 6 Malaysia 5 6 Canada 5<br />
7 USA 10 6 Germany 5 6 France 5<br />
9 Netherlands 7 9 Thailand 2 9 USA 4<br />
10 Austria 4 9 Netherlands 2 9<br />
Czech<br />
10 South Korea 4 9 Republic 2<br />
South<br />
Korea 4<br />
Mathematics<br />
1998-2007 1998-2002 2003-2007<br />
# Country<br />
Co-<br />
Publications # Country<br />
Co-<br />
Publications # Country<br />
Co-<br />
Publications<br />
- EU-27 32 - EU-27 9 - EU-27 23<br />
1 Australia 17 1 Australia 8 1 Australia 9<br />
2 Netherlands 12 2 USA 4 2 Netherlands 8<br />
3 USA 7 2 Netherlands 4 3 Japan 4<br />
4 Canada 5 4 Slovakia 2 3 Canada 4<br />
5 Japan 5 5 USA 3<br />
6 Slovakia 5 5 UK 3<br />
7 UK 4 5 Romania 3<br />
8 France 3 5 Germany 3<br />
9 Germany 3 5 Slovakia 3<br />
10 Romania 3 10 Pakistan 2<br />
10 France 2<br />
Medicine<br />
1998-2007 1998-2002 2003-2007<br />
# Country<br />
Co-<br />
Publications # Country<br />
Co-<br />
Publications # Country<br />
Co-<br />
Publications<br />
- EU-27 534 - EU-27 225 - EU-27 309<br />
1 USA 402 1 USA 157 1 Japan 257<br />
2 Japan 363 2 Japan 106 2 USA 245<br />
3 Australia 228 3 Australia 103 3 Thailand 143<br />
4 Netherlands 218 4 Netherlands 84 4 Netherlands 134<br />
5 Thailand 191 5 Germany 56 5 Australia 125<br />
South<br />
6 South Korea 127 6 UK 50 6 Korea 119<br />
7 UK 115 7 Thailand 48 7 China 71<br />
8 Germany 104 8 Malaysia 27 8 UK 65<br />
9 China 95 9 China 24 9 Malaysia 52<br />
10 Malaysia 79 10 Singapore 23 10 Germany 48<br />
48
Central Library<br />
Multidisciplinary Journals<br />
1998-2007 1998-2002 2003-2007<br />
# Country<br />
Co-<br />
Publications # Country<br />
Co-<br />
Publications # Country<br />
Co-<br />
Publications<br />
1 USA 38 1 USA 10 1 USA 28<br />
- EU-27 26 - EU-27 8 - EU-27 18<br />
2 Australia 18 2 Germany 5 2 Australia 16<br />
3 Japan 13 3 UK 3 3 Japan 10<br />
4 UK 10 3 Japan 3 4 India 9<br />
5 Germany 9 3 France 3 5 Netherlands 8<br />
5 India 9 6 Australia 2 5 China 8<br />
5 China 9 6 UK 7<br />
8 France 8 7 Vietnam 6<br />
8 Netherlands 8 7 Malaysia 6<br />
10 Malaysia 6 10 France 5<br />
10 Vietnam 6<br />
Physics<br />
1998-2007 1998-2002 2003-2007<br />
# Country<br />
Co-<br />
Publications # Country<br />
Co-<br />
Publications # Country<br />
Co-<br />
Publications<br />
- EU-27 158 - EU-27 72 - EU-27 86<br />
1 Japan 123 1 Japan 40 1 Japan 83<br />
2 Netherlands 61 2 Netherlands 28 2 Netherlands 33<br />
3 USA 57 3 USA 28 3 USA 29<br />
4 Germany 50 4 Germany 22 4 Germany 28<br />
5 Australia 35 5 Australia 20 5 Australia 15<br />
South<br />
6 France 27 6 Canada 17 6 Korea 14<br />
7 Canada 24 7 France 14 7 France 13<br />
8 South Korea 16 8 Austria 7 8 Canada 7<br />
9 Austria 13 9 Poland 6 9 Malaysia 6<br />
10 UK 10 10 UK 4 9 UK 6<br />
10 Belgium 4 9 Austria 6<br />
10 China 4 9 Italy 6<br />
Malaysia<br />
Agricultural Science<br />
1998-2007 1998-2002 2003-2007<br />
# Country<br />
Co-<br />
Publications # Country<br />
Co-<br />
Publications # Country<br />
Co-<br />
Publications<br />
- EU-27 129 - EU-27 45 - EU-27 84<br />
1 Japan 84 1 UK 31 1 Japan 63<br />
2 UK 75 2 USA 25 2 UK 44<br />
3 USA 62 3 Japan 21 3 USA 37<br />
4 Australia 40 4 Bangladesh 18 4 Australia 27<br />
5 Canada 29 4 Canada 15 5 Canada 14<br />
6 Bangladesh 27 6 Kenya 14 5 India 14<br />
7 Indonesia 23 7 Australia 13 5 Thailand 14<br />
8 India 18 8 Indonesia 10 5 Iran 14<br />
9 Kenya 17 9 Philippines 5 9 Indonesia 13<br />
9 Thailand 17 9 Belgium 5 10 Netherlands 12<br />
49
Central Library<br />
Biology and Biotechnology<br />
1998-2007 1998-2002 2003-2007<br />
# Country<br />
Co-<br />
Publications # Country<br />
Co-<br />
Publications # Country<br />
Co-<br />
Publications<br />
- EU-27 478 - EU-27 193 - EU-27 285<br />
1 Japan 260 1 UK 118 1 Japan 158<br />
2 UK 256 2 Japan 102 2 USA 144<br />
3 USA 235 3 USA 91 3 UK 138<br />
4 Australia 124 4 Australia 45 4 Australia 79<br />
5 Singapore 107 5 Singapore 33 5 Singapore 74<br />
6 Germany 71 6 France 27 6 Germany 55<br />
7 France 67 7 Indonesia 22 7 France 40<br />
8 Indonesia 55 8 Thailand 21 8 India 38<br />
9 Thailand 54 9 Canada 17 9 Thailand 33<br />
10 India 48 10 Germany 16 9 Indonesia 33<br />
Chemistry<br />
1998-2007 1998-2002 2003-2007<br />
# Country<br />
Co-<br />
Publications # Country<br />
Co-<br />
Publications # Country<br />
Co-<br />
Publications<br />
1 China 244 1 China 136 - EU-27 149<br />
- EU-27 284 - EU-27 135 1 China 108<br />
2 Japan 146 2 UK 73 2 Japan 100<br />
3 UK 139 3 Japan 46 3 UK 66<br />
4 India 85 4 Australia 30 4 India 62<br />
5 Australia 63 5 Singapore 27 5 Germany 39<br />
5 Germany 63 6 Germany 24 6 USA 35<br />
7 USA 57 7 India 23 7 Australia 33<br />
8 Singapore 41 7 Thailand 23 8 Iran 24<br />
9 Thailand 38 9 USA 22 9 Indonesia 20<br />
10 Iran 29 10 Canada 17 10 Pakistan 17<br />
Energy<br />
1998-2007 1998-2002 2003-2007<br />
# Country<br />
Co-<br />
Publications # Country<br />
Co-<br />
Publications # Country<br />
Co-<br />
Publications<br />
- EU-27 43 - EU-27 30 - EU-27 13<br />
1 UK 26 1 UK 19 1 USA 10<br />
2 USA 19 2 USA 9 2 Indonesia 8<br />
3 India 11 3 India 6 3 Singapore 7<br />
4 Indonesia 9 4 Bangladesh 5 3 UK 7<br />
5 Bangladesh 8 5 Germany 4 5 India 5<br />
6 Singapore 7 5 Canada 4 6 China 4<br />
7 Canada 6 7 Romania 3 7 Iran 3<br />
8 Germany 5 7 Jordan 3 7 Japan 3<br />
8 Japan 5 9 Libya 2 7 Iraq 3<br />
8 Libya 5 9 Turkey 2 7 Bangladesh 3<br />
9 Nepal 2 7 Libya 3<br />
9 Sweden 2<br />
9 Kuwait 2<br />
9 Japan 2<br />
9 Australia 2<br />
New<br />
9 Zealand 2<br />
50
Central Library<br />
Geoscience<br />
1998-2007 1998-2002 2003-2007<br />
# Country<br />
Co-<br />
Publications # Country<br />
Co-<br />
Publications # Country<br />
Co-<br />
Publications<br />
- EU-27 181 - EU-27 67 - EU-27 114<br />
1 UK 107 1 UK 41 1 Japan 66<br />
2 Japan 93 2 USA 30 1 UK 66<br />
3 USA 89 3 Japan 27 3 USA 59<br />
4 Australia 61 4 Australia 23 4 Australia 38<br />
5 Singapore 27 5 Bangladesh 9 5 Singapore 22<br />
6 Canada 25 5 Belgium 9 6 India 17<br />
7 Bangladesh 24 7 Canada 8 6 Thailand 17<br />
8 China 23 7 China 8 6 Canada 17<br />
9 Indonesia 21 9 Indonesia 7 9 China 15<br />
9 Thailand 21 10 Singapore 5 9 Bangladesh 15<br />
Information Science and Computer Science<br />
1998-2007 1998-2002 2003-2007<br />
# Country<br />
Co-<br />
Publications # Country<br />
Co-<br />
Publications # Country<br />
Co-<br />
Publications<br />
- EU-27 85 - EU-27 27 - EU-27 58<br />
1 UK 60 1 UK 23 1 UK 37<br />
2 Japan 33 2 Japan 8 2 Japan 25<br />
3 Australia 25 3 India 7 3 Australia 20<br />
4 USA 24 3 USA 7 4 USA 17<br />
5 India 23 5 Australia 5 5 India 16<br />
6 Singapore 15 6 Ireland 3 6 Singapore 13<br />
7 Canada 11 6 Canada 3 7 Canada 8<br />
U Arab<br />
New<br />
8 New Zealand 8 8 Emirates 2 8 Zealand 7<br />
South<br />
9 China 7 8 Singapore 2 9 Korea 6<br />
10 South Korea 6 9 China 6<br />
Engineering Science<br />
1998-2007 1998-2002 2003-2007<br />
# Country<br />
Co-<br />
Publications # Country<br />
Co-<br />
Publications # Country<br />
Co-<br />
Publications<br />
- EU-27 336 - EU-27 128 - EU-27 208<br />
1 UK 250 1 UK 106 1 UK 144<br />
2 India 132 2 USA 33 2 India 103<br />
3 USA 101 3 India 29 3 USA 68<br />
4 Japan 78 4 Japan 24 4 Japan 54<br />
5 Singapore 70 5 Australia 22 5 Singapore 50<br />
6 Australia 51 6 Singapore 20 6 Australia 29<br />
7 Bangladesh 27 7 Ireland 14 7 Romania 21<br />
8 China 23 8 Bangladesh 10 8 China 19<br />
9 Canada 21 9 Canada 9 9 Germany 18<br />
9 Indonesia 21 10 Turkey 4 9 Indonesia 18<br />
9 Romania 21 10 China 4<br />
U Arab<br />
10 Emirates 4<br />
51
Central Library<br />
Materials<br />
Science<br />
1998-2007 1998-2002 2003-2007<br />
# Country<br />
Co-<br />
Publications # Country<br />
Co-<br />
Publications # Country<br />
Co-<br />
Publications<br />
1 China 738 1 China 166 1 China 572<br />
2 India 343 2 India 137 2 India 206<br />
3 Thailand 222 3 Thailand 90 3 Thailand 132<br />
- EU-27 185 - EU-27 85 - EU-27 100<br />
4 UK 123 4 UK 59 4 UK 64<br />
5 Japan 76 5 Japan 28 5 Japan 48<br />
6 USA 69 6 USA 25 6 USA 44<br />
7 Turkey 39 7 Turkey 20 7 Pakistan 33<br />
8 Pakistan 35 8 Australia 19 8 Iran 26<br />
9 Australia 34 9 Germany 12 9 Turkey 19<br />
9 Iran 34 10 Iran 8 10 Indonesia 17<br />
10 Macedonia 8 10 Germany 17<br />
Mathematics<br />
1998-2007 1998-2002 2003-2007<br />
# Country<br />
Co-<br />
Publications # Country<br />
Co-<br />
Publications # Country<br />
Co-<br />
Publications<br />
- EU-27 49 - EU-27 24 - EU-27 25<br />
1 UK 37 1 UK 24 1 UK 13<br />
2 India 22 2 India 10 2 India 12<br />
3 USA 18 3 Australia 8 3 USA 10<br />
4 Australia 17 4 USA 8 4 Australia 9<br />
5 Singapore 10 5 Singapore 6 5 Romania 5<br />
6 Canada 9 6 Canada 5 6 China 4<br />
7 China 5 7 6 Singapore 4<br />
7 Romania 5 8 6 Canada 4<br />
9 Iran 4 9 9 Uzbekistan 3<br />
10 Japan 3 10 9 Iran 3<br />
10 South Korea 3<br />
10 Uzbekistan 3<br />
Medicine<br />
1998-2007 1998-2002 2003-2007<br />
# Country<br />
Co-<br />
Publications # Country<br />
Co-<br />
Publications # Country<br />
Co-<br />
Publications<br />
- EU-27 505 - EU-27 184 - EU-27 321<br />
1 USA 333 1 UK 115 1 USA 225<br />
2 UK 292 2 USA 108 2 Australia 185<br />
3 Australia 263 3 Australia 78 3 UK 177<br />
4 Japan 201 4 Japan 68 4 Singapore 151<br />
5 Singapore 200 5 Singapore 49 5 Japan 133<br />
6 China 122 6 China 28 6 China 94<br />
7 Thailand 113 7 Indonesia 27 7 Thailand 87<br />
8 India 94 8 Thailand 26 8 India 70<br />
9 Taiwan 80 8 Canada 26 9 Taiwan 62<br />
South<br />
10 Indonesia 79 10 India 24 10 Korea 58<br />
52
Central Library<br />
Multidisciplinary Journals<br />
1998-2007 1998-2002 2003-2007<br />
# Country<br />
Co-<br />
Publications # Country<br />
Co-<br />
Publications # Country<br />
Co-<br />
Publications<br />
- EU-27 21 - EU-27 7 - EU-27 14<br />
1 USA 17 1 USA 7 1 USA 10<br />
2 India 11 2 Singapore 4 2 India 8<br />
3 Japan 10 3 India 3 2 Japan 8<br />
4 UK 9 3 UK 3 4 Australia 6<br />
5 Australia 8 5 Thailand 2 4 Indonesia 6<br />
6 Germany 7 5 Kenya 2 4 UK 6<br />
6 Singapore 7 5 Germany 2 7 Thailand 5<br />
6 Thailand 7 5 Japan 2 7 Germany 5<br />
9 Indonesia 6 5 Australia 2 9 Canada 4<br />
10 Canada 4 9 Italy 4<br />
10 Italy 4<br />
Nanotechnology<br />
1998-2007 1998-2002 2003-2007<br />
# Country<br />
Co-<br />
Publications # Country<br />
Co-<br />
Publications # Country<br />
Co-<br />
Publications<br />
- EU-27 9 none - EU-27 9<br />
1 Japan 7 1 Japan 7<br />
2 USA 4 2 USA 4<br />
2 UK 4 2 UK 4<br />
4 Germany 3 4 Germany 3<br />
5 Sweden 2 5 Sweden 2<br />
5 Singapore 2 5 Singapore 2<br />
5 China 2 5 China 2<br />
Physik<br />
1998-2007 1998-2002 2003-2007<br />
# Land Kopublikationen # Land Kopublikationen # Land Kopublikationen<br />
- EU-27 203 - EU-27 74 - EU-27 129<br />
1 UK 109 1 UK 47 1 UK 62<br />
2 USA 71 2 Japan 20 2 USA 54<br />
3 Japan 68 3 USA 17 3 Japan 48<br />
4 India 63 3 India 17 4 India 46<br />
5 Romania 42 5 Australia 11 5 Romania 40<br />
6 Singapore 38 6 China 10 6 Singapore 33<br />
7 Germany 37 7 Germany 8 7 Germany 29<br />
South<br />
8 Australia 29 8 Poland 7 8 Korea 27<br />
9 Poland 28 9 Singapore 5 9 Canada 25<br />
Czech<br />
10 South Korea 27 10 Republic 4 10 Italy 23<br />
10 Jordan 4<br />
53
Central Library<br />
Singapore<br />
Agricultural Science<br />
1998-2007 1998-2002 2003-2007<br />
# Country<br />
Co-<br />
Publications # Country<br />
Co-<br />
Publications # Country<br />
Co-<br />
Publications<br />
- EU-27 74 - EU-27 39 1 USA 50<br />
1 USA 66 1 UK 16 - EU-27 35<br />
2 China 39 1 USA 16 2 Australia 29<br />
3 Australia 38 3 Netherlands 14 2 China 29<br />
New<br />
4 UK 25 4 Japan 12 4 Zealand 20<br />
5 New Zealand 24 5 China 10 5 Japan 11<br />
6 Japan 23 6 Australia 9 6 Oman 10<br />
7 Netherlands 21 7 Canada 8 7 UK 9<br />
8 Canada 16 8 Italy 6 8 Canada 8<br />
New<br />
9 Thailand 12 9 Zealand 4 8 Thailand 8<br />
10 Italy 10 9 Thailand 4 10 Netherlands 7<br />
10 Oman 10<br />
Biology and Biotechnology<br />
1998-2007 1998-2002 2003-2007<br />
# Country<br />
Co-<br />
Publications # Country<br />
Co-<br />
Publications # Country<br />
Co-<br />
Publications<br />
1 USA 1002 - EU-27 291 1 USA 731<br />
- EU-27 905 1 USA 271 - EU-27 614<br />
2 China 441 2 UK 175 2 China 358<br />
3 UK 431 3 Australia 92 3 UK 256<br />
4 Australia 324 4 China 83 4 Australia 232<br />
5 Japan 193 5 Canada 59 5 Japan 136<br />
6 Germany 184 6 Japan 57 6 Germany 135<br />
7 Canada 165 7 Germany 49 7 Canada 106<br />
8 France 116 8 Switzerland 39 8 France 81<br />
9 Malaysia 107 9 France 35 9 Malaysia 74<br />
10 Switzerland 100 9 Taiwan 35 10 Taiwan 65<br />
10 Taiwan 100<br />
54
Central Library<br />
Chemistry<br />
1998-2007 1998-2002 2003-2007<br />
# Country<br />
Co-<br />
Publications # Country<br />
Co-<br />
Publications # Country<br />
Co-<br />
Publications<br />
1 China 782 1 China 223 1 China 559<br />
2 USA 585 2 USA 173 2 USA 412<br />
- EU-27 424 - EU-27 145 - EU-27 279<br />
3 Australia 176 3 UK 72 3 Germany 117<br />
4 UK 163 4 Australia 60 4 Australia 116<br />
5 Germany 147 5 Japan 51 5 UK 91<br />
6 Japan 134 6 Canada 39 6 Japan 83<br />
7 Canada 94 7 Germany 30 7 India 57<br />
8 India 83 8 Taiwan 29 8 Canada 55<br />
New<br />
9 Taiwan 65 9 Zealand 27 9 Taiwan 36<br />
New<br />
10 New Zealand 58 9 Malaysia 27 10 Zealand 31<br />
Energy<br />
1998-2007 1998-2002 2003-2007<br />
# Country<br />
Co-<br />
Publications # Country<br />
Co-<br />
Publications # Country<br />
Co-<br />
Publications<br />
1 China 49 1 China 11 - EU-27 40<br />
- EU-27 47 2 USA 10 1 China 38<br />
2 USA 34 - EU-27 7 2 USA 24<br />
3 UK 17 3 Australia 7 3 UK 15<br />
4 Australia 16 4 Canada 6 4 Australia 9<br />
5 Germany 11 5 Germany 4 5 Finland 8<br />
South<br />
6 Finland 9 5 Korea 4 6 Malaysia 7<br />
6 Japan 9 7 Pakistan 3 7 Japan 7<br />
8 Canada 8 8 UK 2 8 Germany 7<br />
9 India 7 8 Japan 2 9 India 6<br />
9 Malaysia 7 10 Russia 6<br />
9 Russia 7<br />
9 South Korea 7<br />
Geoscience<br />
1998-2007 1998-2002 2003-2007<br />
# Country<br />
Co-<br />
Publications # Country<br />
Co-<br />
Publications # Country<br />
Co-<br />
Publications<br />
- EU-27 82 - EU-27 82 1 USA 148<br />
1 USA 213 1 USA 65 2 China 145<br />
2 China 198 2 UK 55 - EU-27 132<br />
3 UK 142 3 China 53 3 UK 87<br />
4 Australia 77 4 Australia 27 4 Australia 50<br />
5 Canada 69 5 Canada 23 5 Canada 46<br />
6 Japan 48 6 Japan 16 6 Japan 32<br />
7 Taiwan 43 7 India 15 7 Taiwan 31<br />
8 India 37 8 Taiwan 12 8 Malaysia 22<br />
9 Malaysia 27 9 Germany 10 8 India 22<br />
South<br />
10 South Korea 23 10 Sweden 9 10 Korea 18<br />
55
Central Library<br />
Information Science and Computer Science<br />
1998-2007 1998-2002 2003-2007<br />
# Country<br />
Co-<br />
Publications # Country<br />
Co-<br />
Publications # Country<br />
Co-<br />
Publications<br />
1 USA 688 1 USA 216 1 China 521<br />
- EU-27 422 - EU-27 121 2 USA 472<br />
2 China 635 2 China 114 - EU-27 301<br />
3 Australia 240 3 Australia 85 3 Australia 155<br />
4 Canada 126 4 Japan 39 4 UK 93<br />
4 UK 126 5 Canada 38 5 Canada 88<br />
6 India 97 6 UK 33 6 India 68<br />
7 Japan 92 7 India 29 7 Japan 53<br />
8 Germany 72 8 Germany 23 8 Germany 49<br />
South<br />
9 South Korea 46 9 Hong Kong 18 9 Korea 41<br />
10 France 43 10 Ireland 15 10 France 38<br />
Engineering Science<br />
1998-2007 1998-2002 2003-2007<br />
# Country<br />
Co-<br />
Publications # Country<br />
Co-<br />
Publications # Country<br />
Co-<br />
Publications<br />
1 China 1625 1 USA 456 1 China 1203<br />
2 USA 1382 2 China 422 2 USA 926<br />
- EU-27 969 - EU-27 332 - EU-27 637<br />
3 Australia 528 3 Australia 209 3 Australia 319<br />
4 UK 475 4 UK 187 4 UK 288<br />
5 Canada 295 5 Canada 118 5 Canada 177<br />
6 Japan 281 6 Japan 106 6 Japan 175<br />
7 India 243 7 India 86 7 India 157<br />
8 Taiwan 153 8 Germany 47 8 Taiwan 121<br />
9 Germany 140 9 Hong Kong 33 9 Germany 93<br />
South<br />
10 South Korea 92 10 Taiwan 32 10 Korea 70<br />
Materials<br />
Science<br />
1998-2007 1998-2002 2003-2007<br />
# Country<br />
Co-<br />
Publications # Country<br />
Co-<br />
Publications # Country<br />
Co-<br />
Publications<br />
1 China 697 1 China 240 1 China 457<br />
2 USA 575 2 USA 181 2 USA 394<br />
- EU-27 431 - EU-27 157 - EU-27 274<br />
3 Australia 254 3 Australia 120 3 Australia 134<br />
4 UK 212 4 UK 81 4 UK 131<br />
5 Japan 153 5 Japan 67 5 Japan 86<br />
6 India 108 6 India 43 6 Germany 66<br />
7 Germany 103 7 Germany 37 7 India 65<br />
8 Canada 59 8 Canada 20 8 Canada 39<br />
9 Taiwan 52 9 Taiwan 14 9 Taiwan 38<br />
10 France 39 10 France 13 10 France 26<br />
56
Central Library<br />
Mathematics<br />
1998-2007 1998-2002 2003-2007<br />
# Country<br />
Co-<br />
Publications # Country<br />
Co-<br />
Publications # Country<br />
Co-<br />
Publications<br />
1 USA 508 1 USA 193 1 USA 315<br />
- EU-27 353 - EU-27 168 2 China 285<br />
2 China 401 2 China 116 - EU-27 185<br />
3 Australia 108 3 Ireland 86 3 Australia 65<br />
4 Ireland 105 4 Australia 43 4 UK 61<br />
5 UK 101 5 UK 40 5 Canada 37<br />
6 Canada 68 6 Canada 31 6 Germany 35<br />
7 Japan 48 7 Taiwan 24 7 France 28<br />
8 Germany 45 8 Japan 23 8 Japan 25<br />
New<br />
9 Taiwan 43 9 India 16 9 Zealand 21<br />
10 Austria 33 9 Egypt 16 10 Austria 20<br />
10 New Zealand 33<br />
Medicine<br />
1998-2007 1998-2002 2003-2007<br />
# Country<br />
Co-<br />
Publications # Country<br />
Co-<br />
Publications # Country<br />
Co-<br />
Publications<br />
1 USA 2164 1 USA 605 1 USA 1559<br />
- EU-27 1693 - EU-27 493 - EU-27 1200<br />
2 UK 945 2 UK 335 2 UK 610<br />
3 Australia 749 3 Australia 169 3 China 608<br />
4 China 740 4 China 132 4 Australia 580<br />
5 Canada 354 5 Canada 102 5 Canada 252<br />
6 Germany 293 6 Taiwan 83 6 Germany 241<br />
7 Japan 279 7 Japan 77 7 Japan 202<br />
8 Taiwan 274 8 France 54 8 Taiwan 191<br />
9 France 232 9 Germany 52 9 France 178<br />
10 Malaysia 200 10 Malaysia 49 10 Malaysia 151<br />
Multidisciplinary Journals<br />
1998-2007 1998-2002 2003-2007<br />
# Country<br />
Co-<br />
Publications # Country<br />
Co-<br />
Publications # Country<br />
Co-<br />
Publications<br />
1 USA 54 1 USA 21 1 USA 48<br />
- EU-27 60 - EU-27 17 - EU-27 43<br />
2 China 31 2 UK 14 2 China 33<br />
3 UK 30 3 India 12 3 UK 23<br />
4 India 17 4 China 9 4 Sweden 15<br />
5 Australia 13 5 Australia 6 5 France 12<br />
6 Canada 12 6 Canada 5 5 Australia 12<br />
6 Sweden 12 7 Japan 4 7 Canada 11<br />
8 France 10 7 Germany 4 8 Germany 10<br />
9 Germany 9 7 Malaysia 4 9 Switzerland 8<br />
9 Japan 9 10 Thailand 2 10 Netherlands 7<br />
10 Japan 7<br />
57
Central Library<br />
Nanotechnology<br />
1998-2007 1998-2002 2003-2007<br />
# Country<br />
Co-<br />
Publications # Country<br />
Co-<br />
Publications # Country<br />
Co-<br />
Publications<br />
1 USA 145 - EU-27 26 1 USA 125<br />
2 China 118 1 China 24 2 China 94<br />
- EU-27 103 2 USA 20 - EU-27 77<br />
3 Germany 32 3 Germany 10 3 UK 26<br />
4 UK 31 4 Australia 6 4 Japan 25<br />
5 Japan 29 5 UK 5 5 Germany 22<br />
6 Australia 25 6 Belgium 4 6 Australia 19<br />
7 India 15 6 Japan 4 7 India 13<br />
8 Netherlands 10 6 France 4 8 Netherlands 7<br />
9 Canada 8 9 Netherlands 3 9 Switzerland 6<br />
10 Belgium 7 10 India 2 9 Canada 6<br />
South<br />
10 France 7 10 Korea 2 9 Taiwan 6<br />
10 Switzerland 7 10 Spain 2 9 Sweden 6<br />
New<br />
10 Taiwan 7 10 Zealand 2<br />
10 Canada 2<br />
Physics<br />
1998-2007 1998-2002 2003-2007<br />
# Country<br />
Co-<br />
Publications # Country<br />
Co-<br />
Publications # Country<br />
Co-<br />
Publications<br />
1 China 1541 1 China 464 1 China 1077<br />
2 USA 1065 2 USA 354 2 USA 711<br />
- EU-27 892 - EU-27 253 - EU-27 639<br />
3 UK 390 3 Australia 129 3 UK 275<br />
4 Australia 339 4 UK 115 4 Australia 210<br />
5 Japan 270 5 Japan 98 5 Japan 172<br />
6 Germany 205 6 Germany 53 6 Germany 152<br />
7 Canada 120 7 Canada 41 7 Canada 79<br />
8 India 108 8 India 33 8 India 75<br />
9 Taiwan 89 9 Taiwan 25 9 Italy 68<br />
10 South Korea 82 9 France 25 10 Taiwan 64<br />
58
Central Library<br />
Thailand<br />
Agricultural Science<br />
1998-2007 1998-2002 2003-2007<br />
# Country<br />
Co-<br />
Publications # Country<br />
Co-<br />
Publications # Country<br />
Co-<br />
Publications<br />
1 Japan 381 1 Japan 125 1 USA 264<br />
2 USA 358 - EU-27 94 2 Japan 256<br />
- EU-27 282 2 USA 94 - EU-27 188<br />
3 Australia 155 3 UK 46 3 Australia 110<br />
4 UK 99 4 Australia 45 4 UK 53<br />
5 Germany 53 5 Philippines 15 5 Germany 42<br />
6 Canada 52 6 Canada 11 6 Canada 41<br />
7 China 46 6 Germany 11 7 China 39<br />
8 Philippines 42 8 India 9 8 Philippines 27<br />
9 India 32 8 Israel 9 9 India 23<br />
10 Israel 31 10 Vietnam 8 9 Netherlands 23<br />
Biology and Biotechnology<br />
1998-2007 1998-2002 2003-2007<br />
# Country<br />
Co-<br />
Publications # Country<br />
Co-<br />
Publications # Country<br />
Co-<br />
Publications<br />
- EU-27 1179 - EU-27 398 - EU-27 781<br />
1 USA 974 1 Japan 318 1 USA 673<br />
2 Japan 923 2 USA 301 2 Japan 605<br />
3 UK 502 3 UK 167 3 UK 335<br />
4 Australia 336 4 Australia 107 4 Australia 229<br />
5 France 178 5 France 58 5 China 123<br />
6 Germany 172 6 Germany 50 6 Germany 122<br />
7 China 167 7 China 44 7 France 120<br />
8 Canada 108 8 Canada 35 8 Canada 73<br />
9 Netherlands 99 8 Denmark 35 9 Sweden 67<br />
10 Sweden 88 10 Netherlands 34 10 Netherlands 65<br />
Chemistry<br />
1998-2007 1998-2002 2003-2007<br />
# Country<br />
Co-<br />
Publications # Country<br />
Co-<br />
Publications # Country<br />
Co-<br />
Publications<br />
- EU-27 545 1 USA 143 - EU-27 403<br />
1 USA 512 - EU-27 142 1 USA 369<br />
2 Japan 499 2 Japan 136 2 Japan 363<br />
3 UK 191 3 UK 54 3 UK 137<br />
4 Australia 120 4 Australia 27 4 Australia 93<br />
5 Germany 92 5 Austria 26 5 Germany 68<br />
6 Austria 89 6 Germany 24 6 Austria 63<br />
7 Canada 74 7 Malaysia 23 7 Canada 54<br />
8 Netherlands 47 8 Canada 20 8 Netherlands 40<br />
9 France 45 9 France 12 9 China 35<br />
10 China 42 10 Taiwan 8 10 France 33<br />
59
Central Library<br />
Energy<br />
1998-2007 1998-2002 2003-2007<br />
# Country<br />
Co-<br />
Publications # Country<br />
Co-<br />
Publications # Country<br />
Co-<br />
Publications<br />
- EU-27 48 - EU-27 11 - EU-27 37<br />
1 USA 41 1 USA 10 1 USA 30<br />
2 Japan 38 2 Japan 9 2 Japan 29<br />
3 Australia 16 3 India 5 3 Australia 14<br />
3 Sweden 16 4 Bangladesh 3 3 Sweden 14<br />
5 India 11 5 UK 3 5 France 10<br />
6 France 10 5 Germany 3 6 India 6<br />
7 UK 8 7 Australia 2 6 Sri Lanka 6<br />
8 Germany 7 7 Niederlande 2 8 Canada 5<br />
8 Sri Lanka 7 7 Schweden 2 8 Philippines 5<br />
9 Singapore 6 8 Singapore 5<br />
Geoscience<br />
1998-2007 1998-2002 2003-2007<br />
# Country<br />
Co-<br />
Publications # Country<br />
Co-<br />
Publications # Country<br />
Co-<br />
Publications<br />
1 USA 315 - EU-27 108 1 USA 240<br />
- EU-27 295 1 Japan 80 - EU-27 187<br />
2 Japan 237 2 USA 75 2 Japan 157<br />
3 Australia 138 3 Australia 44 3 Australia 94<br />
4 UK 91 4 UK 31 4 UK 60<br />
5 France 71 5 France 23 5 France 48<br />
6 China 53 6 Germany 22 6 China 44<br />
7 Germany 50 7 Denmark 18 7 Germany 28<br />
8 India 36 8 Canada 13 7 India 28<br />
South<br />
9 Denmark 35 9 Korea 10 9 Indonesia 22<br />
South<br />
10 Canada 33 9 Vietnam 10 9 Korea 22<br />
Information Science and Computer Science<br />
1998-2007 1998-2002 2003-2007<br />
# Country<br />
Co-<br />
Publications # Country<br />
Co-<br />
Publications # Country<br />
Co-<br />
Publications<br />
1 USA 142 USA 36 1 USA 106<br />
- EU-27 76 - EU-27 19 - EU-27 57<br />
2 Japan 52 Japan 17 2 Japan 35<br />
3 UK 36 UK 7 3 UK 29<br />
4 Australia 19 Australia 6 4 Australia 13<br />
5 Canada 14 Canada 6 5 Austria 8<br />
6 Austria 11 Austria 3 5 Canada 8<br />
7 France 10 France 3 5 China 8<br />
7 China 10 India 2 8 France 7<br />
9 Germany 7 Italy 2 8 Germany 7<br />
9 Vietnam 7 China 2 8 Vietnam 7<br />
Spain 2<br />
60
Central Library<br />
Engineering Science<br />
1998-2007 1998-2002 2003-2007<br />
# Country<br />
Co-<br />
Publications # Country<br />
Co-<br />
Publications # Country<br />
Co-<br />
Publications<br />
1 USA 560 1 USA 140 1 USA 420<br />
2 Japan 352 2 Japan 121 - EU-27 233<br />
- EU-27 317 - EU-27 84 2 Japan 231<br />
3 UK 153 3 UK 48 3 UK 105<br />
4 Australia 112 4 Australia 30 4 Australia 82<br />
5 Canada 66 5 Canada 25 5 Canada 41<br />
6 China 46 6 India 12 6 France 38<br />
7 France 45 7 China 11 7 China 35<br />
South<br />
8 South Korea 34 7 Korea 11 8 Germany 24<br />
South<br />
9 India 31 9 France 7 9 Korea 23<br />
10 Germany 29 9 Vietnam 7 10 India 19<br />
Materials<br />
Science<br />
1998-2007 1998-2002 2003-2007<br />
# Country<br />
Co-<br />
Publications # Country<br />
Co-<br />
Publications # Country<br />
Co-<br />
Publications<br />
1 Malaysia 222 1 Malaysia 90 1 USA 143<br />
2 USA 180 2 China 49 - EU-27 135<br />
- EU-27 166 3 USA 37 2 Malaysia 132<br />
3 Japan 142 - EU-27 31 3 Japan 112<br />
4 China 80 4 Japan 30 4 UK 67<br />
5 UK 78 5 India 15 5 Australia 31<br />
6 india 43 6 UK 11 5 China 31<br />
7 Australia 41 7 Australia 10 7 India 28<br />
8 Germany 31 8 Germany 6 8 Germany 25<br />
9 France 16 9 Cuba 3 9 France 13<br />
10 Canada 13 9 Finland 3 10 Canada 11<br />
9 France 3<br />
South<br />
9 Korea 3<br />
9 Spain 3<br />
9 Sweden 3<br />
9 Taiwan 3<br />
61
Central Library<br />
Mathematics<br />
1998-2007 1998-2002 2003-2007<br />
# Country<br />
Co-<br />
Publications # Country<br />
Co-<br />
Publications # Country<br />
Co-<br />
Publications<br />
1 USA 63 1 USA 14 1 USA 49<br />
- EU-27 36 - EU-27 11 - EU-27 25<br />
2 Australia 15 2 UK 4 2 Australia 14<br />
3 Germany 11 3 Germany 3 3 Germany 8<br />
4 UK 10 4 Japan 2 4 UK 6<br />
5 China 7 4 Netherlands 2 4 China 6<br />
6 Japan 5 6 Vietnam 5<br />
6 Russia 5 7 Russia 4<br />
South<br />
6 Vietnam 5 7 Korea 4<br />
9 Philippines 4 7 Spain 4<br />
9 South Korea 4<br />
9 Spain 4<br />
Medicine<br />
1998-2007 1998-2002 2003-2007<br />
# Country<br />
Co-<br />
Publications # Country<br />
Co-<br />
Publications # Country<br />
Co-<br />
Publications<br />
1 USA 2476 1 USA 836 1 USA 1636<br />
- EU-27 1916 - EU-27 652 - EU-27 1264<br />
2 Japan 1084 2 Japan 366 2 Japan 717<br />
3 UK 994 3 UK 348 3 UK 646<br />
4 Australia 601 4 Australia 171 4 Australia 430<br />
5 France 305 5 Netherlands 106 5 China 224<br />
6 China 287 6 France 89 6 France 216<br />
7 Netherlands 251 7 Switzerland 85 7 Germany 171<br />
South<br />
8 Germany 240 8 Germany 69 8 Korea 168<br />
9 Switzerland 227 9 Canada 68 9 Netherlands 145<br />
10 Canada 212 10 China 62 10 Canada 144<br />
Multidisciplinary Journals<br />
1998-2007 1998-2002 2003-2007<br />
# Country<br />
Co-<br />
Publications # Country<br />
Co-<br />
Publications # Country<br />
Co-<br />
Publications<br />
1 USA 54 1 USA 13 1 USA 41<br />
- EU-27 53 - EU-27 12 - EU-27 41<br />
2 France 25 2 France 7 2 France 18<br />
3 UK 21 3 UK 5 3 UK 16<br />
4 Japan 14 4 Japan 4 4 China 12<br />
5 China 12 5 Myanmar 3 5 Japan 10<br />
6 India 11 6 India 2 6 India 9<br />
7 Australia 8 6 Malaysia 2 7 Australia 7<br />
8 Canada 7 6 Singapore 2 7 Canada 7<br />
8 Germany 7 7 Germany 7<br />
8 Malaysia 7 10 Vietnam 6<br />
62
Central Library<br />
Nanotechnology<br />
1998-2007 1998-2002 2003-2007<br />
# Country<br />
Co-<br />
Publications # Country<br />
Co-<br />
Publications # Country<br />
Co-<br />
Publications<br />
1 USA 19<br />
- EU-27 14<br />
2 UK 7 Due to a low number of publications, the ranking is provided for<br />
2 Japan 7 the entire period under observation only.<br />
3 Sweden 4<br />
4 Italy 3<br />
Physics<br />
1998-2007 1998-2002 2003-2007<br />
# Country<br />
Co-<br />
Publications # Country<br />
Co-<br />
Publications # Country<br />
Co-<br />
Publications<br />
- EU-27 279 - EU-27 73 - EU-27 206<br />
1 USA 243 1 USA 59 1 USA 184<br />
2 Japan 110 2 Japan 31 2 Japan 79<br />
3 UK 100 3 UK 23 3 UK 77<br />
4 Germany 75 4 Germany 19 4 Germany 56<br />
5 China 53 5 China 12 5 China 41<br />
6 Australia 39 6 Austria 11 6 Australia 30<br />
7 Austria 32 7 Australia 9 7 France 29<br />
7 France 32 7 Finland 9 8 Sweden 27<br />
7 Sweden 32 7 Mexico 9 9 Austria 21<br />
10 Taiwan 20 7 Russia 9 10 Taiwan 14<br />
Vietnam<br />
Agricultural Science<br />
1998-2007 1998-2002 2003-2007<br />
# Country<br />
Co-<br />
Publications # Country<br />
Co-<br />
Publications # Country<br />
Co-<br />
Publications<br />
- EU-27 246 - EU-27 90 - EU-27 156<br />
1 Japan 109 1 Sweden 31 1 Japan 81<br />
2 France 60 2 Japan 28 2 France 42<br />
3 Netherlands 52 3 France 18 3 Netherlands 39<br />
4 Sweden 45 4 UK 17 4 Australia 30<br />
5 Australia 44 5 Australia 14 5 USA 28<br />
6 USA 41 6 Netherlands 13 6 Belgium 23<br />
7 UK 36 6 USA 13 7 Philippines 19<br />
8 Belgium 32 8 Indonesia 12 8 UK 19<br />
9 Philippines 27 9 India 11 9 Thailand 16<br />
10 Indonesia 26 10 Belgium 9 10 Germany 15<br />
63
Central Library<br />
Biology and Biotechnology<br />
1998-2007 1998-2002 2003-2007<br />
# Country<br />
Co-<br />
Publications # Country<br />
Co-<br />
Publications # Country<br />
Co-<br />
Publications<br />
- EU-27 474 - EU-27 187 - EU-27 287<br />
1 Japan 175 1 France 55 1 Japan 129<br />
2 UK 144 2 UK 54 2 USA 90<br />
3 USA 129 3 Japan 46 3 UK 90<br />
4 France 117 4 USA 39 4 France 62<br />
5 Australia 81 5 Australia 36 5 Australia 45<br />
6 Germany 80 6 Germany 34 5 Germany 46<br />
7 Belgium 64 7 Belgium 28 7 Netherlands 42<br />
8 Thailand 63 8 Thailand 23 8 Thailand 40<br />
9 Netherlands 48 9 Russia 12 9 China 37<br />
10 Russia 47 10 Sweden 11 10 Belgium 36<br />
Chemistry<br />
1998-2007 1998-2002 2003-2007<br />
# Country<br />
Co-<br />
Publications # Country<br />
Co-<br />
Publications # Country<br />
Co-<br />
Publications<br />
- EU-27 255 - EU-27 108 - EU-27 147<br />
1 France 110 1 France 44 1 France 66<br />
2 Japan 90 2 Belgium 30 2 Japan 60<br />
3 Belgium 65 3 Japan 30 3 Belgium 35<br />
South<br />
4 Germany 50 4 Germany 22 4 Korea 31<br />
5 South Korea 39 5 USA 9 5 Germany 28<br />
South<br />
6 USA 37 6 Korea 8 5 USA 28<br />
7 China 13 7 Netherlands 7 7 Denmark 8<br />
8 Australia 10 8 China 6 7 Switzerland 8<br />
9 Denmark 9 9 Australia 5 9 Italy 7<br />
9 Switzerland 9 9 Hungary 5 9 China 7<br />
Energy<br />
1998-2007 1998-2002 2003-2007<br />
# Country<br />
Co-<br />
Publications # Country<br />
Co-<br />
Publications # Country<br />
Co-<br />
Publications<br />
1 Japan 19 1 Japan 10 - EU-27 10<br />
- EU-27 14 - EU-27 4 1 Japan 9<br />
2 France 5 2 Hungary 2 2 France 4<br />
South<br />
2 South Korea 5 2 Korea 4<br />
4 Australia 4 4 Australia 3<br />
4 UK 4 4 Denmark 3<br />
6 Denmark 3 4 UK 3<br />
6 Russia 3 4 Russia 3<br />
8 USA 2 8 Indonesia 2<br />
8 Thailand 2 8 China 2<br />
8 China 2 8 Thailand 2<br />
8 Indonesia 2<br />
8 India 2<br />
8 Hungary 2<br />
64
Central Library<br />
Geoscience<br />
1998-2007 1998-2002 2003-2007<br />
# Country<br />
Co-<br />
Publications # Country<br />
Co-<br />
Publications # Country<br />
Co-<br />
Publications<br />
- EU-27 152 - EU-27 29 - EU-27 123<br />
1 Japan 94 1 France 24 1 Japan 72<br />
2 France 57 2 Japan 22 2 USA 37<br />
3 USA 54 3 USA 17 3 France 33<br />
4 Netherlands 28 4 Netherlands 10 4 China 23<br />
5 China 26 4 Thailand 10 5 Philippines 21<br />
5 Philippines 26 6 Australia 7 6 Belgium 20<br />
7 Australia 25 6 Russia 7 7 Australia 18<br />
7 Thailand 25 6 Switzerland 7 7 Switzerland 18<br />
7 Switzerland 25 9 Taiwan 6 7 Netherlands 18<br />
10 Germany 21 10 Germany 5 7 UK 18<br />
10 UK 21 10 Philippines 5<br />
Information Science and Computer Science<br />
1998-2007 1998-2002 2003-2007<br />
# Country<br />
Co-<br />
Publications # Country<br />
Co-<br />
Publications # Country<br />
Co-<br />
Publications<br />
- EU-27 34 - EU-27 9 - EU-27 25<br />
1 France 16 1 France 4 1 France 12<br />
2 Japan 9 2 Germany 3 2 Thailand 7<br />
3 Australia 8 2 Japan 3 3 Australia 6<br />
4 Singapore 7 4 Australia 2 3 Japan 6<br />
5 Thailand 7 4 Singapore 2 3 USA 6<br />
6 USA 7 6 Singapore 5<br />
South<br />
7 Germany 5 6 Korea 5<br />
8 South Korea 5 8 Netherlands 3<br />
9 Canada 3 9 Canada 2<br />
10 Netherlands 3 9 Germany 2<br />
9 Switzerland 2<br />
Engineering Science<br />
1998-2007 1998-2002 2003-2007<br />
# Country<br />
Co-<br />
Publications # Country<br />
Co-<br />
Publications # Country<br />
Co-<br />
Publications<br />
- EU-27 - EU-27 25 - EU-27 58<br />
1 Japan 43 1 Japan 12 1 Japan 31<br />
South<br />
2 South Korea 33 2 Netherlands 10 2 Korea 30<br />
3 Australia 24 3 Germany 7 3 Australia 20<br />
4 Germany 20 3 Thailand 7 4 France 14<br />
5 France 19 5 France 5 5 Germany 13<br />
5 Netherlands 19 6 Australia 4 5 USA 13<br />
South<br />
7 Thailand 16 7 Korea 3 7 Netherlands 9<br />
8 USA 14 8 Malaysia 2 7 Thailand 9<br />
9 Singapore 10 8 Poland 2 9 China 8<br />
10 China 8 8 Singapore 2 9 Singapore 8<br />
65
Central Library<br />
Materials<br />
Science<br />
1998-2007 1998-2002 2003-2007<br />
# Country<br />
Co-<br />
Publications # Country<br />
Co-<br />
Publications # Country<br />
Co-<br />
Publications<br />
- EU-27 132 - EU-27 62 - EU-27 70<br />
1 France 55 1 Netherlands 24 1 France 35<br />
South<br />
2 South Korea 34 2 France 20 2 Korea 31<br />
3 Netherlands 31 3 Germany 10 3 Japan 23<br />
4 Japan 27 4 Sweden 6 4 UK 12<br />
Czech<br />
5 UK 14 5 Republic 4 5 Austria 8<br />
6 Germany 13 5 Japan 4 6 Netherlands 7<br />
7 Austria 9 5 Singapore 4 6 USA 7<br />
8 Sweden 8 8 Russia 3 8 Bangladesh 4<br />
Czech<br />
South<br />
9 Republic 7 8 Korea 3 8 Taiwan 4<br />
Czech<br />
9 USA 7 10 UK 2 10 Republic 3<br />
10 Canada 2 10 Germany 3<br />
10 Switzerland 2 10 Belgium 3<br />
10 India 2<br />
Mathematics<br />
1998-2007 1998-2002 2003-2007<br />
# Country<br />
Co-<br />
Publications # Country<br />
Co-<br />
Publications # Country<br />
Co-<br />
Publications<br />
- EU-27 140 - EU-27 65 - EU-27 75<br />
1 France 62 1 France 28 1 France 34<br />
2 USA 34 2 Germany 19 2 USA 22<br />
South<br />
3 Germany 33 3 USA 12 3 Korea 20<br />
4 Japan 23 4 Italy 10 4 Japan 15<br />
5 South Korea 22 5 Japan 8 5 Germany 14<br />
6 Australia 19 6 Australia 6 6 Australia 13<br />
7 Italy 18 7 Canada 5 7 Belgium 8<br />
8 Belgium 9 7 UK 5 7 Italy 8<br />
South<br />
9 UK 8 9 Korea 2 9 Taiwan 5<br />
10 Canada 7 9 India 2 9 Thailand 5<br />
9 Romania 2<br />
9 Kuwait 2<br />
9 Croatia 2<br />
66
Central Library<br />
Medicine<br />
1998-2007 1998-2002 2003-2007<br />
# Country<br />
Co-<br />
Publications # Country<br />
Co-<br />
Publications # Country<br />
Co-<br />
Publications<br />
- EU-27 783 - EU-27 267 - EU-27 516<br />
1 USA 335 1 USA 111 1 USA 224<br />
2 UK 245 2 UK 97 2 Japan 154<br />
3 Japan 218 3 Japan 64 3 UK 148<br />
4 France 179 4 France 61 4 France 118<br />
5 Australia 141 5 Australia 52 5 Thailand 97<br />
6 Sweden 140 6 Sweden 49 6 Sweden 91<br />
7 Thailand 138 7 Thailand 41 7 Australia 89<br />
South<br />
8 Netherlands 105 8 Netherlands 25 8 Korea 82<br />
9 China 101 9 China 22 9 Netherlands 80<br />
10 South Korea 99 10 Belgium 21 10 China 79<br />
Multidisciplinary Journals<br />
1998-2007 1998-2002 2003-2007<br />
# Country<br />
Co-<br />
Publications # Country<br />
Co-<br />
Publications # Country<br />
- EU-27 26<br />
2 France 13<br />
3 UK 8<br />
4 Indonesia 6<br />
4 Italy 6<br />
Co-<br />
Publications<br />
Due to a low number o publications, the ranking is provided for<br />
the<br />
4 Thailand 6<br />
7 Germany 5 entire period under observation only.<br />
7 China 5<br />
9 Australia 4<br />
9 Brazil 4<br />
9 Japan 4<br />
Physics<br />
1998-2007 1998-2002 2003-2007<br />
# Country<br />
Co-<br />
Publications # Country<br />
Co-<br />
Publications # Country<br />
Co-<br />
Publications<br />
- EU-27 359 - EU-27 148 - EU-27 211<br />
South<br />
1 Japan 121 1 France 44 1 Korea 83<br />
2 France 119 2 Japan 41 2 Japan 78<br />
3 South Korea 89 3 Netherlands 36 3 France 75<br />
4 Germany 71 4 Germany 27 4 Germany 44<br />
5 Belgium 48 5 Belgium 23 5 UK 39<br />
6 Netherlands 45 6 Italy 12 6 USA 30<br />
7 UK 44 7 USA 11 7 Belgium 25<br />
8 USA 41 8 Sweden 10 8 Italy 22<br />
9 Italy 34 9 Russia 9 9 Poland 17<br />
10 Russia 24 10 India 7 10 Russia 15<br />
67
Central Library<br />
Ranking of key countries without EU-27 comparison<br />
Australia<br />
Agricultural Science<br />
1998-2007 1998-2002 2003-2007<br />
# Country<br />
Co-<br />
Publications # Country<br />
Co-<br />
Publications # Country<br />
Co-<br />
Publications<br />
1 USA 1154 1 USA 489 1 USA 665<br />
2 UK 677 2 UK 295 2 UK 382<br />
New<br />
New<br />
3 New Zealand 511 3 Zealand 210 3 Zealand 301<br />
4 Canada 339 4 Canada 139 4 China 248<br />
5 China 315 5 Germany 81 5 Canada 200<br />
6 France 208 6 France 72 6 France 136<br />
7 Germany 200 7 China 67 7 Germany 119<br />
8 Japan 180 8 Japan 62 8 Japan 118<br />
9 Thailand 155 9 Netherlands 61 9 Thailand 110<br />
10 Netherlands 149 10 South Africa 50 10 Netherlands 88<br />
Biology and Biotechnology<br />
1998-2007 1998-2002 2003-2007<br />
# Country<br />
Co-<br />
Publications # Country<br />
Co-<br />
Publications # Country<br />
Co-<br />
Publications<br />
1 USA 8300 1 USA 3473 1 USA 4827<br />
2 UK 3977 2 UK 1614 2 UK 2363<br />
3 Germany 2153 3 Germany 829 3 Germany 1324<br />
4 Canada 1496 4 Canada 635 4 Canada 861<br />
New<br />
New<br />
5 New Zealand 1466 5 Zealand 609 5 Zealand 857<br />
6 France 1408 6 France 571 6 France 837<br />
7 Japan 1320 7 Japan 534 7 Japan 786<br />
8 China 1038 8 Netherlands 318 8 China 772<br />
9 Sweden 812 9 Sweden 307 9 Sweden 505<br />
10 Netherlands 764 10 China 266 10 Netherlands 446<br />
Chemistry<br />
1998-2007 1998-2002 2003-2007<br />
# Country<br />
Co-<br />
Publications # Country<br />
Co-<br />
Publications # Country<br />
Co-<br />
Publications<br />
1 USA 1774 1 USA 733 1 USA 1041<br />
2 UK 1183 2 UK 525 2 UK 658<br />
3 Germany 769 3 Germany 289 3 China 545<br />
4 China 724 4 Japan 243 4 Germany 480<br />
New<br />
5 Japan 570 5 Zealand 187 5 Japan 327<br />
6 France 403 6 China 179 6 France 239<br />
New<br />
7 New Zealand 374 7 France 164 7 Zealand 187<br />
8 Canada 294 8 Canada 113 8 Italy 181<br />
9 Italy 290 9 Sweden 110 8 Canada 181<br />
10 Sweden 246 10 Italy 109 10 Sweden 136<br />
68
Central Library<br />
Energy<br />
1998-2007 1998-2002 2003-2007<br />
# Country<br />
Co-<br />
Publications # Country<br />
Co-<br />
Publications # Country<br />
Co-<br />
Publications<br />
1 USA 349 1 USA 181 1 USA 168<br />
2 Germany 184 2 Germany 92 2 Japan 115<br />
3 Japan 176 3 UK 65 3 Germany 92<br />
4 UK 147 4 Japan 61 4 UK 82<br />
5 China 97 5 China 40 5 China 57<br />
6 France 63 6 France 33 6 France 30<br />
7 Canada 60 7 Canada 32 7 Canada 28<br />
8 Switzerland 45 8 Russia 23 8 Netherlands 26<br />
South<br />
9 Russia 44 9 Sweden 22 8 Korea 26<br />
10 Netherlands 43 9 Switzerland 22 10 Poland 25<br />
10 Poland 43 10 Taiwan 25<br />
Geoscience<br />
1998-2007 1998-2002 2003-2007<br />
# Country<br />
Co-<br />
Publications # Country<br />
Co-<br />
Publications # Country<br />
Co-<br />
Publications<br />
1 USA 4013 1 USA 1686 1 USA 2327<br />
2 UK 2245 2 UK 880 2 UK 1365<br />
3 Canada 1183 3 Canada 483 3 China 877<br />
4 China 1156 4 Germany 446 4 Canada 700<br />
New<br />
5 Germany 1099 5 Zealand 356 5 Germany 653<br />
New<br />
6 New Zealand 874 6 France 289 6 Zealand 518<br />
7 France 780 7 China 279 7 France 491<br />
8 Japan 737 7 Japan 279 8 Japan 458<br />
9 Netherlands 388 9 South Africa 156 9 Netherlands 250<br />
10 South Africa 353 10 Netherlands 138 10 Italy 224<br />
Information Science and Computer Science<br />
1998-2007 1998-2002 2003-2007<br />
# Country<br />
Co-<br />
Publications # Country<br />
Co-<br />
Publications # Country<br />
Co-<br />
Publications<br />
1 USA 1048 1 USA 467 1 USA 581<br />
2 China 611 2 UK 229 2 China 463<br />
3 UK 551 3 China 148 3 UK 322<br />
4 Germany 341 4 Germany 131 4 Germany 210<br />
5 Canada 256 5 Canada 110 5 Singapore 156<br />
6 Singapore 241 6 Singapore 85 6 Canada 146<br />
7 France 185 7 Japan 71 7 France 124<br />
8 Japan 168 8 France 61 8 Netherlands 103<br />
New<br />
9 Netherlands 141 9 Zealand 45 9 Japan 97<br />
10 Italy 118 10 Netherlands 38 10 Italy 81<br />
69
Central Library<br />
Engineering Science<br />
1998-2007 1998-2002 2003-2007<br />
# Country<br />
Co-<br />
Publications # Country<br />
Co-<br />
Publications # Country<br />
Co-<br />
Publications<br />
1 USA 2190 1 USA 1004 1 USA 1186<br />
2 China 1390 2 UK 481 2 China 1017<br />
3 UK 1234 3 China 373 3 UK 753<br />
4 Japan 641 4 Japan 267 4 Japan 374<br />
5 Canada 617 5 Canada 259 5 Canada 358<br />
6 Singapore 530 6 Singapore 209 6 Singapore 321<br />
7 Germany 504 7 Germany 203 7 Germany 301<br />
8 France 464 8 France 193 8 France 271<br />
South<br />
9 Sweden 262 9 Sweden 108 9 Korea 170<br />
New<br />
10 South Korea 247 10 Italy 96 10 Zealand 163<br />
Materials<br />
Science<br />
1998-2007 1998-2002 2003-2007<br />
# Country<br />
Co-<br />
Publications # Country<br />
Co-<br />
Publications # Country<br />
Co-<br />
Publications<br />
1 China 772 1 USA 287 1 China 583<br />
2 USA 714 2 Japan 208 2 USA 427<br />
3 UK 442 3 China 189 3 UK 259<br />
4 Japan 385 4 UK 183 4 Germany 222<br />
5 Germany 366 5 Germany 144 5 Japan 177<br />
6 Singapore 254 6 Singapore 120 6 Singapore 134<br />
7 Canada 168 7 France 63 7 Canada 106<br />
8 France 164 8 Canada 62 8 France 101<br />
9 South Korea 133 9<br />
South<br />
Korea 46 9<br />
10 New Zealand 131 10 Sweden 43 10<br />
New<br />
10 Zealand 43<br />
New<br />
Zealand 88<br />
South<br />
Korea 87<br />
Mathematics<br />
1998-2007 1998-2002 2003-2007<br />
# Country<br />
Co-<br />
Publications # Country<br />
Co-<br />
Publications # Country<br />
Co-<br />
Publications<br />
1 USA 1097 1 USA 513 1 USA 584<br />
2 UK 668 2 UK 317 2 China 444<br />
3 China 654 3 China 210 3 UK 351<br />
4 Canada 374 4 Canada 181 4 Canada 193<br />
5 Germany 286 5 Germany 140 5 Germany 146<br />
New<br />
6 Spain 172 6 Zealand 77 6 France 82<br />
New<br />
7 New Zealand 159 7 France 74 6 Zealand 82<br />
8 France 156 8 Italy 66 8 Spain 70<br />
9 Italy 129 9 Russia 64 9 Singapore 66<br />
10 Russia 116 10 Japan 56 10 Italy 63<br />
10 Netherlands 56<br />
70
Central Library<br />
Medicine<br />
1998-2007 1998-2002 2003-2007<br />
# Country<br />
Co-<br />
Publications # Country<br />
Co-<br />
Publications # Country<br />
Co-<br />
Publications<br />
1 USA 16331 1 USA 6269 1 USA 10062<br />
2 UK 10588 2 UK 3868 2 UK 6720<br />
3 Canada 4177 3 Canada 1424 3 Canada 2753<br />
4 Germany 4000 4 Germany 1326 4 Germany 2674<br />
New<br />
5 France 2633 5 Zealand 949 5 France 1730<br />
New<br />
6 New Zealand 2630 6 Japan 927 6 Zealand 1681<br />
7 Italy 2188 7 France 903 7 Italy 1523<br />
8 Japan 2124 8 Italy 665 8 Netherlands 1397<br />
9 Netherlands 2054 9 Sweden 659 9 China 1283<br />
10 Switzerland 1857 10 Netherlands 657 10 Switzerland 1210<br />
Multidisciplinary Journals<br />
1998-2007 1998-2002 2003-2007<br />
# Country<br />
Co-<br />
Publications # Country<br />
Co-<br />
Publications # Country<br />
Co-<br />
Publications<br />
1 USA 863 1 USA 346 1 USA 517<br />
2 UK 384 2 UK 154 2 UK 230<br />
3 Germany 197 3 Germany 73 3 Germany 124<br />
4 France 132 4 France 44 4 France 88<br />
5 Canada 119 5 Japan 43 5 Canada 77<br />
6 China 105 6 Canada 42 6 China 74<br />
7 Japan 101 6 Sweden 42 7 Japan 58<br />
New<br />
8 Sweden 88 8 China 31 8 Zealand 51<br />
9 Netherlands 73 9 South Africa 27 9 Netherlands 50<br />
10 Italy 69 10 Italy 23 10 Italy 46<br />
10 Netherlands 23 10 Sweden 46<br />
Nanotechnology<br />
1998-2007 1998-2002 2003-2007<br />
# Country<br />
Co-<br />
Publications # Country<br />
Co-<br />
Publications # Country<br />
Co-<br />
Publications<br />
1 USA 107 1 USA 38 1 USA 69<br />
2 UK 62 2 UK 21 2 UK 41<br />
3 Germany 45 3 Japan 20 3 Germany 29<br />
4 Japan 44 4 Germany 16 4 Japan 24<br />
5 Canada 22 5 China 15 5 Canada 16<br />
6 South Korea 21 6 Canada 6 5 Taiwan 16<br />
South<br />
7 Taiwan 18 6 Singapore 6 5<br />
8 New Zealand 16 8 Russia 5 5<br />
Korea 16<br />
New<br />
Zealand 16<br />
9 China 15 8<br />
South<br />
Korea 5 9 France 12<br />
10 France 14 10 Israel 4 10 Iran 8<br />
71
Central Library<br />
Physics<br />
1998-2007 1998-2002 2003-2007<br />
# Country<br />
Co-<br />
Publications # Country<br />
Co-<br />
Publications # Country<br />
Co-<br />
Publications<br />
1 USA 5272 1 USA 2367 1 USA 2905<br />
2 UK 2707 2 UK 1216 2 UK 1491<br />
3 Germany 2001 3 Germany 794 3 Germany 1207<br />
4 China 1519 4 Japan 594 4 China 1074<br />
5 Japan 1396 5 France 467 5 Japan 802<br />
6 France 1085 6 China 445 6 France 618<br />
7 Canada 929 7 Canada 382 7 Canada 547<br />
8 Italy 744 8 Italy 306 8 Italy 438<br />
9 Russia 702 9 Russia 267 9 Russia 435<br />
10 Switzerland 574 10 Netherlands 242 10 Switzerland 387<br />
China<br />
Agricultural Science<br />
1998-2007 1998-2002 2003-2007<br />
# Country<br />
Co-<br />
Publications # Country<br />
Co-<br />
Publications # Country<br />
Co-<br />
Publications<br />
1 USA 1369 1 USA 315 1 USA 1054<br />
2 Japan 622 2 Japan 165 2 Japan 457<br />
3 Canada 393 3 UK 105 3 Canada 306<br />
4 Australia 315 4 Canada 87 4 Australia 248<br />
5 UK 265 5 Australia 67 5 Germany 185<br />
6 Germany 246 6 Germany 61 6 UK 160<br />
7 Netherlands 140 7 Netherlands 38 7 Netherlands 102<br />
South<br />
7 South Korea 114 8 Philippines 26 8 Korea 92<br />
7 France 110 9 France 24 9 France 86<br />
South<br />
7 Philippines 92 10 Korea 22 10 Philippines 66<br />
Biology and Biotechnology<br />
1998-2007 1998-2002 2003-2007<br />
# Country<br />
Co-<br />
Publications # Country<br />
Co-<br />
Publications # Country<br />
Co-<br />
Publications<br />
1 USA 7599 1 USA 1877 1 USA 5722<br />
2 Japan 2611 2 Japan 836 2 Japan 1775<br />
3 UK 1840 3 UK 552 3 UK 1288<br />
4 Germany 1495 4 Germany 416 4 Germany 1079<br />
5 Canada 1109 5 Australia 266 5 Canada 867<br />
6 Australia 1038 6 Canada 242 6 Australia 772<br />
7 France 814 7 France 224 7 France 590<br />
South<br />
8 South Korea 491 8 Netherlands 120 8 Korea 403<br />
9 Singapore 441 9 Taiwan 112 9 Singapore 358<br />
10 Netherlands 401 10 Sweden 107 10 Netherlands 281<br />
72
Central Library<br />
Chemistry<br />
1998-2007 1998-2002 2003-2007<br />
# Country<br />
Co-<br />
Publications # Country<br />
Co-<br />
Publications # Country<br />
Co-<br />
Publications<br />
1 USA 5249 1 USA 1641 1 USA 3608<br />
2 Japan 3752 2 Japan 1319 2 Japan 2433<br />
3 Germany 1846 3 Germany 600 3 Germany 1246<br />
4 UK 1210 4 UK 389 4 UK 821<br />
5 France 897 5 Hong Kong 285 5 France 662<br />
6 Canada 889 6 Canada 237 6 Canada 652<br />
South<br />
7 South Korea 789 7 France 235 7 Korea 651<br />
8 Singapore 782 8 Singapore 223 8 Singapore 559<br />
9 Australia 722 9 Australia 179 9 Australia 543<br />
10 Taiwan 554 10 Taiwan 177 10 Taiwan 377<br />
Energy<br />
1998-2007 1998-2002 2003-2007<br />
# Country<br />
Co-<br />
Publications # Country<br />
Co-<br />
Publications # Country<br />
Co-<br />
Publications<br />
1 USA 556 1 USA 182 1 USA 374<br />
2 Japan 417 2 Japan 145 2 Japan 272<br />
3 Germany 202 3 Germany 77 3 Germany 125<br />
4 Canada 160 4 UK 49 4 Canada 118<br />
5 UK 159 5 Italy 46 5 UK 110<br />
South<br />
6 Australia 96 6 Russia 43 6 Korea 77<br />
7 Italy 94 7 Canada 42 7 France 57<br />
8 South Korea 93 8 Australia 40 8 Australia 56<br />
9 Russia 89 9 Sweden 30 9 Italy 48<br />
10 France 85 10 France 28 10 Russia 46<br />
Geoscience<br />
1998-2007 1998-2002 2003-2007<br />
# Country<br />
Co-<br />
Publications # Country<br />
Co-<br />
Publications # Country<br />
Co-<br />
Publications<br />
1 USA 4612 1 USA 1119 1 USA 3493<br />
2 Japan 1798 2 Japan 524 2 Japan 1274<br />
3 UK 1235 3 Germany 363 3 UK 881<br />
4 Australia 1155 4 UK 354 4 Australia 876<br />
5 Germany 1078 5 Australia 279 5 Canada 745<br />
6 Canada 996 6 Canada 251 6 Germany 715<br />
7 France 633 7 France 204 7 France 429<br />
South<br />
8 South Korea 321 8 Netherlands 84 8 Korea 262<br />
9 Taiwan 307 9 Taiwan 75 9 Taiwan 232<br />
10 Netherlands 275 10 Russia 71 10 Netherlands 191<br />
73
Central Library<br />
Information Science and Computer Science<br />
1998-2007 1998-2002 2003-2007<br />
# Country<br />
Co-<br />
Publications # Country<br />
Co-<br />
Publications # Country<br />
Co-<br />
Publications<br />
1 USA 2566 1 USA 666 1 USA 1900<br />
2 UK 759 2 Canada 184 2 UK 618<br />
3 Canada 695 3 Japan 153 3 Singapore 521<br />
4 Singapore 635 4 Australia 148 4 Canada 511<br />
5 Japan 617 5 UK 141 5 Japan 464<br />
6 Australia 611 6 Singapore 114 6 Australia 463<br />
7 Germany 307 7 Germany 88 7 Germany 219<br />
South<br />
8 South Korea 219 8 Hong Kong 75 8 Korea 179<br />
9 France 214 9 France 44 9 France 170<br />
South<br />
10 Taiwan 193 10 Korea 40 10 Taiwan 155<br />
Engineering Science<br />
1998-2007 1998-2002 2003-2007<br />
# Country<br />
Co-<br />
Publications # Country<br />
Co-<br />
Publications # Country<br />
Co-<br />
Publications<br />
1 USA 5811 1 USA 1800 1 USA 4011<br />
2 Japan 2836 2 Japan 947 2 Japan 1889<br />
3 UK 2324 3 UK 702 3 UK 1622<br />
4 Singapore 1625 4 Canada 454 4 Singapore 1203<br />
5 Canada 1577 5 Germany 424 5 Canada 1123<br />
6 Australia 1387 6 Singapore 422 6 Australia 1014<br />
7 Germany 1209 7 Australia 373 7 Germany 785<br />
South<br />
8 South Korea 726 8 Hong Kong 242 8 Korea 542<br />
9 France 665 9 France 187 9 France 478<br />
South<br />
10 Taiwan 471 10 Korea 184 10 Taiwan 345<br />
Materials<br />
Science<br />
1998-2007 1998-2002 2003-2007<br />
# Country<br />
Co-<br />
Publications # Country<br />
Co-<br />
Publications # Country<br />
Co-<br />
Publications<br />
1 Japan 2663 1 Japan 943 1 USA 1832<br />
2 USA 2648 2 USA 816 2 Japan 1720<br />
3 Germany 1211 3 Germany 444 3 Germany 767<br />
4 UK 918 4 UK 310 4 UK 608<br />
5 Australia 770 5 Singapore 240 5 Australia 581<br />
South<br />
6 Malaysia 738 6 Korea 213 6 Malaysia 572<br />
South<br />
7 South Korea 710 7 Australia 189 7 Korea 497<br />
8 Singapore 697 8 Hong Kong 167 8 Singapore 457<br />
9 France 560 9 Malaysia 166 9 France 401<br />
10 Canada 430 10 France 159 10 Canada 315<br />
74
Central Library<br />
Mathematics<br />
1998-2007 1998-2002 2003-2007<br />
# Country<br />
Co-<br />
Publications # Country<br />
Co-<br />
Publications # Country<br />
Co-<br />
Publications<br />
1 USA 3064 1 USA 1023 1 USA 2041<br />
2 Canada 926 2 Canada 264 2 Canada 662<br />
3 UK 694 3 Germany 256 3 UK 476<br />
4 Australia 653 4 UK 218 4 Australia 443<br />
5 Germany 627 5 Japan 213 5 Germany 371<br />
6 Japan 570 6 Australia 210 6 Japan 357<br />
7 Singapore 401 7 France 132 7 Singapore 285<br />
South<br />
8 South Korea 392 8 Hong Kong 129 8 Korea 281<br />
9 France 390 9 Singapore 116 9 France 258<br />
South<br />
10 Taiwan 347 10 Korea 111 10 Taiwan 253<br />
Medicine<br />
1998-2007 1998-2002 2003-2007<br />
# Country<br />
Co-<br />
Publications # Country<br />
Co-<br />
Publications # Country<br />
Co-<br />
Publications<br />
1 USA 12273 1 USA 3247 1 USA 9026<br />
2 Japan 3715 2 Japan 1194 2 Japan 2521<br />
3 UK 2855 3 UK 875 3 UK 1980<br />
4 Germany 1736 4 Germany 504 4 Australia 1282<br />
5 Australia 1726 5 Australia 444 5 Germany 1232<br />
6 Canada 1604 6 Canada 416 6 Canada 1188<br />
7 France 1105 7 France 275 7 France 830<br />
South<br />
8 Sweden 851 8 Sweden 273 8 Korea 612<br />
9 South Korea 760 9 Hong Kong 204 9 Singapore 608<br />
10 Singapore 740 10 Taiwan 179 10 Sweden 578<br />
Multidisciplinary Journals<br />
1998-2007 1998-2002 2003-2007<br />
# Country<br />
Co-<br />
Publications # Country<br />
Co-<br />
Publications # Country<br />
Co-<br />
Publications<br />
1 USA 1004 1 USA 371 1 USA 633<br />
2 UK 221 2 Japan 67 2 UK 160<br />
3 Japan 199 3 Germany 63 3 Japan 132<br />
4 Germany 193 4 UK 61 4 Germany 130<br />
5 France 124 5 France 44 5 Canada 85<br />
6 Canada 116 6 Australia 31 6 France 80<br />
7 Australia 105 6 Canada 31 7 Australia 74<br />
8 Taiwan 64 8 Taiwan 27 8 Taiwan 37<br />
South<br />
9 Sweden 45 9 Korea 13 9 Sweden 34<br />
10 Singapore 42 10 Hong Kong 12 10 Singapore 33<br />
75
Central Library<br />
Nanotechnology<br />
1998-2007 1998-2002 2003-2007<br />
# Country<br />
Co-<br />
Publications # Country<br />
Co-<br />
Publications # Country<br />
Co-<br />
Publications<br />
1 USA 496 1 USA 86 1 USA 410<br />
2 Japan 295 2 Japan 56 2 Japan 239<br />
3 Germany 178 3 Germany 50 3 Germany 128<br />
4 UK 144 4 UK 36 4 UK 108<br />
5 Singapore 118 5 Singapore 24 5 Singapore 94<br />
South<br />
6 Australia 97 6 Korea 23 6 Australia 82<br />
South<br />
7 South Korea 96 7 France 17 7 Korea 73<br />
8 France 77 8 Australia 15 8 France 60<br />
9 Canada 47 9 Hong Kong 12 9 Canada 39<br />
10 Sweden 30 10 Belgium 10 10 Sweden 27<br />
Physics<br />
1998-2007 1998-2002 2003-2007<br />
# Country<br />
Co-<br />
Publications # Country<br />
Co-<br />
Publications # Country<br />
Co-<br />
Publications<br />
1 USA 9932 1 USA 3232 1 USA 6700<br />
2 Japan 4562 2 Japan 1665 2 Japan 2897<br />
3 Germany 4197 3 Germany 1626 3 Germany 2571<br />
4 UK 2744 4 UK 892 4 UK 1852<br />
5 France 2168 5 France 727 5 France 1441<br />
6 Russia 1798 6 Italy 682 6 Russia 1210<br />
7 South Korea 1657 7 Russia 588 7 Canada 1205<br />
South<br />
8 Canada 1656 8 Korea 586 8 Singapore 1077<br />
South<br />
9 Italy 1587 9 Taiwan 482 9 Korea 1071<br />
10 Singapore 1541 10 Singapore 464 10 Australia 1070<br />
Iran<br />
Agricultural Science<br />
1998-2007 1998-2002 2003-2007<br />
# Country<br />
Co-<br />
Publications # Country<br />
Co-<br />
Publications # Country<br />
Co-<br />
Publications<br />
1 Canada 114 1 Canada 22 1 Canada 92<br />
2 USA 97 2 USA 18 2 USA 79<br />
3 Australia 59 3 Australia 15 3 UK 45<br />
4 UK 57 4 UK 12 4 Australia 44<br />
5 India 31 5 India 7 5 India 24<br />
6 France 24 6 Japan 5 6 France 23<br />
7 Japan 23 7 South Africa 3 7 Japan 18<br />
8 Netherlands 20 7 Netherlands 3 8 Netherlands 17<br />
9 Belgium 18 7 Belgium 3 9 Belgium 15<br />
10 Germany 17 7 Germany 3 10 Germany 14<br />
10 Malaysia 14<br />
76
Central Library<br />
Biology and Biotechnology<br />
1998-2007 1998-2002 2003-2007<br />
# Country<br />
Co-<br />
Publications # Country<br />
Co-<br />
Publications # Country<br />
Co-<br />
Publications<br />
1 USA 224 1 UK 54 1 USA 174<br />
2 UK 219 2 USA 50 2 UK 165<br />
3 Canada 129 3 Canada 28 3 Canada 101<br />
4 Germany 105 4 Australia 27 4 Germany 90<br />
5 France 99 5 Japan 16 5 France 84<br />
6 Australia 91 6 Germany 15 6 Australia 64<br />
7 Japan 72 6 France 15 7 Japan 56<br />
8 Netherlands 55 8 Belgium 13 8 Netherlands 50<br />
9 India 52 9 Russia 9 9 India 43<br />
10 Italy 42 9 India 9 10 Italy 35<br />
Chemistry<br />
1998-2007 1998-2002 2003-2007<br />
# Country<br />
Co-<br />
Publications # Country<br />
Co-<br />
Publications # Country<br />
Co-<br />
Publications<br />
1 USA 231 1 UK 70 1 USA 183<br />
2 UK 203 2 Canada 50 2 Germany 143<br />
3 Germany 173 3 USA 48 3 UK 133<br />
4 Canada 171 4 Australia 38 4 Canada 121<br />
5 Australia 106 5 Germany 30 5 France 76<br />
6 France 89 6 Taiwan 17 6 Australia 68<br />
7 Italy 62 6 India 17 7 Italy 51<br />
8 Sweden 51 8 France 13 8 China 46<br />
9 China 47 9 Italy 11 9 Sweden 44<br />
10 India 45 9 Japan 11 10 India 28<br />
Energy<br />
1998-2007 1998-2002 2003-2007<br />
# Country<br />
Co-<br />
Publications # Country<br />
Co-<br />
Publications # Country<br />
Co-<br />
Publications<br />
1 USA 58 1 USA 19 1 USA 39<br />
2 Canada 36 2 Canada 10 2 Canada 26<br />
3 UK 32 2 UK 10 3 UK 22<br />
4 Australia 11 4 France 3 4 Italy 10<br />
4 Italy 11 4 Japan 3 5 Australia 9<br />
6 France 6 6 Australia 2 6 Norway 5<br />
7 Belgium 5 6 Germany 2 6 China 5<br />
7 Germany 5 6 Qatar 2 8 Kuwait 4<br />
7 Japan 5 6 Austria 2 8 Belgium 4<br />
7 Norway 5 8 Switzerland 4<br />
7 China 5<br />
7 Switzerland 5<br />
77
Central Library<br />
Geoscience<br />
1998-2007 1998-2002 2003-2007<br />
# Country<br />
Co-<br />
Publications # Country<br />
Co-<br />
Publications # Country<br />
Co-<br />
Publications<br />
1 USA 183 1 USA 60 1 USA 123<br />
2 UK 145 2 Canada 35 2 UK 111<br />
3 Canada 122 3 UK 34 3 Canada 87<br />
4 France 86 4 Australia 19 4 France 77<br />
5 Australia 68 5 Germany 11 5 Germany 57<br />
6 Germany 68 6 Netherlands 11 6 Australia 49<br />
7 Japan 37 7 France 9 7 Japan 30<br />
8 Netherlands 29 8 Japan 7 8 Sweden 18<br />
9 Sweden 24 9 Sweden 6 9 Netherlands 18<br />
10 India 20 10 India 6 10 Switzerland 17<br />
Information Science and Computer Science<br />
1998-2007 1998-2002 2003-2007<br />
# Country<br />
Co-<br />
Publications # Country<br />
Co-<br />
Publications # Country<br />
Co-<br />
Publications<br />
1 USA 100 1 USA 32 1 USA 68<br />
2 Canada 83 2 UK 16 2 Canada 67<br />
3 UK 77 2 Canada 16 3 UK 61<br />
4 Australia 30 4 Australia 12 4 Australia 18<br />
5 Germany 18 5 Germany 3 5 Germany 15<br />
6 France 17 5 Japan 3 5 France 15<br />
7 Japan 13 7 Switzerland 2 7 Japan 10<br />
8 Italy 11 7 Italy 2 7 Netherlands 10<br />
8 Netherlands 11 7 France 2 9 Italy 9<br />
South<br />
10 South Korea 6 7 Yugoslavia 2 10 Korea 6<br />
Engineering Science<br />
1998-2007 1998-2002 2003-2007<br />
# Country<br />
Co-<br />
Publications # Country<br />
Co-<br />
Publications # Country<br />
Co-<br />
Publications<br />
1 Canada 516 1 USA 141 1 Canada 389<br />
2 USA 420 2 Canada 127 2 USA 279<br />
3 UK 347 3 UK 108 3 UK 239<br />
4 Australia 131 4 Australia 47 4 Australia 84<br />
5 Germany 96 5 France 24 5 Germany 79<br />
6 Japan 85 6 Japan 23 6 Japan 62<br />
7 France 84 7 Germany 17 7 France 60<br />
8 India 45 8 India 11 8 India 34<br />
9 Netherlands 37 9 Netherlands 8 9 Netherlands 29<br />
10 Switzerland 29 10 Qatar 7 10 Switzerland 24<br />
78
Central Library<br />
Materials<br />
Science<br />
1998-2007 1998-2002 2003-2007<br />
# Country<br />
Co-<br />
Publications # Country<br />
Co-<br />
Publications # Country<br />
Co-<br />
Publications<br />
1 Canada 129 1 USA 34 1 Canada 107<br />
2 USA 122 2 UK 30 2 USA 88<br />
3 UK 72 3 Canada 22 3 UK 42<br />
4 Australia 31 4 Australia 13 4 Germany 20<br />
5 Germany 23 5 France 4 5 Australia 18<br />
6 France 22 5 Sweden 4 6 France 18<br />
7 India 13 7 Italy 3 7 China 13<br />
7 China 13 7 India 3 8 Kuwait 12<br />
9 Italy 12 7 Germany 3 9<br />
9 Kuwait 12 10<br />
9 South Korea 12<br />
South<br />
Korea 11<br />
New<br />
Zealand 2 10 India 10<br />
Mathematics<br />
1998-2007 1998-2002 2003-2007<br />
# Country<br />
Co-<br />
Publications # Country<br />
Co-<br />
Publications # Country<br />
Co-<br />
Publications<br />
1 UK 183 1 UK 53 1 UK 130<br />
2 Canada 109 2 Canada 27 2 Canada 82<br />
3 USA 62 3 USA 13 3 USA 49<br />
4 Australia 55 4 Australia 12 4 Germany 47<br />
5 Germany 51 5 Malaysia 8 5 France 43<br />
6 France 47 6 Japan 7 5 Australia 43<br />
7 Japan 37 7 France 4 7 Japan 30<br />
8 Malaysia 34 7 Germany 4 8 Malaysia 26<br />
9 Switzerland 21 9 Austria 3 9 Switzerland 19<br />
10 Italy 20 9 Italy 3 10 Italy 17<br />
9 India 3<br />
New<br />
9 Zealand 3<br />
Medicine<br />
1998-2007 1998-2002 2003-2007<br />
# Country<br />
Co-<br />
Publications # Country<br />
Co-<br />
Publications # Country<br />
Co-<br />
Publications<br />
1 USA 610 1 UK 138 1 USA 483<br />
2 UK 475 2 USA 127 2 UK 337<br />
3 Canada 243 3 Canada 53 3 Canada 190<br />
4 Australia 142 4 Australia 31 4 Australia 111<br />
5 Japan 111 5 Italy 30 5 Sweden 90<br />
6 Germany 110 6 Japan 28 6 Germany 89<br />
7 Sweden 106 7 France 23 7 Japan 83<br />
8 France 99 8 Germany 21 8 France 76<br />
9 Italy 94 9 India 18 9 Italy 64<br />
10 Switzerland 50 10 Sweden 16 10 Russia 41<br />
79
Central Library<br />
Multidisciplinary Journals<br />
1998-2007 1998-2002 2003-2007<br />
# Country<br />
Co-<br />
Publications # Country<br />
Co-<br />
Publications # Country<br />
Co-<br />
Publications<br />
1 USA 30 1 USA 14 1 Canada 17<br />
2 UK 24 2 UK 11 2 USA 16<br />
3 Canada 21 3 Australia 5 3 UK 13<br />
4 Australia 9 4 Canada 4 4 India 6<br />
4 India 9 5 India 3 5 Japan 5<br />
6 France 5 5 Russia 3 6 Australia 4<br />
6 Japan 5 7 Sweden 2 6 France 4<br />
8 Germany 3 8 Netherlands 2<br />
8 Netherlands 3 8 Germany 2<br />
8 Russia 3<br />
8 Sweden 3<br />
Nanotechnology<br />
1998-2007 1998-2002 2003-2007<br />
# Country<br />
Co-<br />
Publications # Country<br />
Co-<br />
Publications # Country<br />
Co-<br />
Publications<br />
1 Canada 9 1 UK 3 1 Canada 8<br />
1 UK 9 1 Germany 8<br />
3 Germany 8 1 Australia 8<br />
3 Australia 8 1 USA 8<br />
3 USA 8 5 UK 6<br />
6 France 6 5 France 6<br />
7 Japan 5 7 Japan 5<br />
7 India 5 8 Switzerland 4<br />
9 Switzerland 4 8 India 4<br />
Physics<br />
1998-2007 1998-2002 2003-2007<br />
# Country<br />
Co-<br />
Publications # Country<br />
Co-<br />
Publications # Country<br />
Co-<br />
Publications<br />
1 USA 301 1 USA 94 1 USA 207<br />
2 UK 215 2 Canada 66 2 UK 149<br />
3 Canada 207 2 UK 66 3 Canada 141<br />
4 Germany 136 4 Italy 36 4 Germany 108<br />
5 France 128 5 Germany 28 5 France 107<br />
6 Italy 102 6 France 21 6 Italy 66<br />
Rep of<br />
7 Japan 76 7 Georgia 17 7 Japan 64<br />
8 Russia 62 8 India 16 8 Australia 50<br />
9 India 61 9 Russia 14 9 Russia 48<br />
10 Australia 56 10 Japan 12 10 India 45<br />
10 Azerbaijan 12<br />
10 Turkey 12<br />
80
Central Library<br />
Japan<br />
Agricultural Science<br />
1998-2007 1998-2002 2003-2007<br />
# Country<br />
Co-<br />
Publications # Country<br />
Co-<br />
Publications # Country<br />
Co-<br />
Publications<br />
1 USA 1135 1 USA 463 1 USA 672<br />
2 China 622 2 China 165 2 China 457<br />
South<br />
South<br />
3 South Korea 440 3 Korea 160 3 Korea 280<br />
4 Thailand 381 4 Thailand 125 4 Thailand 256<br />
5 Canada 230 5 UK 95 5 Canada 142<br />
6 UK 217 6 Canada 88 6 UK 122<br />
7 Philippines 184 7 Philippines 65 7 Philippines 119<br />
8 Australia 180 8 Indonesia 64 8 Australia 118<br />
9 Germany 172 9 Australia 62 9 Germany 113<br />
10 Indonesia 168 10 India 59 10 Indonesia 104<br />
10 Germany 59<br />
Biology and Biotechnology<br />
1998-2007 1998-2002 2003-2007<br />
# Country<br />
Co-<br />
Publications # Country<br />
Co-<br />
Publications # Country<br />
Co-<br />
Publications<br />
1 USA 15480 1 USA 7077 1 USA 8403<br />
2 UK 3027 2 UK 1299 2 China 1775<br />
3 China 2611 3 Germany 1054 3 UK 1728<br />
4 Germany 2507 4 China 836 4 Germany 1453<br />
South<br />
5 France 1736 5 France 756 5 Korea 1063<br />
6 Canada 1694 6 Canada 735 6 France 980<br />
South<br />
7 South Korea 1679 7 Korea 616 7 Canada 959<br />
8 Australia 1320 8 Australia 534 8 Australia 786<br />
9 Thailand 923 9 Sweden 335 9 Thailand 605<br />
10 Netherlands 715 10 Thailand 318 10 Netherlands 418<br />
Chemistry<br />
1998-2007 1998-2002 2003-2007<br />
# Country<br />
Co-<br />
Publications # Country<br />
Co-<br />
Publications # Country<br />
Co-<br />
Publications<br />
1 USA 5890 1 USA 2737 1 USA 3153<br />
2 China 3756 2 China 1319 2 China 2437<br />
South<br />
3 Germany 1828 3 Germany 850 3 Korea 1009<br />
South<br />
4 South Korea 1711 4 Korea 702 4 Germany 978<br />
5 UK 1422 5 UK 697 5 France 768<br />
6 France 1305 6 France 537 6 UK 725<br />
7 India 901 7 Russia 395 7 India 602<br />
8 Russia 832 8 Canada 388 8 Russia 437<br />
9 Canada 780 9 India 299 9 Canada 392<br />
10 Italy 608 10 Italy 251 10 Thailand 363<br />
81
Central Library<br />
Energy<br />
1998-2007 1998-2002 2003-2007<br />
# Country<br />
Co-<br />
Publications # Country<br />
Co-<br />
Publications # Country<br />
Co-<br />
Publications<br />
1 USA 1352 1 USA 664 1 USA 688<br />
2 Germany 677 2 Germany 345 2 Germany 332<br />
3 Russia 521 3 Russia 238 3 Russia 283<br />
4 China 419 4 China 145 4 China 274<br />
5 France 280 5 UK 132 5 France 168<br />
South<br />
6 UK 273 6 Italy 115 6 Korea 163<br />
7 South Korea 256 7 France 112 7 UK 141<br />
South<br />
8 Italy 236 8 Korea 93 8 Switzerland 122<br />
9 Switzerland 194 9 Switzerland 72 9 Italy 121<br />
10 Australia 176 10 Australia 61 10 Australia 115<br />
Geoscience<br />
1998-2007 1998-2002 2003-2007<br />
# Country<br />
Co-<br />
Publications # Country<br />
Co-<br />
Publications # Country<br />
Co-<br />
Publications<br />
1 USA 4510 1 USA 1782 1 USA 2728<br />
2 China 1800 2 China 524 2 China 1276<br />
3 Germany 1067 3 Germany 413 3 UK 660<br />
4 UK 1017 4 UK 357 4 Germany 654<br />
5 France 807 5 Russia 319 5 France 514<br />
6 Canada 747 6 Canada 302 6 Australia 458<br />
7 Russia 745 7 France 293 7 Canada 445<br />
8 Australia 737 8 Australia 279 8 Russia 426<br />
9 South Korea 582 9 India 176 9<br />
10 India 435 10<br />
South<br />
Korea 423<br />
South<br />
Korea 159 10 India 259<br />
Information Science and Computer Science<br />
1998-2007 1998-2002 2003-2007<br />
# Country<br />
Co-<br />
Publications # Country<br />
Co-<br />
Publications # Country<br />
Co-<br />
Publications<br />
1 USA 1352 1 USA 642 1 USA 710<br />
2 China 617 2 China 153 2 China 464<br />
3 Germany 338 3 Germany 137 3 Germany 201<br />
South<br />
4 UK 282 4 Canada 123 4 Korea 169<br />
5 Canada 276 5 UK 122 5 UK 160<br />
South<br />
6 South Korea 252 6 Korea 83 6 Canada 153<br />
7 France 198 7 France 80 7 France 118<br />
8 Australia 168 8 Australia 71 8 Australia 97<br />
9 Italy 102 9 Netherlands 52 9 Taiwan 70<br />
10 Taiwan 98 10 Singapore 39 10 Italy 63<br />
10 Italy 39<br />
82
Central Library<br />
Engineering Science<br />
1998-2007 1998-2002 2003-2007<br />
# Country<br />
Co-<br />
Publications # Country<br />
Co-<br />
Publications # Country<br />
Co-<br />
Publications<br />
1 USA 5572 1 USA 2686 1 USA 2886<br />
2 China 2849 2 China 947 2 China 1902<br />
South<br />
South<br />
3 South Korea 1774 3 Korea 643 3 Korea 1131<br />
4 Germany 1235 4 UK 587 4 Germany 685<br />
5 UK 970 5 Germany 550 5 Canada 469<br />
6 Canada 859 6 Canada 390 6 France 450<br />
7 France 812 7 France 362 7 UK 383<br />
8 Russia 692 8 Russia 321 8 Australia 374<br />
9 Australia 641 9 Australia 267 9 Russia 371<br />
10 India 499 10 Italy 221 10 Taiwan 310<br />
Materials<br />
Science<br />
1998-2007 1998-2002 2003-2007<br />
# Country<br />
Co-<br />
Publications # Country<br />
Co-<br />
Publications # Country<br />
Co-<br />
Publications<br />
1 USA 3300 1 USA 1572 1 USA 1728<br />
2 China 2667 2 China 943 2 China 1724<br />
South<br />
3 South Korea 1670 3 Germany 678 3 Korea 1036<br />
South<br />
4 Germany 1347 4 Korea 634 4 Germany 669<br />
5 UK 1079 5 UK 513 5 UK 566<br />
6 France 912 6 France 402 6 France 510<br />
7 Russia 710 7 Russia 327 7 India 391<br />
8 India 634 8 India 243 8 Russia 383<br />
9 Australia 385 9 Australia 208 9 Canada 201<br />
10 Canada 365 10 Canada 164 10 Taiwan 198<br />
Mathematics<br />
1998-2007 1998-2002 2003-2007<br />
# Country<br />
Co-<br />
Publications # Country<br />
Co-<br />
Publications # Country<br />
Co-<br />
Publications<br />
1 USA 1197 1 USA 542 1 USA 655<br />
2 China 570 2 China 212 2 China 358<br />
3 Germany 378 3 Germany 157 3 Germany 221<br />
4 France 312 4 France 130 4 France 182<br />
South<br />
5 Canada 253 5 Canada 117 5 Korea 166<br />
6 South Korea 240 6 UK 98 6 Canada 136<br />
7 UK 217 7 Italy 79 7 UK 119<br />
South<br />
8 Italy 181 8 Korea 74 8 Italy 102<br />
9 Taiwan 118 9 Australia 56 9 Taiwan 86<br />
10 Australia 107 10 Russia 46 10 Spain 63<br />
83
Central Library<br />
Medicine<br />
1998-2007 1998-2002 2003-2007<br />
# Country<br />
Co-<br />
Publications # Country<br />
Co-<br />
Publications # Country<br />
Co-<br />
Publications<br />
1 USA 30927 1 USA 14185 1 USA 16742<br />
2 UK 5132 2 UK 2252 2 UK 2880<br />
3 Germany 4042 3 Germany 1783 3 China 2526<br />
4 China 3720 4 Canada 1334 4 Germany 2259<br />
5 Canada 2825 5 China 1194 5 Canada 1491<br />
6 France 2409 6 France 1010 6 France 1399<br />
South<br />
7 Australia 2124 7 Australia 927 7 Korea 1312<br />
8 South Korea 2047 8 Sweden 780 8 Australia 1197<br />
9 Italy 1818 9 Italy 742 9 Italy 1076<br />
South<br />
10 Sweden 1604 10 Korea 735 10 Netherlands 855<br />
Multidisciplinary Journals<br />
1998-2007 1998-2002 2003-2007<br />
# Country<br />
Co-<br />
Publications # Country<br />
Co-<br />
Publications # Country<br />
Co-<br />
Publications<br />
1 USA 1729 1 USA 775 1 USA 954<br />
2 UK 337 2 UK 128 2 UK 209<br />
3 Germany 259 3 Germany 104 3 Germany 155<br />
4 France 238 4 France 98 4 France 140<br />
5 China 199 5 Canada 72 5 China 132<br />
6 Canada 190 6 China 67 6 Canada 118<br />
7 Australia 101 7 Netherlands 47 7 Australia 58<br />
8 Italy 99 8 Australia 43 8 Italy 57<br />
9 Switzerland 93 9 Italy 42 9 Switzerland 53<br />
10 Netherlands 85 10 Switzerland 40 10 Sweden 48<br />
Nanotechnology<br />
1998-2007 1998-2002 2003-2007<br />
# Country<br />
Co-<br />
Publications # Country<br />
Co-<br />
Publications # Country<br />
Co-<br />
Publications<br />
1 USA 544 1 USA 206 1 USA 338<br />
2 China 296 2 Germany 61 2 China 240<br />
South<br />
3 South Korea 181 3 China 56 3 Korea 144<br />
4 Germany 161 4 UK 54 4 Germany 100<br />
5 UK 141 5 France 42 5 UK 87<br />
South<br />
6 France 116 6 Korea 37 6 France 74<br />
7 India 84 7 Russia 24 7 India 62<br />
8 Russia 62 8 India 22 8 Taiwan 44<br />
9 Taiwan 53 8 Poland 22 9 Russia 38<br />
10 Poland 46 10 Australia 20 10 Canada 26<br />
84
Central Library<br />
Physics<br />
1998-2007 1998-2002 2003-2007<br />
# Country<br />
Co-<br />
Publications # Country<br />
Co-<br />
Publications # Country<br />
Co-<br />
Publications<br />
1 USA 14524 1 USA 6653 1 USA 7871<br />
2 Germany 6497 2 Germany 2947 2 Germany 3550<br />
3 China 4568 3 Russia 2048 3 China 2903<br />
4 Russia 4450 4 UK 1872 4 UK 2425<br />
5 UK 4297 5 China 1665 5 Russia 2402<br />
6 France 3710 6 France 1457 6 France 2253<br />
South<br />
South<br />
7 South Korea 3311 7 Korea 1086 7 Korea 2225<br />
8 Italy 2655 8 Italy 1076 8 Italy 1579<br />
9 Canada 2157 9 Canada 954 9 Canada 1203<br />
10 Switzerland 2013 10 Switzerland 874 10 India 1152<br />
New Zealand<br />
Agricultural Science<br />
1998-2007 1998-2002 2003-2007<br />
# Country<br />
Co-<br />
Publications # Country<br />
Co-<br />
Publications # Country<br />
Co-<br />
Publications<br />
1 USA 641 1 USA 264 1 USA 377<br />
2 Australia 511 2 Australia 210 2 Australia 301<br />
3 UK 282 3 UK 118 3 UK 164<br />
4 Canada 166 4 Canada 78 4 Canada 88<br />
5 France 111 5 France 43 5 France 68<br />
6 Germany 87 6 Germany 39 6 Ireland 55<br />
7 Netherlands 82 7 Netherlands 35 7 Germany 48<br />
8 Ireland 63 8 Denmark 28 8 Netherlands 47<br />
9 Japan 62 8 Japan 28 9 China 35<br />
10 Sweden 56 10 Sweden 22 10 Sweden 34<br />
10 Japan 34<br />
Biology and Biotechnology<br />
1998-2007 1998-2002 2003-2007<br />
# Country<br />
Co-<br />
Publications # Country<br />
Co-<br />
Publications # Country<br />
Co-<br />
Publications<br />
1 USA 1829 1 USA 672 1 USA 1157<br />
2 Australia 1330 2 Australia 473 2 Australia 857<br />
3 UK 1104 3 UK 389 3 UK 715<br />
4 Germany 435 4 Germany 148 4 Germany 287<br />
5 Canada 430 5 Canada 146 5 Canada 284<br />
6 France 294 6 Japan 86 6 France 213<br />
7 Japan 217 7 France 81 7 China 150<br />
8 China 190 8 Sweden 57 8 Japan 131<br />
9 Sweden 176 9 Netherlands 54 9 Sweden 119<br />
10 Netherlands 171 10 Switzerland 44 10 Netherlands 117<br />
85
Central Library<br />
Chemistry<br />
1998-2007 1998-2002 2003-2007<br />
# Country<br />
Co-<br />
Publications # Country<br />
Co-<br />
Publications # Country<br />
Co-<br />
Publications<br />
1 USA 554 1 USA 272 1 USA 282<br />
2 Australia 374 2 Australia 187 2 Australia 187<br />
3 Germany 158 3 UK 119 3 England 131<br />
4 England 131 4 Japan 76 4 Germany 92<br />
5 Japan 130 5 Germany 66 5 Japan 54<br />
6 UK 119 6 Canada 40 6 China 52<br />
7 Canada 82 7 Sweden 34 7 France 42<br />
8 France 67 8 Singapore 27 7 Canada 42<br />
9 China 66 9 France 25 9 Singapore 31<br />
10 Sweden 60 10 Russia 14 10 Scotland 26<br />
10 China 14 10 Sweden 26<br />
Energy<br />
1998-2007 1998-2002 2003-2007<br />
# Country<br />
Co-<br />
Publications # Country<br />
Co-<br />
Publications # Country<br />
Co-<br />
Publications<br />
1 USA 48 1 USA 21 1 USA 27<br />
2 Australia 39 2 Australia 19 2 Australia 20<br />
3 UK 25 3 UK 16 3 UK 9<br />
4 Germany 20 4 Germany 12 4 Germany 8<br />
5 Canada 14 5 Canada 8 4 Japan 8<br />
6 Japan 11 6 India 6 6 Canada 6<br />
South<br />
7 France 6 7 France 5 6 Korea 6<br />
7 India 6 8 Belgium 4 8 Switzerland 4<br />
7 South Korea 6 9 Japan 3 9 Italy 3<br />
10 Italy 5 9 Jordan 3 9 Denmark 3<br />
Geoscience<br />
1998-2007 1998-2002 2003-2007<br />
# Country<br />
Co-<br />
Publications # Country<br />
Co-<br />
Publications # Country<br />
Co-<br />
Publications<br />
1 USA 1368 1 USA 526 1 USA 842<br />
2 Australia 874 2 Australia 356 2 Australia 518<br />
3 UK 810 3 UK 303 3 UK 507<br />
4 Canada 377 4 Canada 166 4 Canada 211<br />
5 Germany 305 5 Germany 119 5 Germany 186<br />
6 Japan 220 6 Japan 95 6 Japan 125<br />
7 France 187 7 France 77 7 France 110<br />
8 China 112 8 Netherlands 46 8 China 86<br />
9 Denmark 109 9 Denmark 30 9 Denmark 79<br />
10 Netherlands 100 10 South Africa 28 10 Switzerland 75<br />
86
Central Library<br />
Information Science and Computer Science<br />
1998-2007 1998-2002 2003-2007<br />
# Country<br />
Co-<br />
Publications # Country<br />
Co-<br />
Publications # Country<br />
Co-<br />
Publications<br />
1 USA 195 1 USA 65 1 USA 130<br />
2 UK 134 2 Australia 45 2 UK 100<br />
3 Germany 104 3 UK 34 3 Germany 88<br />
4 Australia 102 4 Canada 27 4 Australia 57<br />
5 Canada 73 5 Germany 16 5 Canada 46<br />
6 China 41 6 Singapore 10 6 China 31<br />
7 Singapore 37 6 China 10 7 Singapore 27<br />
8 Japan 29 8 Japan 8 8 Japan 21<br />
South<br />
9 South Korea 20 9 Austria 7 9 Korea 17<br />
10 France 19 9 Sweden 7 10 France 15<br />
Engineering Science<br />
1998-2007 1998-2002 2003-2007<br />
# Country<br />
Co-<br />
Publications # Country<br />
Co-<br />
Publications # Country<br />
Co-<br />
Publications<br />
1 USA 392 1 USA 148 1 USA 244<br />
2 UK 310 2 UK 107 2 UK 203<br />
3 Australia 242 3 Australia 82 3 Australia 160<br />
4 China 124 4 China 65 4 Canada 76<br />
5 Canada 120 5 Canada 44 5 Germany 65<br />
6 Germany 101 6 Germany 36 6 China 59<br />
7 Singapore 65 7 Singapore 27 7 Singapore 38<br />
8 Japan 60 8 Japan 26 8 Japan 34<br />
South<br />
9 Sweden 34 9 France 13 9 Korea 28<br />
10 France 33 10 India 11 10 Sweden 26<br />
Materials<br />
Science<br />
1998-2007 1998-2002 2003-2007<br />
# Country<br />
Co-<br />
Publications # Country<br />
Co-<br />
Publications # Country<br />
Co-<br />
Publications<br />
1 USA 153 1 USA 63 1 USA 90<br />
2 Australia 131 2 Australia 43 2 Australia 88<br />
3 UK 114 3 UK 41 3 UK 73<br />
4 China 88 4 Japan 39 4 China 57<br />
5 Japan 65 5 China 31 5 Germany 40<br />
6 Germany 60 6 Germany 20 6 Japan 26<br />
7 Canada 32 7 Canada 19 7<br />
South<br />
Korea 19<br />
8 South Korea 31 8<br />
South<br />
Korea 12 8 Poland 16<br />
9 France 26 8 Singapore 12 8 France 16<br />
10 Sweden 19 10<br />
Mongol Peo<br />
Rep 10 10 Canada 13<br />
10 Sweden 10<br />
10 France 10<br />
87
Central Library<br />
Mathematics<br />
1998-2007 1998-2002 2003-2007<br />
# Country<br />
Co-<br />
Publications # Country<br />
Co-<br />
Publications # Country<br />
Co-<br />
Publications<br />
1 USA 346 1 USA 148 1 USA 346<br />
2 UK 184 2 Australia 77 2 UK 184<br />
3 Australia 159 3 UK 66 3 Australia 159<br />
4 Canada 117 4 Canada 57 4 Canada 117<br />
5 Germany 74 5 Germany 25 5 Germany 74<br />
6 China 44 6 Japan 23 6 China 44<br />
7 Japan 37 7 China 16 7 Japan 37<br />
8 Singapore 33 8 Spain 12 8 Singapore 33<br />
9 Spain 24 8 Singapore 12 9 Spain 24<br />
10 France 23 10 Austria 10 10 France 23<br />
10 Netherlands 23 10 Sweden 10 10 Netherlands 23<br />
Medicine<br />
1998-2007 1998-2002 2003-2007<br />
# Country<br />
Co-<br />
Publications # Country<br />
Co-<br />
Publications # Country<br />
Co-<br />
Publications<br />
1 USA 2961 1 USA 1181 1 USA 1780<br />
2 Australia 2619 2 Australia 949 2 Australia 1670<br />
3 UK 2380 3 UK 844 3 UK 1536<br />
4 Canada 770 4 Canada 265 4 Canada 505<br />
5 Germany 570 5 Germany 209 5 Germany 361<br />
6 France 409 6 Netherlands 131 6 France 285<br />
7 Netherlands 403 7 France 124 7 Netherlands 272<br />
8 Italy 381 8 Japan 122 8 Italy 266<br />
9 Japan 289 9 Italy 115 9 China 183<br />
10 Switzerland 271 10 Sweden 110 10 Belgium 171<br />
Multidisciplinary Journals<br />
1998-2007 1998-2002 2003-2007<br />
# Country<br />
Co-<br />
Publications # Country<br />
Co-<br />
Publications # Country<br />
Co-<br />
Publications<br />
1 USA 153 1 USA 57 1 USA 96<br />
2 UK 111 2 UK 34 2 UK 77<br />
3 Australia 65 3 Australia 14 3 Australia 51<br />
4 Canada 36 4 Germany 11 4 Canada 29<br />
5 Germany 34 5 Japan 7 5 Germany 23<br />
6 Japan 24 5 France 7 6 Sweden 19<br />
7 France 22 5 Canada 7 7 Japan 17<br />
7 Sweden 22 8 South Africa 6 8 France 15<br />
9 China 14 9 Italy 5 9 Denmark 11<br />
9 Switzerland 14 9 China 5 10 Switzerland 10<br />
88
Central Library<br />
Nanotechnology<br />
1998-2007 1998-2002 2003-2007<br />
# Country<br />
Co-<br />
Publications # Country<br />
Co-<br />
Publications # Country<br />
Co-<br />
Publications<br />
1 China 17 1 UK 6 1 Australia 16<br />
2 Australia 16 1 Germany 6 2 China 13<br />
3 UK 15 3 Japan 5 3 UK 9<br />
4 Germany 11 4 China 4 4 USA 7<br />
5 Japan 9 4 Canada 4 5 Germany 5<br />
5 USA 9 6 Netherlands 3 6 Japan 4<br />
7 Canada 4 7 USA 2 6 France 4<br />
7 France 4 7 Singapore 2<br />
7 Netherlands 4 7 Italy 2<br />
10 Singapore 3<br />
Physics<br />
1998-2007 1998-2002 2003-2007<br />
# Country<br />
Co-<br />
Publications # Country<br />
Co-<br />
Publications # Country<br />
Co-<br />
Publications<br />
1 USA 599 1 USA 265 1 USA 334<br />
2 UK 405 2 UK 160 2 UK 245<br />
3 Australia 305 3 Australia 139 3 Australia 166<br />
4 Germany 268 4 Germany 118 4 Germany 150<br />
5 France 143 5 Japan 63 5 France 90<br />
6 Japan 126 6 France 53 6 China 63<br />
7 China 104 7 Canada 43 6 Japan 63<br />
8 Canada 89 8 Netherlands 42 8 Italy 48<br />
9 South Africa 78 9 China 41 9 Spain 46<br />
10 Netherlands 74 10 South Africa 40 9 Canada 46<br />
South<br />
9 Korea 46<br />
South Korea<br />
Agricultural Science<br />
1998-2007 1998-2002 2003-2007<br />
# Country<br />
Co-<br />
Publications # Country<br />
Co-<br />
Publications # Country<br />
Co-<br />
Publications<br />
1 USA 1101 1 USA 336 1 USA 765<br />
2 Japan 440 2 Japan 160 2 Japan 280<br />
3 Canada 144 3 Canada 42 3 Canada 102<br />
4 China 116 4 China 22 4 China 94<br />
5 UK 53 5 UK 21 5 India 40<br />
6 India 49 6 Australia 12 6 UK 32<br />
7 Australia 37 7 Poland 10 7 Germany 28<br />
7 Germany 37 8 India 9 8 Australia 25<br />
9 Netherlands 24 8 Germany 9 9 Netherlands 20<br />
10 Israel 23 10 Sweden 7 10 Thailand 19<br />
10 Poland 23 10 Italy 7<br />
10 Nigeria 7<br />
10 France 7<br />
89
Central Library<br />
Biology and Biotechnology<br />
1998-2007 1998-2002 2003-2007<br />
# Country<br />
Co-<br />
Publications # Country<br />
Co-<br />
Publications # Country<br />
Co-<br />
Publications<br />
1 USA 4496 1 USA 1655 1 USA 2841<br />
2 Japan 1679 2 Japan 616 2 Japan 1063<br />
3 China 491 3 UK 152 3 China 403<br />
4 Canada 379 4 Canada 115 4 Canada 264<br />
4 UK 379 5 Germany 112 4 Germany 264<br />
6 Germany 376 6 China 88 6 UK 227<br />
7 India 209 7 France 56 7 India 183<br />
8 Australia 171 8 Australia 54 8 Australia 117<br />
9 France 163 9 Russia 31 9 Russia 116<br />
10 Russia 147 10 Italy 29 10 France 107<br />
Chemistry<br />
1998-2007 1998-2002 2003-2007<br />
# Country<br />
Co-<br />
Publications # Country<br />
Co-<br />
Publications # Country<br />
Co-<br />
Publications<br />
1 USA 3600 1 USA 1256 1 USA 2344<br />
2 Japan 1711 2 Japan 702 2 Japan 1009<br />
3 China 790 3 China 138 3 China 652<br />
4 India 389 4 Germany 125 4 India 345<br />
5 Germany 349 5 France 109 5 Germany 224<br />
6 Russia 272 6 Russia 107 6 Russia 165<br />
7 France 269 7 Canada 104 7 UK 162<br />
8 Canada 253 8 UK 88 8 France 160<br />
9 UK 250 9 Australia 50 9 Canada 149<br />
10 Australia 169 10 India 44 10 Australia 119<br />
Energy<br />
1998-2007 1998-2002 2003-2007<br />
# Country<br />
Co-<br />
Publications # Country<br />
Co-<br />
Publications # Country<br />
Co-<br />
Publications<br />
1 USA 426 1 USA 139 1 USA 287<br />
2 Japan 256 2 Japan 93 2 Japan 163<br />
3 Russia 97 3 Russia 30 3 China 77<br />
4 China 93 4 Canada 19 4 Russia 67<br />
5 India 63 5 UK 17 5 India 54<br />
6 Germany 57 6 China 16 6 Germany 42<br />
7 Canada 46 7 Germany 15 7 Italy 28<br />
8 Italy 40 8 Switzerland 14 8 Canada 27<br />
9 UK 37 9 Italy 12 9 Australia 26<br />
10 Switzerland 35 10 France 12 10 Taiwan 24<br />
90
Central Library<br />
Geoscience<br />
1998-2007 1998-2002 2003-2007<br />
# Country<br />
Co-<br />
Publications # Country<br />
Co-<br />
Publications # Country<br />
Co-<br />
Publications<br />
1 USA 1949 1 USA 599 1 USA 1350<br />
2 Japan 582 2 Japan 159 2 Japan 423<br />
3 China 324 3 China 59 3 China 265<br />
4 Canada 204 4 Canada 58 4 Canada 146<br />
5 UK 150 5 UK 50 5 UK 100<br />
6 Germany 124 6 Russia 45 6 Germany 92<br />
7 Russia 116 7 Germany 32 7 India 86<br />
8 Australia 105 8 France 28 8 Australia 78<br />
9 India 102 9 Australia 27 9 Russia 71<br />
10 France 94 10 India 16 10 France 66<br />
Information Science and Computer Science<br />
1998-2007 1998-2002 2003-2007<br />
# Country<br />
Co-<br />
Publications # Country<br />
Co-<br />
Publications # Country<br />
Co-<br />
Publications<br />
1 USA 1562 1 USA 488 1 USA 1074<br />
2 Japan 252 2 Japan 83 2 China 179<br />
3 China 219 3 China 40 3 Japan 169<br />
4 Canada 165 4 Canada 30 4 Canada 135<br />
5 UK 107 5 Germany 22 5 UK 86<br />
6 Australia 77 6 UK 21 6 Australia 63<br />
7 Poland 71 7 Australia 14 7 Poland 59<br />
8 Germany 67 7 Taiwan 14 8 Germany 45<br />
9 India 48 9 Poland 12 9 India 41<br />
10 Singapore 46 9 Israel 12 9 Singapore 41<br />
Engineering Science<br />
1998-2007 1998-2002 2003-2007<br />
# Country<br />
Co-<br />
Publications # Country<br />
Co-<br />
Publications # Country<br />
Co-<br />
Publications<br />
1 USA 5361 1 USA 1814 1 USA 3547<br />
2 Japan 1774 2 Japan 643 2 Japan 1131<br />
3 China 736 3 China 184 3 China 552<br />
4 UK 485 4 UK 165 4 UK 320<br />
5 Canada 414 5 Canada 119 5 Canada 295<br />
6 Russia 276 6 Russia 98 6 India 218<br />
7 Germany 271 7 Germany 79 7 Germany 192<br />
8 India 249 8 Australia 77 8 Russia 178<br />
9 Australia 247 9 France 60 9 Australia 170<br />
10 France 152 10 Taiwan 42 10 France 92<br />
91
Central Library<br />
Materials<br />
Science<br />
1998-2007 1998-2002 2003-2007<br />
# Country<br />
Co-<br />
Publications # Country<br />
Co-<br />
Publications # Country<br />
Co-<br />
Publications<br />
1 USA 2618 1 USA 885 1 USA 1733<br />
2 Japan 1670 2 Japan 634 2 Japan 1036<br />
3 China 717 3 China 213 3 China 504<br />
4 India 336 4 Germany 112 4 India 295<br />
5 Germany 303 5 UK 98 5 Germany 191<br />
6 UK 288 6 Russia 75 6 UK 190<br />
7 Russia 261 7 France 62 7 Russia 186<br />
8 France 151 8 Canada 52 8 Canada 90<br />
9 Canada 142 9 Australia 46 9 France 89<br />
10 Australia 133 10 India 41 10 Australia 87<br />
Mathematics<br />
1998-2007 1998-2002 2003-2007<br />
# Country<br />
Co-<br />
Publications # Country<br />
Co-<br />
Publications # Country<br />
Co-<br />
Publications<br />
1 USA 1118 1 USA 469 1 USA 649<br />
2 China 397 2 China 111 2 China 286<br />
3 Japan 240 3 Japan 74 3 Japan 166<br />
4 Canada 129 4 Canada 45 4 Canada 84<br />
5 UK 100 5 Germany 35 5 UK 76<br />
6 Germany 86 6 Australia 29 6 India 58<br />
7 India 77 7 UK 24 7 France 53<br />
8 France 71 8 Italy 22 8 Germany 51<br />
9 Australia 62 9 India 19 9 Spain 39<br />
10 Spain 58 9 Spain 19 10 Australia 33<br />
Medicine<br />
1998-2007 1998-2002 2003-2007<br />
# Country<br />
Co-<br />
Publications # Country<br />
Co-<br />
Publications # Country<br />
Co-<br />
Publications<br />
1 USA 7691 1 USA 2614 1 USA 5077<br />
2 Japan 2047 2 Japan 735 2 Japan 1312<br />
3 China 761 3 Canada 195 3 China 613<br />
4 Canada 652 4 UK 188 4 Canada 457<br />
5 UK 590 5 China 148 5 UK 402<br />
6 Germany 406 6 Germany 134 6 Germany 272<br />
7 France 291 7 Sweden 69 7 France 230<br />
8 Taiwan 289 7 Taiwan 69 8 Taiwan 220<br />
9 Australia 249 9 France 61 9 Australia 199<br />
10 Italy 247 10 Italy 59 10 Italy 188<br />
92
Central Library<br />
Multidisciplinary Journals<br />
1998-2007 1998-2002 2003-2007<br />
# Country<br />
Co-<br />
Publications # Country<br />
Co-<br />
Publications # Country<br />
Co-<br />
Publications<br />
1 USA 292 1 USA 100 1 USA 192<br />
2 Japan 78 2 Japan 32 2 Japan 46<br />
3 China 41 3 China 13 3 China 28<br />
4 Germany 33 4 Canada 10 4 Germany 24<br />
5 UK 30 5 UK 9 5 UK 21<br />
6 Canada 24 5 Germany 9 6 France 20<br />
7 France 22 7 India 5 7 Canada 14<br />
8 Australia 13 8 Australia 3 8 Sweden 11<br />
8 India 13 8 Hungary 3 9 Italy 10<br />
10 Italy 12 8 Russia 3 10 Australia 10<br />
Nanotechnology<br />
1998-2007 1998-2002 2003-2007<br />
# Country<br />
Co-<br />
Publications # Country<br />
Co-<br />
Publications # Country<br />
Co-<br />
Publications<br />
1 USA 425 1 USA 111 1 USA 314<br />
2 Japan 181 2 Japan 37 2 Japan 144<br />
3 China 96 3 China 23 3 China 73<br />
4 Germany 59 4 UK 14 4 Germany 46<br />
5 UK 51 5 Germany 13 5 UK 37<br />
6 India 37 6 Russia 10 6 India 37<br />
7 Russia 31 7 Australia 5 7 Russia 21<br />
8 Taiwan 23 8 Taiwan 4 8 Taiwan 19<br />
9 Australia 21 9 Canada 3 9 Australia 16<br />
10 Switzerland 18 9 Poland 3 10 Switzerland 16<br />
Physics<br />
1998-2007 1998-2002 2003-2007<br />
# Country<br />
Co-<br />
Publications # Country<br />
Co-<br />
Publications # Country<br />
Co-<br />
Publications<br />
1 USA 7197 1 USA 2825 1 USA 4372<br />
2 Japan 3311 2 Japan 1086 2 Japan 2225<br />
3 Russia 1963 3 Russia 735 3 Russia 1228<br />
4 Germany 1881 4 Germany 724 4 Germany 1157<br />
5 China 1659 5 China 586 5 China 1073<br />
6 UK 1337 6 UK 471 6 UK 866<br />
7 France 1133 7 France 444 7 India 753<br />
8 India 1073 8 Italy 413 8 France 689<br />
9 Italy 964 9 Taiwan 347 9 Taiwan 616<br />
10 Taiwan 963 10 Canada 337 10 Switzerland 605<br />
93
Central Library<br />
Taiwan<br />
Agricultural Science<br />
1998-2007 1998-2002 2003-2007<br />
# Land<br />
Co-<br />
Publications # Land<br />
Co-<br />
Publications # Land<br />
Co-<br />
Publications<br />
1 USA 326 1 USA 137 1 USA 189<br />
2 Japan 94 2 Japan 42 2 Japan 52<br />
3 Canada 36 3 UK 19 3 Canada 24<br />
4 UK 31 4 Canada 12 4 India 23<br />
New<br />
5 India 25 5 Zealand 7 5 China 22<br />
5 China 25 6 France 6 6 Australia 17<br />
7 Australia 22 6 Philippines 6 7 France 12<br />
8 France 18 8 Australia 5 7 UK 12<br />
9 Germany 14 9 Germany 4 9 Thailand 11<br />
9 Thailand 14 9 Poland 4 10 Germany 10<br />
South<br />
9 Korea 4<br />
Biology and Biotechnology<br />
1998-2007 1998-2002 2003-2007<br />
# Land<br />
Co-<br />
Publications # Land<br />
Co-<br />
Publications # Land<br />
Co-<br />
Publications<br />
1 USA 2031 1 USA 778 1 USA 1253<br />
2 Japan 514 2 Japan 178 2 Japan 336<br />
3 China 345 3 China 112 3 China 233<br />
4 UK 243 4 UK 85 4 UK 158<br />
5 Canada 189 5 Canada 65 5 Canada 124<br />
6 Germany 162 6 Germany 50 6 Germany 112<br />
7 France 104 7 Australia 37 7 France 72<br />
8 Singapore 101 8 Singapore 35 8 Singapore 66<br />
9 Australia 97 9 France 32 9 Australia 60<br />
South<br />
10 India 72 10 Korea 20 10 India 59<br />
94
Central Library<br />
Chemistry<br />
1998-2007 1998-2002 2003-2007<br />
# Land<br />
Co-<br />
Publications # Land<br />
Co-<br />
Publications # Land<br />
Co-<br />
Publications<br />
1 USA 1129 1 USA 410 1 USA 719<br />
2 China 554 2 China 177 2 China 377<br />
3 Japan 443 3 India 120 3 Japan 324<br />
4 India 359 4 Japan 119 4 India 239<br />
5 Germany 190 5 Germany 88 5 Canada 107<br />
6 Canada 164 6 Canada 57 6 Germany 102<br />
7 UK 103 7 UK 47 7 Russia 65<br />
8 Russia 90 8 Singapore 29 8 UK 56<br />
9 France 77 9 Australia 27 9 France 52<br />
10 Poland 72 10 France 25 10 Poland 47<br />
10 Poland 25<br />
10 Russia 25<br />
South<br />
10 Korea 25<br />
Energy<br />
1998-2007 1998-2002 2003-2007<br />
# Land<br />
Co-<br />
Publications # Land<br />
Co-<br />
Publications # Land<br />
Co-<br />
Publications<br />
1 USA 152 1 USA 51 1 USA 101<br />
2 Japan 61 2 Switzerland 15 2 Japan 51<br />
3 China 38 3 China 14 3 Australia 25<br />
4 South Korea 34 4 Germany 11 4 China 24<br />
5 Switzerland 32 5 Japan 10 4<br />
South<br />
Korea 24<br />
South<br />
Korea 10 6 India 23<br />
6 Australia 31 5<br />
7 India 29 7 Italy 8 7 Poland 19<br />
8 Germany 26 7 Russia 8 8 Slovenia 17<br />
9 Russia 23 9 Australia 6 8 Switzerland 17<br />
10 Poland 22 9 India 6 10 Germany 15<br />
10 Russia 15<br />
10 UK 15<br />
95
Central Library<br />
Geoscience<br />
1998-2007 1998-2002 2003-2007<br />
# Land<br />
Co-<br />
Publications # Land<br />
Co-<br />
Publications # Land<br />
Co-<br />
Publications<br />
1 USA 1323 1 USA 568 1 USA 755<br />
2 China 307 2 Japan 89 2 China 232<br />
3 Japan 253 3 China 75 3 Japan 164<br />
4 France 125 4 France 54 4 UK 95<br />
5 UK 124 5 Australia 40 5 France 71<br />
6 Australia 107 6 UK 29 6 Germany 69<br />
7 Germany 94 7 Canada 27 7 Australia 67<br />
8 Canada 73 8 Germany 25 8 Canada 46<br />
South<br />
9 Singapore 43 9 Russia 13 9 Korea 32<br />
10 South Korea 42 10 Singapore 12 10 Singapore 31<br />
Information Science and Computer Science<br />
1998-2007 1998-2002 2003-2007<br />
# Land<br />
Co-<br />
Publications # Land<br />
Co-<br />
Publications # Land<br />
Co-<br />
Publications<br />
1 USA 910 1 USA 374 1 USA 536<br />
2 China 193 2 China 38 2 China 155<br />
3 Japan 98 3 Canada 36 3 Japan 70<br />
4 Canada 79 4 Japan 28 4 UK 55<br />
5 UK 72 5 Australia 23 5 Canada 43<br />
6 Australia 60 6 UK 17 6 Australia 37<br />
South<br />
South<br />
7 South Korea 44 7 Korea 14 7 Korea 30<br />
8 Singapore 35 8 Hong Kong 12 8 Singapore 26<br />
9 Germany 29 9 Germany 9 9 Germany 20<br />
10 France 16 9 Singapore 9 10 France 9<br />
Engineering Science<br />
1998-2007 1998-2002 2003-2007<br />
# Land<br />
Co-<br />
Publications # Land<br />
Co-<br />
Publications # Land<br />
Co-<br />
Publications<br />
1 USA 2423 1 USA 1030 1 USA 1393<br />
2 China 473 2 China 126 2 China 347<br />
3 Japan 427 3 Japan 117 3 Japan 310<br />
4 UK 197 4 UK 60 4 UK 137<br />
5 Canada 178 5 Canada 53 5 Canada 125<br />
6 Singapore 153 6 Australia 50 6 Singapore 121<br />
7 Germany 141 7 Germany 45 7 Germany 96<br />
South<br />
8 Australia 137 8 Korea 42 8 Australia 87<br />
South<br />
9 South Korea 119 9 Singapore 32 9 Korea 77<br />
10 India 93 10 France 24 10 India 71<br />
96
Central Library<br />
Materials<br />
Science<br />
1998-2007 1998-2002 2003-2007<br />
# Land<br />
Co-<br />
Publications # Land<br />
Co-<br />
Publications # Land<br />
Co-<br />
Publications<br />
1 USA 741 1 USA 292 1 USA 449<br />
2 Japan 278 2 Japan 79 2 China 204<br />
3 China 275 3 China 71 3 Japan 199<br />
4 India 208 4 India 70 4 India 138<br />
5 Germany 91 5 UK 31 5 Germany 69<br />
6 Canada 89 6 Canada 22 6 Canada 67<br />
South<br />
7 UK 76 6 Germany 22 7 Korea 48<br />
8 South Korea 60 8 Singapore 14 8 UK 45<br />
9 Singapore 52 9 France 13 9 Singapore 38<br />
South<br />
10 Russia 45 10 Korea 12 10 Russia 35<br />
Mathematics<br />
1998-2007 1998-2002 2003-2007<br />
# Land<br />
Co-<br />
Publications # Land<br />
Co-<br />
Publications # Land<br />
Co-<br />
Publications<br />
1 USA 857 1 USA 406 1 USA 451<br />
2 China 347 2 China 94 2 China 253<br />
3 Canada 120 3 Canada 45 3 Japan 86<br />
4 Japan 118 4 Japan 32 4 Canada 75<br />
5 Australia 68 5 Russia 30 5 Australia 42<br />
6 Russia 66 6 Australia 26 6 Russia 36<br />
7 Germany 54 7 Singapore 24 7 Germany 33<br />
8 India 45 8 India 22 8 UK 24<br />
9 Singapore 43 9 Germany 21 9 India 23<br />
10 UK 42 10 UK 18 10 Singapore 19<br />
Medicine<br />
1998-2007 1998-2002 2003-2007<br />
# Land<br />
Co-<br />
Publications # Land<br />
Co-<br />
Publications # Land<br />
Co-<br />
Publications<br />
1 USA 4944 1 USA 1776 1 USA 3168<br />
2 Japan 906 2 Japan 324 2 Japan 582<br />
3 UK 638 3 UK 202 3 China 444<br />
4 China 623 4 China 179 4 UK 436<br />
5 Canada 383 5 Canada 154 5 Australia 231<br />
6 Australia 342 6 Australia 111 6 Canada 229<br />
South<br />
7 South Korea 289 7 Singapore 83 7 Korea 220<br />
8 France 282 8 France 76 8 Germany 208<br />
9 Germany 281 9 Germany 73 9 France 206<br />
South<br />
10 Singapore 274 10 Korea 69 10 Singapore 191<br />
97
Central Library<br />
Multidisciplinary Journals<br />
1998-2007 1998-2002 2003-2007<br />
# Land<br />
Co-<br />
Publications # Land<br />
Co-<br />
Publications # Land<br />
Co-<br />
Publications<br />
1 USA 181 1 USA 69 1 USA 112<br />
2 China 64 2 China 27 2 China 37<br />
3 Japan 33 3 UK 9 3 Japan 24<br />
4 UK 31 3 Germany 9 4 UK 22<br />
5 Germany 21 3 Japan 9 5 Canada 17<br />
6 Canada 20 6 Canada 3 6 France 12<br />
7 France 15 6 France 3 6 Germany 12<br />
8 Australia 13 6 Israel 3 8 Australia 11<br />
9 India 10 6 Mexico 3 9 Italy 9<br />
10 Italy 9 10 India 8<br />
Nanotechnology<br />
1998-2007 1998-2002 2003-2007<br />
# Land<br />
Co-<br />
Publications # Land<br />
Co-<br />
Publications # Land<br />
Co-<br />
Publications<br />
1 USA 152 1 USA 45 1 USA 107<br />
2 Japan 54 2 Japan 9 2 Japan 45<br />
3 China 29 3 China 8 3 China 21<br />
South<br />
4 UK 25 4 UK 6 4 Korea 19<br />
Czech<br />
5 South Korea 23 5 Republic 4 4 UK 19<br />
6 Australia 18 5<br />
South<br />
Korea 4 6 Australia 16<br />
7 Germany 15 7 Germany 3 7 Germany 12<br />
8 India 12 8 Australia 2 8 India 11<br />
9 Russia 11 8 Russia 2 9 Canada 10<br />
10 Canada 10 8 Ukraine 2 10 France 9<br />
Russia 9<br />
Physics<br />
1998-2007 1998-2002 2003-2007<br />
# Land<br />
Co-<br />
Publications # Land<br />
Co-<br />
Publications # Land<br />
Co-<br />
Publications<br />
1 USA 3546 1 USA 1453 1 USA 2093<br />
2 Japan 1419 2 China 482 2 Japan 1009<br />
3 China 1408 3 Germany 457 3 China 926<br />
4 Germany 1030 4 Japan 410 4 Russia 637<br />
5 Russia 1003 5 Russia 366 5<br />
South<br />
Korea 617<br />
South<br />
Korea 347 6 Germany 573<br />
6 South Korea 964 6<br />
7 India 742 7 Switzerland 295 7 India 499<br />
8 Switzerland 728 8 Italy 269 8 Switzerland 433<br />
9 Canada 552 9 India 243 9 Canada 336<br />
10 UK 535 10 Canada 216 10 UK 325<br />
98
Central Library<br />
3. Citation <strong>Analysis</strong><br />
3.1 Citation Rates for the Countries Studied over the Entire Period<br />
The perception of scientific publications can be measured using citations by other scientists in<br />
the form of the average number of citations per article (citation rate). In the sciences, the<br />
Science Citation Index (SCI) is used most often as the data source for this purpose. SCI<br />
consists predominantly of internationally respected journal articles and simultaneously records<br />
their citations in the journals evaluated. The citation rate is an indicator that is independent of<br />
the size of an institution or country but not of the size of the individual discipline. This means<br />
that the citation rate is not suitable for interdisciplinary comparisons.<br />
Figures 57 to 60 show the average citation rate (entire period) for each country studied in each<br />
of the disciplines presented. The perception of different countries can be compared within a<br />
discipline. To provide a better overview, the disciplines are split into two groups and presented<br />
in two charts, as are the countries. This results in four spider charts. We can see, for example,<br />
that China is ranked quite poorly in almost all of the disciplines investigated despite a high<br />
number of publications. It is also obvious that Australia’s perception is as high as Germany’s in<br />
many disciplines despite the fact that its publication output is significantly lower.<br />
Average citation rates of countries according to discipline 1998-2007<br />
Agricultural science<br />
16<br />
14<br />
12<br />
10<br />
Physics<br />
8<br />
Biology and biotechnology<br />
6<br />
4<br />
2<br />
0<br />
Germany<br />
Japan<br />
New Zealand<br />
Australia<br />
Singapore<br />
Thailand<br />
Vietnam<br />
Medicine<br />
Chemistry<br />
Geosciences<br />
Figure 57: Average citation rates for Germany, Japan, New Zealand, Australia, Singapore, Thailand and<br />
Vietnam in agricultural science, biology and biotechnology, chemistry, geosciences, medicine and physics<br />
99
Central Library<br />
Average citation rates of countries according to discipline 1998-2007<br />
Agricultural science<br />
8<br />
7<br />
6<br />
5<br />
Physics<br />
4<br />
Biology and biotechnology<br />
3<br />
2<br />
1<br />
0<br />
China<br />
Taiwan<br />
South Korea<br />
Indonesia<br />
Malaysia<br />
Iran<br />
Medicine<br />
Chemistry<br />
Geosciences<br />
Figure 58: Average citation rates for China, Taiwan, South Korea, Indonesia, Malaysia and Iran in<br />
agricultural science, biology and biotechnology, chemistry, geosciences, medicine and physics<br />
Average citation rates of countries according to discipline 1998-2007<br />
8<br />
Energy<br />
7<br />
6<br />
5<br />
Nanotechnology<br />
4<br />
Information and computer science<br />
3<br />
2<br />
1<br />
0<br />
Germany<br />
Japan<br />
New Zealand<br />
Australia<br />
South Korea<br />
Singapore<br />
Indonesia<br />
Mathematics<br />
Engineering<br />
Materials science<br />
Figure 59: Average citation rates for Germany, Japan, New Zealand, Australia, South Korea, Singapore,<br />
and Indonesia in energy, information and computer science, engineering, materials science, mathematics<br />
and nanotechnology<br />
100
Central Library<br />
Average citation rates of countries according to discipline 1998-2007<br />
6<br />
Energy<br />
5<br />
4<br />
Nanotechnology<br />
3<br />
Information and computer science<br />
2<br />
1<br />
0<br />
China<br />
Taiwan<br />
Thailand<br />
Vietnam<br />
Malaysia<br />
Iran<br />
Mathematics<br />
Engineering<br />
Materials science<br />
Figure 60: Average citation rates for China, Taiwan, Thailand, Vietnam, Malaysia and Iran in energy,<br />
information and computer science, engineering, materials science, mathematics and nanotechnology<br />
The spider charts that follow (Figures 61 to 63) present citation rates (entire period) in a similar<br />
manner to Figures 57 – 60 with the difference that the countries are depicted on the axes and<br />
the disciplines are represented by curves in each of the charts. This makes it possible to<br />
illustrate all of the countries that publish in a discipline in the one chart, which in turn allows us<br />
to determine the country with the strongest perception in each of the disciplines. For example,<br />
the citation rate of Singapore in mathematics is above that of Germany. The same is true for<br />
publications in medicine from New Zealand.<br />
Average citation rate of disciplines according to country 1998-2007<br />
Germany<br />
60<br />
Iran<br />
50<br />
China<br />
Malaysia<br />
40<br />
30<br />
Japan<br />
20<br />
Vietnam<br />
10<br />
New Zealand<br />
0<br />
Multidisciplinary journals<br />
Thailand<br />
Australia<br />
Indonesia<br />
Taiwan<br />
Singapore<br />
South Korea<br />
Figure 61: Average citation rate of the countries studied in the category “multidisciplinary journals”<br />
101
Central Library<br />
Average citation rate of disciplines according to country 1998-2007<br />
Germany<br />
16<br />
Iran<br />
14<br />
China<br />
12<br />
Malaysia<br />
10<br />
8<br />
Japan<br />
6<br />
Vietnam<br />
4<br />
2<br />
0<br />
New Zealand<br />
Agricultural science<br />
Biology and biotechnology<br />
Chemistry<br />
Geosciences<br />
Medicine<br />
Physics<br />
Thailand<br />
Australia<br />
Indonesia<br />
Taiwan<br />
Singapore<br />
South Korea<br />
Figure 62: Average citation rate of the countries studied in agricultural science, biology and<br />
biotechnology, chemistry, geosciences, medicine and physics<br />
Average citation rate of disciplines according to country 1998-2007<br />
Germany<br />
8<br />
Iran<br />
7<br />
China<br />
6<br />
Malaysia<br />
5<br />
4<br />
Japan<br />
3<br />
Energy<br />
Vietnam<br />
2<br />
1<br />
New Zealand<br />
Information and<br />
computer science<br />
Engineering<br />
0<br />
Materials science<br />
Mathematics<br />
Nanotechnology<br />
Thailand<br />
Australia<br />
Indonesia<br />
Taiwan<br />
Singapore<br />
South Korea<br />
Figure 63: Average citation rate of the countries studied in energy, information and computer science,<br />
engineering, materials science, mathematics and nanotechnology<br />
102
Central Library<br />
3.2 Citation Rates for the Countries Studied over Time<br />
The graphs that follow show the citation rates of each country in each discipline over time. This<br />
allows us to determine shifts in the perception of individual countries that may have occurred<br />
during the ten-year period under review. The further back the date of publication of an article is,<br />
the better its chances are of being perceived, in other words of being cited. Citation rates for<br />
more current articles are generally much lower than those for older publications.<br />
Citation rates for multidisciplinary journals<br />
(countries with minimum 300 publications in multidisciplinary journals from 1998 - 2007)<br />
Average number of citations per article<br />
100<br />
80<br />
60<br />
40<br />
20<br />
0<br />
1998 1999 2000 2001 2002 2003 2004 2005 2006 2007<br />
Germany China Japan New Zealand Australia Taiwan South Korea Iran<br />
Figure 64: Citation rates for the subject category “multidisciplinary journals” over time<br />
Citation rates for agricultural science<br />
30<br />
25<br />
Average number of citations per article<br />
20<br />
15<br />
10<br />
5<br />
0<br />
1998 1999 2000 2001 2002 2003 2004 2005 2006 2007<br />
Germany China Japan New Zealand Australia Taiwan South Korea<br />
Singapore Indonesia Thailand Vietnam Malaysia Iran<br />
Figure 65: Citation rates for the subject category “agricultural science” over time<br />
103
Central Library<br />
Citation rates for biology and biotechnology<br />
30<br />
25<br />
Average number of citations per article<br />
20<br />
15<br />
10<br />
5<br />
0<br />
1998 1999 2000 2001 2002 2003 2004 2005 2006 2007<br />
Germany China Japan New Zealand Australia Taiwan South Korea<br />
Singapore Indonesia Thailand Vietnam Malaysia Iran<br />
Figure 66: Citation rates for the subject category “biology and biotechnology” over time<br />
Citation rates for chemistry<br />
20<br />
Average number of citations per article<br />
16<br />
12<br />
8<br />
4<br />
0<br />
1998 1999 2000 2001 2002 2003 2004 2005 2006 2007<br />
Germany China Japan New Zealand Australia Taiwan South Korea<br />
Singapore Indonesia Thailand Vietnam Malaysia Iran<br />
Figure 67: Citation rates for the subject category “chemistry” over time<br />
104
Central Library<br />
Citation rates for energy<br />
(countries with minimum 400 publications in energy from 1998 to 2007)<br />
16<br />
14<br />
Average number of citations per article<br />
12<br />
10<br />
8<br />
6<br />
4<br />
2<br />
0<br />
1998 1999 2000 2001 2002 2003 2004 2005 2006 2007<br />
Germany China Japan Australia Taiwan South Korea Singapore Thailand Iran<br />
Figure 68: Citation rates for the subject category “energy” over time<br />
Citation rates for geoscience<br />
18<br />
15<br />
Average number of citations per article<br />
12<br />
9<br />
6<br />
3<br />
0<br />
1998 1999 2000 2001 2002 2003 2004 2005 2006 2007<br />
Germany China Japan New Zealand Australia Taiwan South Korea<br />
Singapore Indonesia Thailand Vietnam Malaysia Iran<br />
Figure 69: Citation rates for the subject category “geosciences” over time<br />
105
Central Library<br />
Citation rates for information and computer science<br />
(countries with minimum 300 publications in information and computer science from 1998 to 2007)<br />
9.0<br />
7.5<br />
Average number of citations per article<br />
6.0<br />
4.5<br />
3.0<br />
1.5<br />
0.0<br />
1998 1999 2000 2001 2002 2003 2004 2005 2006 2007<br />
Germany China Japan New Zealand Australia Taiwan South Korea<br />
Singapore Thailand Vietnam Iran<br />
Figure 70: Citation rates for the subject category “information and computer science” over time<br />
Citation rates for engineering<br />
(countries with minimum 300 publications in engineering from 1998 to 2007)<br />
10<br />
9<br />
Average number of citations per article<br />
8<br />
7<br />
6<br />
5<br />
4<br />
3<br />
2<br />
1<br />
0<br />
1998 1999 2000 2001 2002 2003 2004 2005 2006 2007<br />
Germany China Japan New Zealand Australia Taiwan South Korea<br />
Singapore Indonesia Thailand Malaysia Iran<br />
Figure 71: Citation rates for the subject category “engineering” over time<br />
106
Central Library<br />
Citation rates for materials science<br />
(countries with minimum 300 publications in materials science from 1998 to 2007)<br />
14<br />
12<br />
Average number of citations per article<br />
10<br />
8<br />
6<br />
4<br />
2<br />
0<br />
1998 1999 2000 2001 2002 2003 2004 2005 2006 2007<br />
Germany China Japan New Zealand Australia Taiwan South Korea<br />
Singapore Thailand Malaysia Iran<br />
Figure 72: Citation rates for the subject category “materials science” over time<br />
Citation rates for mathematics<br />
(countries with minimum 400 publications in mathematics from 1998 to 2007)<br />
8<br />
7<br />
Average number of citations per article<br />
6<br />
5<br />
4<br />
3<br />
2<br />
1<br />
0<br />
1998 1999 2000 2001 2002 2003 2004 2005 2006 2007<br />
Germany China Japan New Zealand Australia Taiwan South Korea Singapore Vietnam Iran<br />
Figure 73: Citation rates for the subject category “mathematics” over time<br />
107
Central Library<br />
Citation rates for medicine<br />
21<br />
18<br />
Average number of citations per article<br />
15<br />
12<br />
9<br />
6<br />
3<br />
0<br />
1998 1999 2000 2001 2002 2003 2004 2005 2006 2007<br />
Germany China Japan New Zealand Australia Taiwan South Korea<br />
Singapore Indonesia Thailand Vietnam Malaysia Iran<br />
Figure 74: Citation rates for the subject category “medicine” over time<br />
Citation rates for physics<br />
18<br />
15<br />
Average number of citations per article<br />
12<br />
9<br />
6<br />
3<br />
0<br />
1998 1999 2000 2001 2002 2003 2004 2005 2006 2007<br />
Germany China Japan New Zealand Australia Taiwan South Korea<br />
Singapore Indonesia Thailand Vietnam Malaysia Iran<br />
Figure 75: Citation rates for the subject category “physics” over time<br />
108
Central Library<br />
Citation rates for nanotechnology<br />
(countries with minimum 300 publications in nanotechnology from 1998 to 2007)<br />
15<br />
Average number of citations per article<br />
12<br />
9<br />
6<br />
3<br />
0<br />
1998 1999 2000 2001 2002 2003 2004 2005 2006 2007<br />
Germany China Japan Australia Taiwan South Korea Singapore<br />
Figure 76: Citation rates for the subject category “nanotechnology” over time<br />
The graphs that follow show the citation rates of the disciplines over time grouped according to<br />
each country studied. This allows us to draw conclusions on the perception of countries in the<br />
disciplines and to compare the impact of a discipline in the respective countries. Relatively small<br />
numbers in the publication output are partially responsible for significant shifts. It can also be<br />
seen, for example, that Iranian publications in multidisciplinary journals are only perceived to a<br />
very limited degree and that the citation rate for this subject category is the worst of all of the<br />
Iranian citation rates. In contrast to this, this subject category is top of the list for all of the other<br />
countries analysed and at times must be placed on a secondary axis.<br />
A drop in the citation rates as we approach the present is not unusual because newer<br />
publications have had less time to be read and then cited in other subsequent publications.<br />
109
Central Library<br />
Citation rates Germany 1998-2007<br />
45<br />
90<br />
40<br />
80<br />
Average number of citations per article<br />
35<br />
30<br />
25<br />
20<br />
15<br />
10<br />
70<br />
60<br />
50<br />
40<br />
30<br />
20<br />
Average number of citations per article<br />
(multidisciplinary journals)<br />
5<br />
10<br />
0<br />
1998 1999 2000 2001 2002 2003 2004 2005 2006 2007<br />
0<br />
Agricultural science Biology and biotechnology Chemistry Energy<br />
Geosciences Information and computer science Engineering Materials science<br />
Mathematics Medicine Nanotechnology Physics<br />
Multidisciplinary journals<br />
Figure 77: Citation rates for the disciplines studied (Germany)<br />
Citation rates China 1998-2007<br />
16<br />
14<br />
Average number of citations per article<br />
12<br />
10<br />
8<br />
6<br />
4<br />
2<br />
0<br />
1998 1999 2000 2001 2002 2003 2004 2005 2006 2007<br />
Multidisciplinary journals Agricultural science Biology and biotechnology Chemistry<br />
Energy Geosciences Information and computer science Engineering<br />
Materials science Mathematics Medicine Nanotechnology<br />
Physics<br />
Figure 78: Citation rates for the disciplines studied (China)<br />
110
Central Library<br />
Citation rates Japan 1998-2007<br />
25<br />
100<br />
Average number of citations per article<br />
20<br />
15<br />
10<br />
5<br />
80<br />
60<br />
40<br />
20<br />
Average number of citations per article<br />
(multidisciplinary journals)<br />
0<br />
1998 1999 2000 2001 2002 2003 2004 2005 2006 2007<br />
0<br />
Agricultural science Biology and biotechnology Chemistry Energy<br />
Geosciences Information and computer science Engineering Materials science<br />
Mathematics Medicine Nanotechnology Physics<br />
Multidisciplinary journals<br />
Figure 79: Citation rates for the disciplines studied (Japan)<br />
Citation rates New Zealand 1998-2007<br />
40<br />
35<br />
Average number of citations per article<br />
30<br />
25<br />
20<br />
15<br />
10<br />
5<br />
0<br />
1998 1999 2000 2001 2002 2003 2004 2005 2006 2007<br />
Multidisciplinary journals Agricultural science Biology and biotechnology Chemistry<br />
Energy Geosciences Information and computer science Engineering<br />
Materials science Mathematics Medicine Nanotechnology<br />
Physics<br />
Figure 80: Citation rates for the disciplines studied (New Zealand)<br />
111
Central Library<br />
Citation rates Australia 1998-2007<br />
37.5<br />
75<br />
Average number of citations per article<br />
30.0<br />
22.5<br />
15.0<br />
7.5<br />
60<br />
45<br />
30<br />
15<br />
Average number of citations per article<br />
(multidisciplinary journals)<br />
0.0<br />
1998 1999 2000 2001 2002 2003 2004 2005 2006 2007<br />
0<br />
Agricultural science Biology and biotechnology Chemistry Energy<br />
Geosciences Information and computer science Engineering Materials science<br />
Mathematics Medicine Nanotechnology Physics<br />
Multidisciplinary journals<br />
Figure 81: Citation rates for the disciplines studied (Australia)<br />
Citation rates Taiwan 1998-2007<br />
22.5<br />
45<br />
20.0<br />
40<br />
Average number of citations per article<br />
17.5<br />
15.0<br />
12.5<br />
10.0<br />
7.5<br />
5.0<br />
35<br />
30<br />
25<br />
20<br />
15<br />
10<br />
Average number of citations per article<br />
(multidisciplinary journals)<br />
2.5<br />
5<br />
0.0<br />
1998 1999 2000 2001 2002 2003 2004 2005 2006 2007<br />
0<br />
Agricultural science Biology and biotechnology Chemistry Energy<br />
Geosciences Information and computer science Engineering Materials science<br />
Mathematics Medicine Nanotechnology Physics<br />
Multidisciplinary journals<br />
Figure 82: Citation rates for the disciplines studied (Taiwan)<br />
112
Central Library<br />
Citation rates South Korea 1998-2007<br />
30<br />
100<br />
Average number of citations per article<br />
24<br />
18<br />
12<br />
6<br />
80<br />
60<br />
40<br />
20<br />
Average number of citations per article<br />
(multidisciplinary journals)<br />
0<br />
1998 1999 2000 2001 2002 2003 2004 2005 2006 2007<br />
0<br />
Agricultural science Biology and biotechnology Chemistry Energy<br />
Geosciences Information and computer science Engineering Materials science<br />
Mathematics Medicine Nanotechnology Physics<br />
Multidisciplinary journals<br />
Figure 83: Citation rates for the disciplines studied (South Korea)<br />
Citation rates Singapore 1998-2007<br />
40<br />
80<br />
35<br />
70<br />
Average number of citations per article<br />
30<br />
25<br />
20<br />
15<br />
10<br />
5<br />
60<br />
50<br />
40<br />
30<br />
20<br />
10<br />
Average number of citations per article<br />
(multidisciplinary journals)<br />
0<br />
1998 1999 2000 2001 2002 2003 2004 2005 2006 2007<br />
0<br />
Agricultural science Biology and biotechnology Chemistry Energy<br />
Geosciences Information and computer science Engineering Materials science<br />
Mathematics Medicine Nanotechnology Physics<br />
Multidisciplinary journals<br />
Figure 84: Citation rates for the disciplines studied (Singapore)<br />
113
Central Library<br />
Citation rates Indonesia 1998-2007<br />
30<br />
120<br />
Average number of citations per article<br />
25<br />
20<br />
15<br />
10<br />
5<br />
100<br />
80<br />
60<br />
40<br />
20<br />
Average number of citations per article<br />
(multidisciplinary journals)<br />
0<br />
1998 1999 2000 2001 2002 2003 2004 2005 2006 2007<br />
0<br />
Agricultural science Biology and biotechnology Chemistry Energy<br />
Geosciences Information and computer science Engineering Materials science<br />
Mathematics Medicine Nanotechnology Physics<br />
Multidisciplinary journals<br />
Figure 85: Citation rates for the disciplines studied (Indonesia)<br />
Citations rates Thailand 1998-2007<br />
30<br />
90<br />
Average number of citations per article<br />
25<br />
20<br />
15<br />
10<br />
5<br />
75<br />
60<br />
45<br />
30<br />
15<br />
Average number of citations per article<br />
(nanotechnology and multidisciplinary journals)<br />
0<br />
1998 1999 2000 2001 2002 2003 2004 2005 2006 2007<br />
0<br />
Agricultural science Biology and biotechnology Chemistry Energy<br />
Geosciences Information and computer science Engineering Materials science<br />
Mathematics Medicine Physics Multidisciplinary journals<br />
Nanotechnology<br />
Figure 86: Citation rates for the disciplines studied (Thailand)<br />
114
Central Library<br />
Citation rates Vietnam 1998-2007<br />
30<br />
120<br />
Average number of citations per article<br />
25<br />
20<br />
15<br />
10<br />
5<br />
100<br />
80<br />
60<br />
40<br />
20<br />
Average number of citations per article<br />
(multidisciplinary journals)<br />
0<br />
1998 1999 2000 2001 2002 2003 2004 2005 2006 2007<br />
0<br />
Agricultural science Biology and biotechnology Chemistry Energy<br />
Geosciences Information and computer science Engineering Materials science<br />
Mathematics Medicine Nanotechnology Physics<br />
Multidisciplinary journals<br />
Figure 87: Citation rates for the disciplines studied (Vietnam)<br />
Citation rates Malaysia 1998-2007<br />
20<br />
80<br />
Average number of citations per article<br />
15<br />
10<br />
5<br />
60<br />
40<br />
20<br />
Average number of citations per article<br />
(multidisciplinary journals)<br />
0<br />
1998 1999 2000 2001 2002 2003 2004 2005 2006 2007<br />
0<br />
Agricultural science Biology and biotechnology Chemistry Energy<br />
Geosciences Information and computer science Engineering Materials science<br />
Mathematics Medicine Nanotechnology Physics<br />
Multidisciplinary journals<br />
Figure 88: Citation rates for the disciplines studied (Malaysia)<br />
115
Central Library<br />
Citation rates Iran 1998-2007<br />
15<br />
Average number of citations per article<br />
12<br />
9<br />
6<br />
3<br />
0<br />
1998 1999 2000 2001 2002 2003 2004 2005 2006 2007<br />
Multidisciplinary journals Agricultural science Biology and biotechnology Chemistry<br />
Energy Geosciences Information and computer science Engineering<br />
Materials science Mathematics Medicine Nanotechnology<br />
Physics<br />
Figure 89: Citation rates for the disciplines studied (Iran)<br />
116
Central Library<br />
3.3 Publication Output and Perception of Countries Compared to Germany<br />
In order to compare the perception generated by a country with its publication performance, this<br />
section will take Germany as a benchmark and conduct a comparative study of each country<br />
and Germany (for the entire period under review 1998 to 2007).<br />
Figures 90(a) to 101(a) compare the number of publications by a country in each discipline with<br />
the benchmark using the following formula. This gives us the percentage of publications that a<br />
country produces in comparison to Germany. A negative value indicates in percent how far<br />
below the benchmark a particular country is, while a positive value indicates how many more<br />
publications the corresponding country has produced compared to Germany in that particular<br />
subject.<br />
PC<br />
− P<br />
PG<br />
G<br />
⋅100%<br />
where<br />
P C = number of publications by country C<br />
P G = number of publications by Germany<br />
Thanks to the analyses in the previous chapters, we know that most of the countries boast a<br />
rather small publication output. The way we illustrate our results here allows us to compare the<br />
countries in a discipline and determine those countries that publish either more or less than<br />
Germany, the disciplines in which they do so, and the degree to which they do so. Taken as a<br />
whole, we found only two countries that produce more scientific articles in individual disciplines<br />
than Germany: Japan (in 8 disciplines) and China (in 6 disciplines). In the case of all of the other<br />
countries, we can see the degree to which each country lies below the comparative value for<br />
Germany.<br />
The perception of the countries is measured against the scientific perception of Germany in<br />
Figures 90(b) to 101(b). In order to measure the perception, we determine what percentage of<br />
Germany’s citation rate a country achieves in a particular discipline. As was the case in the<br />
previous analysis, a negative value indicates how far below the benchmark a country lies, while<br />
a positive value correspondingly indicates how much higher (in percent) the citation rate of the<br />
respective country is in relation to that of Germany in that particular subject. The calculations<br />
are based on the following formula, which is equivalent to the previous comparison of the<br />
number of publications:<br />
CPPc − CPPG<br />
⋅100%<br />
CPPG<br />
where<br />
CPP C = citation rate of country C<br />
CPP G = citation rate of Germany<br />
It can be seen that China lies well below expectations in all of the disciplines analysed despite<br />
its high publication output. China lies below the citation level of Germany in all of the disciplines<br />
investigated. This is not the case for some of the other countries studied: in 4 of the 13<br />
disciplines analysed, Australia generated a higher or at least the same perception as Germany,<br />
despite the fact that Australia’s publication output is well below the level of China or Germany.<br />
From this, we can conclude that a high number of publications alone is not a guarantee for a<br />
high perception. The inverse holds for a comparably low publication output in that this does not<br />
automatically mean that a country has no chance of a relatively high international visibility.<br />
117
Central Library<br />
Number of publications by China compared to Germany<br />
Physics<br />
-20.68%<br />
Nanotechnology<br />
16.32%<br />
Medicine<br />
-78.51%<br />
Mathematics<br />
31.07%<br />
Materials science<br />
60.29%<br />
Engineering<br />
34.91%<br />
Information and computer science<br />
-2.96%<br />
Geosciences<br />
-25.40%<br />
Energy<br />
-46.59%<br />
Chemistry<br />
31.06%<br />
Biology and biotechnology<br />
Agricultural science<br />
-56.97%<br />
-51.88%<br />
Multidisciplinary journals<br />
11.36%<br />
-100% -80% -60% -40% -20% 0% 20% 40% 60% 80%<br />
Benchmark Germany<br />
Figure 90(a): Number of publications by China compared to the selected benchmark Germany<br />
Citation rates for China compared to Germany<br />
Physics<br />
-54.53%<br />
Nanotechnology<br />
Medicine<br />
Mathematics<br />
-33.79%<br />
-35.96%<br />
-32.58%<br />
Materials science<br />
Engineering<br />
Information and computer science<br />
Geosciences<br />
-46.82%<br />
-41.80%<br />
-39.36%<br />
-47.66%<br />
Energy<br />
-29.66%<br />
Chemistry<br />
-49.90%<br />
Biology and biotechnology<br />
-62.96%<br />
Agricultural science<br />
-29.48%<br />
Multidisciplinary journals<br />
-85.67%<br />
-100% -75% -50% -25% 0%<br />
Benchmark Germany<br />
Figure 90(b): Citation rates for China compared to the selected benchmark Germany<br />
118
Central Library<br />
Number of publications by Japan compared to Germany<br />
Physics<br />
2.09%<br />
Nanotechnology<br />
19.80%<br />
Medicine<br />
-9.76%<br />
Mathematics<br />
-39.41%<br />
Materials science<br />
Engineering<br />
48.53%<br />
53.59%<br />
Information and computer science<br />
Geosciences<br />
-26.46%<br />
-28.34%<br />
Energy<br />
20.35%<br />
Chemistry<br />
30.82%<br />
Biology and biotechnology<br />
8.73%<br />
Agricultural science<br />
58.05%<br />
Multidisciplinary journals<br />
-30.17%<br />
-50% -25% 0% 25% 50% 75%<br />
Benchmark Germany<br />
Figure 91(a): Number of publications by Japan compared to the selected benchmark Germany<br />
Citation rates for Japan compared to Germany<br />
Physics<br />
-29.40%<br />
Nanotechnology<br />
-17.61%<br />
Medicine<br />
-11.35%<br />
Mathematics<br />
-22.51%<br />
Materials science<br />
Engineering<br />
-19.46%<br />
-19.88%<br />
Information and computer science<br />
-26.63%<br />
Geosciences<br />
-30.81%<br />
Energy<br />
Chemistry<br />
-16.44%<br />
-15.75%<br />
Biology and biotechnology<br />
Agricultural science<br />
-23.75%<br />
-23.11%<br />
Multidisciplinary journals<br />
7.34%<br />
-35% -30% -25% -20% -15% -10% -5% 0% 5% 10%<br />
Benchmark Germany<br />
Figure 91(b): Citation rates for Japan compared to the selected benchmark Germany<br />
119
Central Library<br />
Number of publications by New Zealand compared to Germany<br />
Physics<br />
Nanotechnology<br />
Medicine<br />
Mathematics<br />
Materials science<br />
Engineering<br />
Information and computer science<br />
-97.96%<br />
-97.53%<br />
-94.22%<br />
-93.59%<br />
-96.70%<br />
-94.52%<br />
-92.94%<br />
Geosciences<br />
-83.11%<br />
Energy<br />
Chemistry<br />
Biology and biotechnology<br />
-97.18%<br />
-96.48%<br />
-90.40%<br />
Agricultural science<br />
-71.14%<br />
Multidisciplinary journals<br />
-91.64%<br />
-110% -100% -90% -80% -70% -60% -50% -40% -30% -20% -10% 0%<br />
Benchmark Germany<br />
Figure 92(a): Number of publications by New Zealand compared to the selected benchmark Germany<br />
Citation rates for New Zealand compared to Germany<br />
Physics<br />
Nanotechnology<br />
-23.07%<br />
-19.02%<br />
Medicine<br />
7.44%<br />
Mathematics<br />
-8.46%<br />
Materials science<br />
-36.15%<br />
Engineering<br />
-12.40%<br />
Information and computer science<br />
-19.63%<br />
Geosciences<br />
-14.01%<br />
Energy<br />
-6.84%<br />
Chemistry<br />
-12.81%<br />
Biology and biotechnology<br />
-31.18%<br />
Agricultural science<br />
12.38%<br />
Multidisciplinary journals<br />
-53.92%<br />
-60% -40% -20% 0% 20%<br />
Benchmark Germany<br />
Figure 92(b): Citation rates for New Zealand compared to the selected benchmark Germany<br />
120
Central Library<br />
Number of publications by Australia compared to Germany<br />
Physics<br />
Nanotechnology<br />
-83.53%<br />
-83.72%<br />
Medicine<br />
Mathematics<br />
-64.75%<br />
-68.39%<br />
Materials science<br />
-80.43%<br />
Engineering<br />
Information and computer science<br />
-62.94%<br />
-61.55%<br />
Geosciences<br />
-36.20%<br />
Energy<br />
Chemistry<br />
-81.20%<br />
-81.53%<br />
Biology and biotechnology<br />
-57.49%<br />
Agricultural science<br />
-18.66%<br />
Multidisciplinary journals<br />
-64.54%<br />
-100% -80% -60% -40% -20% 0%<br />
Benchmark Germany<br />
Figure 93(a): Number of publications by Australia compared to the selected benchmark Germany<br />
Citation rates for Australia compared to Germany<br />
Physics<br />
-6.55%<br />
Nanotechnology<br />
-18.25%<br />
Medicine<br />
Mathematics<br />
5.93%<br />
7.34%<br />
Materials science<br />
-18.38%<br />
Engineering<br />
Information and computer science<br />
-5.89%<br />
-3.43%<br />
Geosciences<br />
-11.77%<br />
Energy<br />
11.49%<br />
Chemistry<br />
-6.85%<br />
Biology and biotechnology<br />
-19.30%<br />
Agricultural science<br />
14.34%<br />
Multidisciplinary journals<br />
-24.29%<br />
-30% -20% -10% 0% 10% 20%<br />
Benchmark Germany<br />
Figure 93(b): Citation rates for Australia compared to the selected benchmark Germany<br />
121
Central Library<br />
Number of publications by Taiwan compared to Germany<br />
Physics<br />
-81.79%<br />
Nanotechnology<br />
-62.60%<br />
Medicine<br />
-88.46%<br />
Mathematics<br />
Materials science<br />
-77.88%<br />
-72.68%<br />
Engineering<br />
-45.67%<br />
Information and computer science<br />
-60.07%<br />
Geosciences<br />
Energy<br />
Chemistry<br />
Biology and biotechnology<br />
Agricultural science<br />
Multidisciplinary journals<br />
-82.20%<br />
-88.09%<br />
-80.86%<br />
-88.87%<br />
-79.33%<br />
-93.35%<br />
-100% -90% -80% -70% -60% -50% -40% -30% -20% -10% 0%<br />
Benchmark Germany<br />
Figure 94(a): Number of publications by Taiwan compared to the selected benchmark Germany<br />
Citation rates for Taiwan compared to Germany<br />
Physics<br />
Nanotechnology<br />
-48.81%<br />
-46.61%<br />
Medicine<br />
-27.60%<br />
Mathematics<br />
-21.50%<br />
Materials science<br />
Engineering<br />
-29.02%<br />
-31.03%<br />
Information and computer science<br />
-21.98%<br />
Geosciences<br />
-38.30%<br />
Energy<br />
-9.69%<br />
Chemistry<br />
-31.34%<br />
Biology and biotechnology<br />
-48.61%<br />
Agricultural science<br />
-9.26%<br />
Multidisciplinary journals<br />
-58.62%<br />
-70% -60% -50% -40% -30% -20% -10% 0%<br />
Benchmark Germany<br />
Figure 94(b): Citation rates for Taiwan compared to the selected benchmark Germany<br />
122
Central Library<br />
Number of publications by South Korea compared to Germany<br />
Physics<br />
-69.95%<br />
Nanotechnology<br />
-40.57%<br />
Medicine<br />
-83.72%<br />
Mathematics<br />
-75.69%<br />
Materials science<br />
-43.00%<br />
Engineering<br />
-32.04%<br />
Information and computer science<br />
-46.59%<br />
Geosciences<br />
-81.24%<br />
Energy<br />
-72.89%<br />
Chemistry<br />
-63.19%<br />
Biology and biotechnology<br />
-77.10%<br />
Agricultural science<br />
-67.47%<br />
Multidisciplinary journals<br />
-91.65%<br />
-100% -90% -80% -70% -60% -50% -40% -30% -20% -10% 0%<br />
Benchmark Germany<br />
Figure 95(a): Number of publications by South Korea compared to the selected benchmark Germany<br />
Citation rates for South Korea compared to Germany<br />
Physics<br />
-42.85%<br />
Nanotechnology<br />
-30.45%<br />
Medicine<br />
-40.99%<br />
Mathematics<br />
-36.74%<br />
Materials science<br />
Engineering<br />
-31.69%<br />
-31.93%<br />
Information and computer science<br />
-54.73%<br />
Geosciences<br />
-44.71%<br />
Energy<br />
-14.03%<br />
Chemistry<br />
-33.33%<br />
Biology and biotechnology<br />
-51.22%<br />
Agricultural science<br />
Multidisciplinary journals<br />
-31.50%<br />
-30.86%<br />
-60% -50% -40% -30% -20% -10% 0%<br />
Benchmark Germany<br />
Figure 95(b): Citation rates for South Korea compared to the selected benchmark Germany<br />
123
Central Library<br />
Number of publications by Singapore compared to Germany<br />
Physics<br />
-92.61%<br />
Nanotechnology<br />
-78.36%<br />
Medicine<br />
Mathematics<br />
Materials science<br />
-96.41%<br />
-90.45%<br />
-86.24%<br />
Engineering<br />
Information and computer science<br />
-79.96%<br />
-75.24%<br />
Geosciences<br />
Energy<br />
Chemistry<br />
Biology and biotechnology<br />
Agricultural science<br />
Multidisciplinary journals<br />
-94.64%<br />
-96.23%<br />
-93.75%<br />
-95.44%<br />
-97.74%<br />
-96.75%<br />
-110% -100% -90% -80% -70% -60% -50% -40% -30% -20% -10% 0%<br />
Benchmark Germany<br />
Figure 96(a): Number of publications by Singapore compared to the selected benchmark Germany<br />
Citation rates for Singapore compared to Germany<br />
Physics<br />
-48.32%<br />
Nanotechnology<br />
-29.45%<br />
Medicine<br />
-18.99%<br />
Mathematics<br />
14.01%<br />
Materials science<br />
Engineering<br />
Information and computer science<br />
-15.27%<br />
-8.11%<br />
-10.75%<br />
Geosciences<br />
-53.04%<br />
Energy<br />
14.93%<br />
Chemistry<br />
-7.39%<br />
Biology and biotechnology<br />
-21.53%<br />
Agricultural science<br />
52.44%<br />
Multidisciplinary journals<br />
-25.78%<br />
-70% -60% -50% -40% -30% -20% -10% 0% 10% 20% 30% 40% 50% 60% 70%<br />
Benchmark Germany<br />
Figure 96(b): Citation rates for Singapore compared to the selected benchmark Germany<br />
124
Central Library<br />
Number of publications by Indonesia compared to Germany<br />
Physics<br />
Nanotechnology<br />
Medicine<br />
Mathematics<br />
Materials science<br />
Engineering<br />
Information and computer science<br />
Geosciences<br />
Energy<br />
Chemistry<br />
Biology and biotechnology<br />
Agricultural science<br />
Multidisciplinary journals<br />
-99.72%<br />
-99.87%<br />
-99.51%<br />
-99.72%<br />
-99.46%<br />
-99.24%<br />
-99.71%<br />
-97.92%<br />
-99.14%<br />
-99.45%<br />
-98.81%<br />
-95.86%<br />
-99.14%<br />
-110% -100% -90% -80% -70% -60% -50% -40% -30% -20% -10% 0%<br />
Benchmark Germany<br />
Figure 97(a): Number of publications by Indonesia compared to the selected benchmark Germany<br />
Citation rates for Indonesia compared to Germany<br />
Physics<br />
-50.22%<br />
Nanotechnology<br />
-3.20%<br />
Medicine<br />
-32.80%<br />
Mathematics<br />
-71.25%<br />
Materials science<br />
-53.83%<br />
Engineering<br />
-41.41%<br />
Information and computer science<br />
-52.79%<br />
Geosciences<br />
Energy<br />
-25.73%<br />
-27.98%<br />
Chemistry<br />
-46.84%<br />
Biology and biotechnology<br />
-57.48%<br />
Agricultural science<br />
-8.06%<br />
Multidisciplinary journals<br />
-23.39%<br />
-80% -70% -60% -50% -40% -30% -20% -10% 0%<br />
Benchmark Germany<br />
Figure 97(b): Citation rates for Indonesia compared to the selected benchmark Germany<br />
125
Central Library<br />
Number of publications by Thailand compared to Germany<br />
Physics<br />
Nanotechnology<br />
Medicine<br />
Mathematics<br />
Materials science<br />
Engineering<br />
Information and computer science<br />
Geosciences<br />
Energy<br />
Chemistry<br />
Biology and biotechnology<br />
Agricultural science<br />
Multidisciplinary journals<br />
-99.06%<br />
-98.49%<br />
-97.19%<br />
-98.88%<br />
-97.28%<br />
-95.59%<br />
-97.46%<br />
-96.49%<br />
-96.49%<br />
-96.71%<br />
-96.01%<br />
-89.33%<br />
-98.57%<br />
-110% -100% -90% -80% -70% -60% -50% -40% -30% -20% -10% 0%<br />
Benchmark Germany<br />
Figure 98(a): Number of publications by Thailand compared to the selected benchmark Germany<br />
Citation rates for Thailand compared to Germany<br />
Physics<br />
-66.17%<br />
Nanotechnology<br />
-94.63%<br />
Medicine<br />
-22.83%<br />
Mathematics<br />
Materials science<br />
-58.35%<br />
-53.38%<br />
Engineering<br />
Information and computer science<br />
-43.96%<br />
-38.24%<br />
Geosciences<br />
-51.61%<br />
Energy<br />
-37.01%<br />
Chemistry<br />
Biology and biotechnology<br />
-56.67%<br />
-51.85%<br />
Agricultural science<br />
-26.48%<br />
Multidisciplinary journals<br />
-34.21%<br />
-110% -100% -90% -80% -70% -60% -50% -40% -30% -20% -10% 0%<br />
Benchmark Germany<br />
Figure 98(b): Citation rates for Thailand compared to the selected benchmark Germany<br />
126
Central Library<br />
Number of publications by Vietnam compared to Germany<br />
Physics<br />
Nanotechnology<br />
Medicine<br />
Mathematics<br />
Materials science<br />
Engineering<br />
Information and computer science<br />
Geosciences<br />
Energy<br />
Chemistry<br />
Biology and biotechnology<br />
Agricultural science<br />
Multidisciplinary journals<br />
-99.44%<br />
-99.84%<br />
-99.57%<br />
-97.79%<br />
-99.44%<br />
-99.58%<br />
-99.54%<br />
-99.08%<br />
-99.55%<br />
-99.53%<br />
-99.30%<br />
-97.50%<br />
-99.50%<br />
-110% -100% -90% -80% -70% -60% -50% -40% -30% -20% -10% 0%<br />
Benchmark Germany<br />
Figure 99(a): Number of publications by Vietnam compared to the selected benchmark Germany<br />
Citation rates for Vietnam compared to Germany<br />
Physics<br />
-58.26%<br />
Nanotechnology<br />
-71.96%<br />
Medicine<br />
-0.65%<br />
Mathematics<br />
-40.50%<br />
Materials science<br />
-55.74%<br />
Engineering<br />
-17.79%<br />
Information and computer science<br />
-68.66%<br />
Geosciences<br />
-31.35%<br />
Energy<br />
-24.08%<br />
Chemistry<br />
Biology and biotechnology<br />
-51.64%<br />
-54.13%<br />
Agricultural science<br />
Multidisciplinary journals<br />
-37.19%<br />
-32.72%<br />
-80% -70% -60% -50% -40% -30% -20% -10% 0%<br />
Benchmark Germany<br />
Figure 99(b): Citation rates for Vietnam compared to the selected benchmark Germany<br />
127
Central Library<br />
Number of publications by Malaysia compared to Germany<br />
Physics<br />
Nanotechnology<br />
Medicine<br />
Mathematics<br />
Materials science<br />
Engineering<br />
Information and computer science<br />
Geosciences<br />
Energy<br />
Chemistry<br />
Biology and biotechnology<br />
Agricultural science<br />
Multidisciplinary journals<br />
-99.15%<br />
-98.95%<br />
-99.08%<br />
-98.74%<br />
-94.59%<br />
-96.34%<br />
-97.82%<br />
-97.88%<br />
-97.33%<br />
-97.70%<br />
-98.37%<br />
-93.56%<br />
-98.92%<br />
-110% -100% -90% -80% -70% -60% -50% -40% -30% -20% -10% 0%<br />
Benchmark Germany<br />
Figure 100(a): Number of publications by Malaysia compared to the selected benchmark Germany<br />
Citation rates for Malaysia compared to Germany<br />
Physics<br />
Nanotechnology<br />
-78.51%<br />
-74.97%<br />
Medicine<br />
-49.23%<br />
Mathematics<br />
Materials science<br />
-60.61%<br />
-60.31%<br />
Engineering<br />
Information and computer science<br />
-47.58%<br />
-47.36%<br />
Geosciences<br />
-54.67%<br />
Energy<br />
-31.60%<br />
Chemistry<br />
-46.37%<br />
Biology and biotechnology<br />
-63.31%<br />
Agricultural science<br />
-32.63%<br />
Multidisciplinary journals<br />
-65.58%<br />
-90% -80% -70% -60% -50% -40% -30% -20% -10% 0%<br />
Benchmark Germany<br />
Figure 100(b): Citation rates for Malaysia compared to the selected benchmark Germany<br />
128
Central Library<br />
Number of publications by Iran compared to Germany<br />
Physics<br />
Nanotechnology<br />
Medicine<br />
Mathematics<br />
Materials science<br />
Engineering<br />
Information and computer science<br />
Geosciences<br />
Energy<br />
Chemistry<br />
Biology and biotechnology<br />
Agricultural science<br />
Multidisciplinary journals<br />
-96.74%<br />
-96.12%<br />
-97.12%<br />
-90.81%<br />
-95.10%<br />
-90.37%<br />
-95.39%<br />
-95.87%<br />
-94.88%<br />
-89.59%<br />
-97.12%<br />
-89.63%<br />
-93.23%<br />
-110% -100% -90% -80% -70% -60% -50% -40% -30% -20% -10% 0%<br />
Benchmark Germany<br />
Figure 101(a): Number of publications by Iran compared to the selected benchmark Germany<br />
Citation rates for Iran compared to Germany<br />
Physics<br />
Nanotechnology<br />
Medicine<br />
-74.91%<br />
-69.46%<br />
-63.40%<br />
Mathematics<br />
Materials science<br />
Engineering<br />
Information and computer science<br />
-52.82%<br />
-59.76%<br />
-53.23%<br />
-54.25%<br />
Geosciences<br />
-69.75%<br />
Energy<br />
Chemistry<br />
-56.32%<br />
-50.61%<br />
Biology and biotechnology<br />
-80.61%<br />
Agricultural science<br />
-66.57%<br />
Multidisciplinary journals<br />
-98.12%<br />
-110% -100% -90% -80% -70% -60% -50% -40% -30% -20% -10% 0%<br />
Benchmark Germany<br />
Figure 101(b): Citation rates for Iran compared to the selected benchmark Germany<br />
129
Central Library<br />
3.4 Discipline-Specific Profiles of the Publication Output and its Perception<br />
This section compares the discipline-specific publication behaviour of the South-East <strong>Asia</strong>n<br />
countries as well as the perception of these publications. In contrast to the preceding chapters,<br />
the benchmark here is a global reference. All research articles and reviews published in 2007<br />
are the basis of this analysis.<br />
Not all disciplines are equally represented in the Science Citation Index. As illustrated by the<br />
graphic below, around one third of all publications in the database are in the area of medicine,<br />
while only around 4 % of the publications are in mathematics.<br />
Number of "research articles" and "reviews" published in<br />
Web of Science in 2007<br />
(total number of "research articles"and "reviews " published in 2007 in WoS: 853,497)<br />
Medicine<br />
Biology and biotechnology<br />
Chemistry<br />
Physics<br />
Engineering<br />
Geosciences<br />
Materials science<br />
Agricultural science<br />
Mathematics<br />
Information and computer …<br />
Nanotechnology<br />
Energy<br />
Multidisciplinary journals<br />
59,291<br />
53,064<br />
35,883<br />
33,495<br />
22,851<br />
10,973<br />
10,246<br />
8,938<br />
142,667<br />
118,267<br />
116,663<br />
92,090<br />
289,765<br />
Figure 102: Distribution of the document types “research article” and “review” in terms of publications in<br />
the Web of Science in individual disciplines.<br />
The unequal publication distribution is due to the fact that the disciplines have different<br />
communication behaviour. For this reason, sound bibliometric analyses must be conducted on a<br />
discipline-by-discipline basis. The global reference excludes possible distortions that could be<br />
implicit in another benchmark (e.g. comparisons with Germany).<br />
The following network diagrams illustrate the share of publications published by a particular<br />
country in a particular discipline in 2007 as research articles and reviews in the journals<br />
included in the Web of Science in relation to the entire database. For example, in 2007, China<br />
published 20 % of the global output included in the Web of Science in the subject category<br />
“chemistry”. It should be noted that the percentage values cannot be added up because the<br />
sum of all countries is more than 100 % due to co-publications.<br />
130
Central Library<br />
Discipline‐specific publication profiles for China, Japan and Germany<br />
("research articles" & "reviews" published in 2007)<br />
Physics<br />
Agricultural science<br />
30%<br />
25%<br />
Biology and biotechnology<br />
Nanotechnology<br />
20%<br />
15%<br />
Chemistry<br />
10%<br />
Multidisciplinary journals<br />
5%<br />
0%<br />
Energy<br />
China<br />
Japan<br />
Germany<br />
Medicine<br />
Engineering<br />
Mathematics<br />
Geosciences<br />
Materials science<br />
Information and computer<br />
science<br />
Figure 103: Discipline-specific publication profiles for China, Japan and Germany<br />
Discipline‐specific publication profiles for Australia, South Korea and Taiwan<br />
("research articles" & "reviews" published in 2007)<br />
Physics<br />
Agricultural science<br />
6%<br />
5%<br />
Biology and biotechnology<br />
Nanotechnology<br />
4%<br />
3%<br />
Chemistry<br />
2%<br />
Multidisciplinary journals<br />
1%<br />
0%<br />
Energy<br />
Australia<br />
South Korea<br />
Taiwan<br />
Medicine<br />
Engineering<br />
Mathematics<br />
Geosciences<br />
Materials science<br />
Information and computer<br />
science<br />
Figure 104: Discipline-specific publication profiles for Australia, South Korea and Taiwan<br />
131
Central Library<br />
Discipline‐specific publication profiles for New Zealand, Singapore and<br />
Thailand<br />
("research articles" & "reviews" published in 2007)<br />
Physics<br />
Agricultural science<br />
3.0%<br />
2.5%<br />
Biology and biotechnology<br />
Nanotechnology<br />
2.0%<br />
1.5%<br />
Chemistry<br />
1.0%<br />
Multidisciplinary journals<br />
0.5%<br />
Energy<br />
New Zealand<br />
0.0%<br />
Singapore<br />
Thailand<br />
Medicine<br />
Engineering<br />
Mathematics<br />
Geosciences<br />
Materials science<br />
Information and computer<br />
science<br />
Figure 105: Discipline-specific publication profiles for New Zealand, Singapore and Thailand<br />
Discipline‐specific publication profiles for Malaysia<br />
("research articles" & "reviews" published in 2007)<br />
Physics<br />
Agricultural science<br />
1.0%<br />
0.9%<br />
Biology and biotechnology<br />
0.8%<br />
0.7%<br />
Nanotechnology<br />
0.6%<br />
0.5%<br />
Chemistry<br />
0.4%<br />
0.3%<br />
Multidisciplinary journals<br />
0.2%<br />
0.1%<br />
0.0%<br />
Energy<br />
Malaysia<br />
Medicine<br />
Engineering<br />
Mathematics<br />
Geosciences<br />
Materials science<br />
Information and computer<br />
science<br />
Figure 106: Discipline-specific publication profile for Malaysia<br />
132
Central Library<br />
Discipline‐specific publication profiles for Indonesia and Vietnam<br />
("research articles" & "reviews" published in 2007)<br />
Physics<br />
Agricultural science<br />
0.3%<br />
0.2%<br />
Biology and biotechnology<br />
Nanotechnology<br />
0.2%<br />
Chemistry<br />
0.1%<br />
Multidisciplinary journals<br />
0.1%<br />
Energy<br />
Indonesia<br />
0.0%<br />
Vietnam<br />
Medicine<br />
Engineering<br />
Mathematics<br />
Geosciences<br />
Materials science<br />
Information and computer<br />
science<br />
Figure 107: Discipline-specific publication profiles for Indonesia and Vietnam<br />
The network diagrams reveal that the smaller countries have many peaks in their publication<br />
output in the various disciplines, while the larger countries tend to have circular curves. This can<br />
be explained by the fact that the smaller countries usually specialise in individual disciplines,<br />
while the larger countries tend to be equally represented in all disciplines.<br />
A global reference is not just essential in creating publication profiles but also in the<br />
normalisation of the citation rate. This allows a global citation rate to be calculated for each<br />
discipline studied. The citation rate of a country in a discipline can then be measured in relation<br />
to the global citation rate in order to assess the performance of the country.<br />
In the following network diagrams, the percentages are given for each country in each<br />
discipline. A value of 100 % corresponds to the global average. Values above or below 100 %<br />
lie above or below the average citation rate in a discipline, respectively. This reveals that China<br />
is below the global average perception in almost all disciplines.<br />
133
Central Library<br />
Field‐normalised citation rates for Singapore, Thailand and Vietnam<br />
("research articles" and "reviews" 2007)<br />
Physics<br />
Agricultural science<br />
300%<br />
250%<br />
Biology and biotechnology<br />
Nanotechnology<br />
200%<br />
Chemistry<br />
150%<br />
100%<br />
Multidisciplinary journals<br />
50%<br />
0%<br />
Energy<br />
Singapore<br />
Thailand<br />
Vietnam<br />
World<br />
Medicine<br />
Engineering<br />
Mathematics<br />
Geosciences<br />
Materials science<br />
Information and computer science<br />
Figure 108: Field-normalised citation rates for Singapore, Thailand and Vietnam<br />
Field‐normalised citation rates for Australia, China and Japan<br />
("research articles" and "reviews" 2007)<br />
Physics<br />
Agricultural science<br />
250%<br />
200%<br />
Biology and biotechnology<br />
Nanotechnology<br />
150%<br />
Chemistry<br />
100%<br />
Multidisciplinary journals<br />
50%<br />
0%<br />
Energy<br />
Australia<br />
China<br />
Japan<br />
World<br />
Medicine<br />
Engineering<br />
Mathematics<br />
Geosciences<br />
Materials science<br />
Information and computer science<br />
Figure 109: Field-normalised citation rates for Australia, China and Japan<br />
134
Central Library<br />
Field‐normalised citation rates for South Korea and Taiwan<br />
("research articles" and "reviews" 2007)<br />
Physics<br />
Agricultural science<br />
250%<br />
200%<br />
Biology and biotechnology<br />
Nanotechnology<br />
150%<br />
Chemistry<br />
100%<br />
Multidisciplinary journals<br />
50%<br />
Energy<br />
South Korea<br />
0%<br />
Taiwan<br />
World<br />
Medicine<br />
Engineering<br />
Mathematics<br />
Geosciences<br />
Materials science<br />
Information and computer science<br />
Figure 110: Field-normalised citation rates for South Korea and Taiwan<br />
Field‐normalised citation rates for Indonesia, Malaysia and New Zealand<br />
("research articles" and "reviews" 2007)<br />
Agricultural science<br />
Physics<br />
180%<br />
160%<br />
Biology and biotechnology<br />
140%<br />
Nanotechnology<br />
120%<br />
100%<br />
Chemistry<br />
80%<br />
60%<br />
Multidisciplinary journals<br />
40%<br />
20%<br />
0%<br />
Energy<br />
Indonesia<br />
Malaysia<br />
New Zealand<br />
World<br />
Medicine<br />
Engineering<br />
Mathematics<br />
Geosciences<br />
Materials science<br />
Information and computer science<br />
Figure 111: Field-normalised citation rates for Indonesia, Malaysia and New Zealand<br />
135
Central Library<br />
4. Network <strong>Analysis</strong><br />
In the last chapter of this study, network analyses based on the data gathered previously are<br />
used to discuss one of the central questions of this study: how has scientific cooperation<br />
developed between the countries studied in South-East <strong>Asia</strong>? Have cooperations intensified<br />
above the average?<br />
1998 2007<br />
Total output<br />
inc. collaborative<br />
papers with<br />
countries in South-<br />
East <strong>Asia</strong><br />
Total output<br />
South-East<br />
<strong>Asia</strong>n countries 153834 292516<br />
inc. collaborative<br />
papers with countries<br />
in South-East <strong>Asia</strong><br />
Australia 26228 1376 39580 4114<br />
China 21104 1737 99728 7835<br />
Indonesia 402 128 819 358<br />
Japan 78514 2374 89714 6322<br />
Malaysia 850 134 2404 583<br />
New Zealand 5284 522 7505 1272<br />
Singapore 2995 335 7774 1729<br />
South Korea 11893 766 33701 2767<br />
Taiwan 9615 590 21233 2177<br />
Thailand 1179 219 4255 974<br />
Vietnam 253 54 855 286<br />
Table 7: Total output of the countries and number of collaborative papers with at least one of the other<br />
countries in South-East <strong>Asia</strong> for the period 1998 – 2007<br />
Table 7 shows how many publications were published by each country between 1998 and 2007<br />
and how many of these articles are collaborative papers with at least one of the other countries<br />
studied. It we add up the output of each of the countries, we get a value that is larger than the<br />
total output of the South-East <strong>Asia</strong>n countries (153,834 and 292,516 publications, respectively)<br />
because co-publications by the countries analysed are counted more than once.<br />
The percentage of the total output of the South-East <strong>Asia</strong>n countries shown in Table 8 reflect<br />
how often a country in the region studied publishes in collaboration with at least one other<br />
country in this region. This value reflects the cooperations within the network of South-East<br />
<strong>Asia</strong>n countries. It is revealed that countries with a low publication output generate a large<br />
proportion of their scientific output in cooperation with other countries in the region studied. The<br />
opposite is also true, namely that countries with very large publication numbers are involved to a<br />
much smaller extent in joint publications.<br />
136
Central Library<br />
Share of total<br />
output of South-<br />
East <strong>Asia</strong>n<br />
countries<br />
1998 2007<br />
Share of publications<br />
with at least one<br />
other South-East<br />
<strong>Asia</strong>n country in<br />
relation to a<br />
country’s total output<br />
Share of total<br />
output of South-<br />
East <strong>Asia</strong>n<br />
countries<br />
Share of<br />
publications with at<br />
least one other<br />
South-East <strong>Asia</strong>n<br />
country in relation<br />
to a country’s total<br />
output<br />
Australia 17.05% 5.25% 13.53% 10.39%<br />
China 13.72% 8.23% 34.09% 7.86%<br />
Indonesia 0.26% 31.84% 0.28% 43.71%<br />
Japan 51.04% 3.02% 30.67% 7.05%<br />
Malaysia 0.55% 15.76% 0.82% 24.25%<br />
New Zealand 3.43% 9.88% 2.57% 16.95%<br />
Singapore 1.95% 11.19% 2.66% 22.24%<br />
South Korea 7.73% 6.44% 11.52% 8.21%<br />
Taiwan 6.25% 6.14% 7.26% 10.25%<br />
Thailand 0.77% 18.58% 1.45% 22.89%<br />
Vietnam 0.16% 21.34% 0.29% 33.45%<br />
Table 8: Publications by a country as a percentage of the total output of South-East <strong>Asia</strong>n countries and<br />
percentage of the articles produced together with at least one other South-East <strong>Asia</strong>n country (1998 and<br />
2007)<br />
Relationship between publication output and cooperation of South-East <strong>Asia</strong>n countries 1998<br />
100000<br />
100%<br />
75000<br />
75%<br />
number of publications<br />
50000<br />
31.84%<br />
50%<br />
share of co-publications<br />
25000<br />
25%<br />
0<br />
3.02%<br />
5.25%<br />
8.23%<br />
Japan Australia China South<br />
Korea<br />
6.44%<br />
Taiwan<br />
6.14%<br />
9.88%<br />
New<br />
Zealand<br />
11.19%<br />
18.58%<br />
15.76%<br />
21.34%<br />
Singapore Thailand Malaysia Indonesia Vietnam<br />
0%<br />
publications<br />
share of co-publications<br />
Figure 112: Relationship between publication output and cooperations in South-East <strong>Asia</strong> 1998<br />
Figure 112 compares the publication output and the proportion of publications produced in<br />
cooperation with at least one other South-East <strong>Asia</strong>n country (i.e. at least two of the eleven<br />
countries studied were listed in the authors’ addresses). Indonesia tops the list: almost one third<br />
137
Central Library<br />
of all Indonesian publications in 1998 were produced within the research area analysed.<br />
Indonesia’s most important cooperation partners are Japan, Australia and Thailand. Its most<br />
important international partner is the USA. Germany features as its forth most important<br />
international partner. With 402 publications, Indonesia has the second lowest scientific output<br />
within the research area studied; Vietnam has the lowest. With 78,514 published journal articles,<br />
Japan, in contrast, was well ahead of all other countries in South <strong>Asia</strong> in 1998. However, only<br />
3 % of its total output was published in cooperation with one of the other countries. The most<br />
important partners for Japanese scientists came from the USA, Germany and the United<br />
Kingdom. In forth place, China features as the first South-East <strong>Asia</strong>n cooperation partner. In<br />
seventh and eight place are South Korea and Australia. As can be seen from the share of the<br />
total output of South-East <strong>Asia</strong>n countries in Table 8, Japan was responsible for more than half<br />
of the publications in the region with its high publication output in 1998. Australia and China<br />
follow with 17 % and 13 %, respectively. Ten years later, this relationship changed: thanks to its<br />
almost exponential increase in publications, China became the most important country studied<br />
with 34 %. Japan, New Zealand and Australia lost some of their influence to all of the other<br />
countries analysed. Despite this, cooperation between these countries and the other countries<br />
excluding China increased disproportionately in relation to the total publication output. The drop<br />
of 4.55 % in China’s share of publications by South-East <strong>Asia</strong> in the countries’ total output<br />
compared to 1998 can be explained by a huge increase in the number of publications. Between<br />
1998 and 2007, the number of Chinese publications increased by around 370 %. Copublications<br />
with the other South-East <strong>Asia</strong>n countries increased from 1,737 to 7,835,<br />
representing an increase of 350 %. China therefore cooperated less in relation to its total output<br />
in 2007 than it did with the research area in 1998. This statement must be considered in relation<br />
to China’s total output and its exponential increase.<br />
Increase between 1998 and 2007<br />
Development of the share of total<br />
output of the South-East <strong>Asia</strong>n<br />
countries<br />
Development of the share of<br />
publications with one of the other<br />
countries studied in relation to the total<br />
output of a country<br />
Australia -20.64% 98.12%<br />
China 148.52% -4.55%<br />
Indonesia 7.14% 37.28%<br />
Japan -39.91% 133.06%<br />
Malaysia 48.74% 53.83%<br />
New Zealand -25.31% 71.57%<br />
Singapore 36.51% 98.84%<br />
South Korea 49.02% 27.48%<br />
Taiwan 16.14% 67.09%<br />
Thailand 89.80% 23.23%<br />
Vietnam 77.72% 56.72%<br />
Table 9: Development of the share of publications by country in relation to the total output of the countries<br />
studied and the share of co-publications with one of the other countries analysed<br />
If we compare Figures 112 and 113, which depict the behaviour of the publication output and<br />
the percentage of South-East <strong>Asia</strong>n co-publications in relation to the total output of a country, it<br />
becomes clear that networking between the countries studied continues to develop in opposition<br />
to the publication output. All countries do not only publish more in absolute terms but they have<br />
also increased their share of cooperations with one of the other countries analysed. Indonesia<br />
remains the country with the highest number of co-publications in South-East <strong>Asia</strong> publishing<br />
almost half of its articles together with at least one of the other countries studied. As the<br />
countries with a low publication output generate a high share of their articles in cooperations<br />
138
Central Library<br />
within South-East <strong>Asia</strong>, we can conclude that there is a high degree of dependency on a<br />
possible research area. The cooperation figures of developed countries, such as Japan and<br />
Australia, also experience a significant increase. As a result, we can speak of increasing<br />
cooperation in South-East <strong>Asia</strong>.<br />
Relationship between publication output and cooperation of South-East <strong>Asia</strong>n countries 2007<br />
100000<br />
100%<br />
75000<br />
75%<br />
number of publications<br />
50000<br />
33.45%<br />
43.71%<br />
50%<br />
share of co-publications<br />
25000<br />
22.24%<br />
16.95%<br />
22.89%<br />
24.25%<br />
25%<br />
7.86% 7.05%<br />
10.39%<br />
8.21%<br />
10.25%<br />
0<br />
0%<br />
publications<br />
share of co-publications<br />
Figure 113: Relationship between publication output and cooperations in South-East <strong>Asia</strong> 2007<br />
The network diagrams in Figures 114 to 117 clearly illustrate increasing networking between the<br />
countries studied for the period 1998 – 2007. Figures 114 and 115 show the development of the<br />
co-published journal articles between 1998 and 2007 in the form of network diagrams. The copublications<br />
are indicated by the lines joining the dots representing the countries. The thicker<br />
the line, the greater the number of co-publications. The joint co-publications are relativised with<br />
respect to the output of the country. Salton’s measure of international collaboration strength (S)<br />
was applied. This measures the strength of networking activities between two countries x and y,<br />
and relativises this strength to the size of the output of the two countries. This value is<br />
calculated by dividing the number of joint co-publications of two countries (C xy ) by the root of the<br />
product of the total publications of country x (C x ) and country y(C y ).<br />
S<br />
xy<br />
=<br />
C<br />
C<br />
x<br />
xy<br />
⋅C<br />
y<br />
The diagrams in Figures 114 and 115 show that networking among the countries has increased<br />
perceptibly between 1998 and 2007. Since the co-publications have been relativised with<br />
respect to the total output of a country, the extreme increase in joint publications cannot be<br />
explained by the general rise in scientific output within these ten years. On the contrary,<br />
cooperation in the form of scientific networking within the research area studied has increased<br />
at a disproportionate rate and the network has become denser.<br />
139
Central Library<br />
Figure 114: Co-publication network 1998 relativised using Salton’s international collaboration strength<br />
Figure 115: Co-publication network 2007 relativised using Salton’s international collaboration strength<br />
140
Central Library<br />
Figures 116 and 117 show the international co-publications by the eleven countries. In 1998,<br />
the countries analysed published with 140 countries throughout the world; ten years later, they<br />
were involved in scientific cooperations with 169 countries. The network diagrams therefore<br />
have 151 and 180 dots representing the countries, respectively. The strength of the connections<br />
between the dots reflects how intense cooperation between the different countries actually is.<br />
The more joint publications, the thicker the lines between the country dots. The general position<br />
of the countries reflects their importance in the network: If a country dot is central, then this<br />
country cooperates in networks with many other countries. The closer the dots are in the centre,<br />
the more pronounced their connections with each other.<br />
When 1998 and 2007 are compared, it becomes clear that the South-East <strong>Asia</strong>n countries have<br />
drawn closer together. This is reflected by the fact that networks within the research area have<br />
increased. This trend also verifies the above-mentioned growth rates. The density of the<br />
networks between these countries and those outside the area studied also increased between<br />
1998 and 2007. This cannot be explained by the overall increase in publications as the number<br />
of co-publications was relativised with respect to the output of each country. Moreover, another<br />
trend also becomes visible: scientific publications are increasingly being published by a number<br />
of authors – including those in different countries. Pronounced networks with countries outside<br />
the research area analysed include those with the USA, the United Kingdom, Germany, France<br />
and the Netherlands.<br />
The analysis of network diagrams clearly reveals that networks within the region analysed are<br />
becoming more intense and that cooperations with countries outside this research area are<br />
being dismantled.<br />
141
Central Library<br />
Figure 116: International co-publications of the countries analysed in 1998, relativised with respect to the publication output of each<br />
country<br />
142
Central Library<br />
Figure 117: International co-publications of the countries analysed in 2007, relativised with respect to the publication output of each<br />
country<br />
143
Central Library<br />
With the aid of a network analysis, we studied the output of South-East <strong>Asia</strong>n countries (both<br />
between the countries studied and with others outside this area) and illustrated the results in the<br />
form of a network diagram. Using Salton’s measure, a normalisation was performed. The results<br />
of these investigations allow us to draw the conclusion that cooperation between the countries<br />
studied has intensified in the period from 1998 to 2007 and that an <strong>Asia</strong>-<strong>Pacific</strong> research area<br />
has emerged. This conclusion is based solely on the bibliometric analyses performed in this<br />
study and must be supplemented with more results before it can be generalised.<br />
A counter example, in which ten selected countries with the same bibliometric parameters are<br />
investigated in the same manner as the South-East <strong>Asia</strong>n countries, should furthermore prove<br />
that increasing networking activities within the research area investigated cannot be explained<br />
by a general global increase in international cooperations nor are they simply a matter of<br />
coincidence.<br />
Verification of networks using randomly selected countries<br />
In the preceding investigation, different analysis methods revealed that cooperation between the<br />
key countries increased disproportionately between 1998 and 2007. To conclude that the<br />
proportion of international co-publications has generally increased worldwide, the same method<br />
will be applied in the following to a counter sample of ten 9 selected countries 10 . Figure 118<br />
shows the annual number of scientific publications by the selected comparative countries<br />
between 1992 and 2007. Germany and Japan, which have already been analysed in relation to<br />
South-East <strong>Asia</strong>, once again come out way ahead of the other countries. France and Russia<br />
follow in third place. In the case of Russia, the drop in the number of scientific papers must be<br />
considered in the context of the political collapse. Excluding Russia, the publication output of all<br />
countries investigated increased between 1992 and 2007.<br />
Publication output of the ten selected countries between 1992 and 2007<br />
120000<br />
100000<br />
number of publications<br />
80000<br />
60000<br />
40000<br />
20000<br />
0<br />
1992 1993 1994 1995 1996 1997 1998 1999 2000 2001 2002 2003 2004 2005 2006 2007<br />
Argentina Brazil France Germany Japan Mexico South Africa South Korea Ukraine Russia<br />
Figure 118: Publication output of the ten selected countries between 1992 and 2007<br />
9 The countries chosen are: Argentina, Brazil, Germany, France, Japan, Mexico, South Africa, South Korea, Ukraine<br />
and Russia.<br />
10 The selection was made based on the following criteria: both small and large countries (measured in terms of<br />
publication output), countries from South-East <strong>Asia</strong>, as well as countries with and without geographical<br />
relationships.<br />
144
Central Library<br />
1998 2007<br />
Total output<br />
inc. collaborative<br />
papers with one of the<br />
other selected<br />
comparative countries Total output<br />
Selected<br />
countries 274810 357203<br />
inc. collaborative<br />
papers with one of<br />
the other selected<br />
comparative<br />
countries<br />
Germany 80902 6640 104928 10565<br />
Japan 78514 3020 90682 5089<br />
South Korea 11898 877 34172 2329<br />
Brazil 10580 1179 28478 2133<br />
Mexico 4856 534 9969 1048<br />
South Africa 4620 309 7616 780<br />
France 57000 4954 69298 9044<br />
Russia 29129 3733 27688 4639<br />
Ukraine 4378 765 4601 1133<br />
Argentina 4559 490 7001 1138<br />
Table 10: Total output of the countries and number of collaborative papers with at least one of the other<br />
comparative countries for the period 1998 – 2007<br />
Table 10 shows the total output of the selected countries for the period 1998 to 2007 and the<br />
number of articles published by these countries in cooperation with at least one of the other<br />
selected countries. Table 11 contains these values as percentages. In 1998, Ukraine and<br />
Russia published the most within this community of countries. While these figures were around<br />
17 % and 13 % for the selected comparative countries, they were well above this in South-East<br />
<strong>Asia</strong>: approx. 32 % for Indonesia, approx. 21 % for Thailand and approx. 19 % for Vietnam.<br />
Furthermore, as shown in Figures 119 and 120, no clear relationship was found between the<br />
publication output of a country and cooperation with one of the randomly selected countries.<br />
Although the share of jointly published articles increased in the case of seven of the ten<br />
randomly selected countries between 1998 and 2007 (see Table 12), the figures for the South-<br />
East <strong>Asia</strong>n countries increased even more significantly. Taken together, the selected<br />
comparative countries published a total of 273,810 scientific journal articles in 1998 and<br />
357,203 in 2007.<br />
145
Central Library<br />
Share of total<br />
output of selected<br />
comparative<br />
countries<br />
1998 2007<br />
Share of<br />
publications with<br />
at least one other<br />
selected country in<br />
relation to a<br />
country’s total<br />
output<br />
Share of total<br />
output of selected<br />
comparative<br />
countries<br />
Share of<br />
publications with at<br />
least one other<br />
selected country in<br />
relation to a<br />
country’s total<br />
output<br />
Germany 29.44% 8.21% 29.37% 10.07%<br />
Japan 28.57% 3.85% 25.39% 5.61%<br />
South Korea 4.33% 7.37% 9.57% 6.82%<br />
Brazil 3.85% 11.14% 7.97% 7.49%<br />
Mexico 1.77% 11.00% 2.79% 10.51%<br />
South Africa 1.68% 6.69% 2.13% 10.24%<br />
France 20.74% 8.69% 19.40% 13.05%<br />
Russia 10.60% 12.82% 7.75% 16.75%<br />
Ukraine 1.59% 17.47% 1.29% 24.63%<br />
Argentina 1.66% 10.75% 1.96% 16.25%<br />
Table 11: Publications by a country as a percentage of the total output of the selected countries and<br />
share of the articles produced with at least one other selected country (1998 and 2007)<br />
Relationship between publication output and cooperation of selected comparative countries 1998<br />
100000<br />
100%<br />
75000<br />
75%<br />
number of publications<br />
50000<br />
50%<br />
share of co-publications<br />
25000<br />
25%<br />
0<br />
11.14%<br />
12.82%<br />
17.47%<br />
11.00%<br />
10.75%<br />
8.21%<br />
8.69%<br />
7.37%<br />
6.69%<br />
3.85%<br />
Germany Japan France Russia South Korea Brazil Mexico South Africa Argentina Ukraine<br />
0%<br />
publications<br />
share of co-publications<br />
Figure 119: Relationship between publication output and cooperation in the selected comparative<br />
countries 1998<br />
146
Central Library<br />
Development of the share of total<br />
output of selected comparative<br />
countries<br />
Growth<br />
Development of the share of<br />
publications with one of the other<br />
selected comparative countries in<br />
relation to the total output of a country<br />
Germany -0.22% 22.68%<br />
Japan -11.14% 45.90%<br />
South Korea 120.96% -7.54%<br />
Brazil 107.08% -32.79%<br />
Mexico 57.94% -4.40%<br />
South Africa 26.82% 53.13%<br />
France -6.47% 50.16%<br />
Russia -26.87% 30.74%<br />
Ukraine -19.15% 40.93%<br />
Argentina 18.14% 51.24%<br />
Table 12: Development of the share of publications by country in relation to the total output of the<br />
selected countries and the share of co-publications with one of the other selected comparative countries<br />
Relationship between publication output and cooperation of selected comparative countries 2007<br />
120000<br />
100%<br />
100000<br />
75%<br />
number of publications<br />
80000<br />
60000<br />
40000<br />
50%<br />
share of co-publications<br />
20000<br />
0<br />
24.63%<br />
13.05%<br />
10.51%<br />
16.25%<br />
16.75%<br />
10.07%<br />
10.24%<br />
7.49%<br />
5.61%<br />
6.82%<br />
Germany Japan France South Korea Brazil Russia Mexico South Africa Argentina Ukraine<br />
25%<br />
0%<br />
publications<br />
share of co-publications<br />
Figure 120: Relationship between publication output and cooperation in the selected comparative<br />
countries 2007<br />
The network diagrams in Figures 121 and 122 clearly show that the number of jointly published<br />
journal articles increased between 1998 and 2007. As the number of co-publications by two<br />
countries has been relativised in relation to the countries’ output using Salton’s measure of<br />
international collaboration strength, the increase in the number of articles published in<br />
cooperation with another country cannot be explained by a general increase in the number of<br />
publications over the ten years studied here. A clear increase can therefore be ascertained in<br />
international scientific cooperation between 1998 and 2007.<br />
147
Central Library<br />
Figure 121: Co-publications of the randomly selected countries in 1998 relativised using Salton’s measure<br />
of international collaboration strength<br />
Figure 122: Co-publications of the randomly selected countries in 2007 relativised using Salton’s measure<br />
of international collaboration strength<br />
If we compare the development of South-East <strong>Asia</strong> and the community of selected comparative<br />
countries, it becomes clear that the increase in cooperations between South-East <strong>Asia</strong>n<br />
148
Central Library<br />
countries is much larger than in the case of the ten selected countries. In the case of the<br />
countries in South-East <strong>Asia</strong>, the network as a whole becomes much denser in 2007. In the<br />
case of the network of selected comparative countries, the relationships between the countries<br />
have only become denser for countries in the same geographical region: a pronounced increase<br />
was determined between France and Germany, Argentina and Brazil, Japan and South Korea,<br />
and Ukraine and Russia. The increase in ties between Russia and France and Germany,<br />
however, cannot be explained geographically. A role is probably played by the fact that Russia<br />
was the only country whose output decreased between 1998 and 2007.<br />
Comparing the networks reveals that the international cooperation between countries within a<br />
research area is much stronger than between selected countries. We can therefore conclude<br />
that an <strong>Asia</strong>n-<strong>Pacific</strong> research area has emerged from a bibliometric perspective within the last<br />
ten years. By adding further data and information from the scientific environment of these<br />
countries, this conclusion based on bibliometric data can be used to evaluate whether a<br />
research area that is not just based on the evaluation of scientific publications has actually<br />
developed between the countries.<br />
149